


Introduction
The Antarctic Circumpolar Current (ACC) in the Souillent Ocean is the world’s largest ocean current, flowing virtually without obstruction, apart from through the Drake Passage, eastwards around Antarctica. It has free northern boundaries and thus connects the Antarctic with the South Atlantic, South Pacific and Indian Oceans and hence to all the world’s oceans. Indeed, Antarctic Bottom Water (AABW) has been observed as Tar as 50°N (Nicholls and others, 1991). The most important source of bottom water in the Southern Ocean is thought to be the Weddell Sea (Foldvik and Gammelsrød, 1988), accounting for about 80% of total production and water modified by passage under the Filchner–Ronne Ice Shelf is a major constituent. Thus, the Antarctic ice shelves, and in particular the Filchner–Ronne Ice Shelf, could have an important influence on the global ocean and are therefore important when considering the world’s climate. Conversely, because of the intimate thermal contact between the base of the ice shelf and the underlying ocean, changes in climate could have an effect on the outflow of water from under the ice shelf. Jenkins (1991) suggested that a temperature rise of 0.6° C in the underlying water could increase the basal melt rate four-fold, which might have a significant effect on circulation on the continental shelf with far-reaching consequences for global ocean circulation.
Thermohaline convection is thought to be the main factor controlling large-scale circulation under ice shelves (Nicholls and others, 1991). In the Weddell Sea, dense Western Shelf Water (WSW) is formed by salt rejection from the production of sea ice. The action of the tides and prevailing winds moves the sea ice away from the ice front, thus keeping the ocean surface exposed, with a consequential intensification in the production of sea ice and salt release. The dense WSW sinks and flows down the sea floor under the ice shelf, arriving at the base of the ice at the grounding line, where the freezing point is about −3°C. This relatively warm WSW causes basal melting and this relatively buoyant mixture of WSW and meltwater rises along the base of the ice shelf. More WSW is entrained by the flow and the increase in melting point with reduction in pressure causes a reduction in melt rate. Eventually, the upward-flowing water becomes supercooled and frazil-ice crystals precipitate out. Further entrainment of WSW causes the water plume to increase in density until it becomes detached from the ice-shelf base and emerges as Ice Shelf Water (ISW). This water flows over the continental shelf and forms AABW by mixing with the warmer intermediate waters of the Southern Ocean. Because there is no contact between the atmosphere and the ocean, sub-ice-shelf circulation and mixing, and heat transport, are forced by tidal action (MacAyeal, 1984; Doake, 1992). It is therefore important to understand the tides and the interactions between the tides and the ice shelf.
It is also important to consider the interaction of tides with ice shelves as a mechanism for dissipation of tidal energy. Close to the ice front, the floating ice shelf is expected to move freely with changing water level. In a bending zone near to the grounding line, however, flexure of the ice will dissipate tidal energy due to plastic deformation (Doake, 1978) and there is evidence for abnormal tides under several Antarctic ice shelves (Pedley and others, 1986). One might also expect the age of the semi-diurnal tide to be high if energy is being lost and, although there are few records from the area, the majority show ages greater than 60 h, comparable with other areas of the ocean where tidal energy dissipation is high (Webb, 1973). Holdsworth (1977) has calculated the hinge-line bending stress by analysing the flexure of floating ice which is restrained at one end and Doake (1978) has used these results to estimate the rate of dissipation of tidal energy by Antarctic ice shelves. His value of 2.0 × 10¹² W is almost one-third of the rate required to account for the astronomically observed slowing of the Earth’s rotation and the deceleration of the Moon in its orbit, phenomena which are thought to be caused by tidal friction and, although it has been suggested recently that this value may be overestimated (Ray, 1995), it is likely that the Antarctic ice shelves are a significant sink for tidal energy.
In a different context, it is also important to be able to model the tides of the ice shelves since tidal height corrections are required for surface-elevation measurements from satellite altimetry.
This paper describes a preliminary investigation into the tides of the Weddell Sea by the use of a numerical model.
The Numerical Model
A simple description of the numerical model is given here. A more detailed account has been given by Flather (1981, 1994). Considering a vertical column of sea water, changes in sea-surface elevation are associated with a net flux of water in or out of the column, i.e. conservation of volume. This is expressed by the continuity equation, which, in spherical polar coordinates and in its depth-averaged form may be written as

The depth-averaged equations of motion for each coordinate direction which relate the acceleration of the water to the applied forces are


where t is time, χ and φ are longitude (east) and latitude (< 0, south), ζ
b is the elevation of the sea bed above its undisturbed level, ζ is the elevation of the sea surface relative to the Earth as measured by a tide gauge (=ζ
s – ζ
b, where ζ
s is the elevation of the sea surface above its undisturbed level),  is the equilibrium tide, u and υ are the components of the depth-mean current q, F
b and G
b, are the components of bottom stress τ
b, D is the total water depth (= h + ζ, where h is the undisturbed depth), ρ is the (uniform) density of sea water (1.025 × 10³ kgm−3), R is the radius of the Earth (6.37 × 10⁶ m), g is the acceleration due to gravity (9.81 m s−2), f is the Coriolis parameter (f = 2ω sin φ, where ω is the angular speed of rotation of the Earth) and A
h is the horizontal eddy viscosity parameter (5.0 m2 s−1).
Deformation of the sea bed is represented by ζ
b and the effects of lunar and solar forcing are represented by the equilibrium tide  . The total water depth, D, is the instantaneous depth of the water column extending from the sea bed to either the sea surface (in the open ocean) or the ice-shelf base (in the region of permanent ice cover). The relationships between the various elevations and depths are shown in Figure 1. The value of 5.0 m2 s−1 for the eddy viscosity, A
h
, is arbitrary and has little influence on the model results.
Schematic diagram showing the relationship between the various depths and elevations used in the model. Under the ice shelf, the level of the sea surface (z = ζ s) is coincident with the base if the ice shelf The instantaneous water-column depth, D, is the distance from the (distorted) sea bed to either the base of the ice shelf (under the ice) or the sea surface (in the open ocean).

The bottom stress, τ, is expressed in terms of the depth mean current q, as
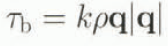
where k is the bottom-friction parameter.
Stresses between the base of the ice shelf and the underlying sea water are not included in the model. Dissipation of tidal energy by the tee shelf is simulated by increasing the bottom-friction coefficient, k, under the ice (MacAyeal, 1984).
Initial conditions may be expressed as a “cold start”, i.e. the sea is initially at rest with no surface disturbance

Finally, conditions at coastal and open boundaries must be specified. On coastal boundaries, the component of the depth-mean current normal to the boundary, q n , must be 0. At the open-sea boundary, Γ, a simple elevation-specified boundary condition may be used. This may be written as

where  is a prescribed function of position and time.
Equation (1)–Equation (4) are expressed in finite-difference form using elevations and current components discretized on to the model grid and are solved within the model domain subject to the specified initial and boundary conditions. The grid used is the Arakawa “C-grid”. Full details of the numerical scheme have been given in Flather (1994) and references therein.
Model Domain, Bathymetry and Open-Boundary Conditions
The area selected for the model is shown in Figure 2. The full model domain covers the region from 60° to 85° S in latitude and 90° to 10° W in longitude. The finite-difference grid was chosen to be 40′ in longitude and 10′ in latitude, i.e. a grid-box size of about 37.0 km in longitude at the northern boundary and 6.5 km at the southern boundary, by 18.5 km in latitude. Within the grid there are coastal boundaries along the Antarctic Peninsula to the west and Coats Land to the east with open-sea boundaries along 60° S, 60° W and 10° W. As the model includes an area of permanent ice cover, it is necessary to specify the depth of the water column rather than bathymetry. (Clearly, in the open ocean, bathymetry and water-column thickness are the same.) Initial runs of the model used a data set interpolated on to the grid from seismic water-column thickness data (Pozdeyev and Kurinin, 1987) under the ice shelves and the U.S. Naval Oceanographic Office DBDB5 data set elsewhere (Wyckhouse, 1973). Later runs used an improved data set, with water-column depth south of 75° S derived from ice-shelf thickness and bathymetry from the digital data set of Vaughan and others (1994), again using the DBDB5 data set north of this latitude. This bathymetry is shown in Figure 2. The bathymetry of the ice-shelf region is shown in more detail in figure 3a. figure 3b shows the water column thickness for the same region. Comparison of these two figures gives an indication of the complexity of the region under investigation.
Model domain and bathymetry (m). The numbered dots indicate sites at which there are tidal measurements. These data are described in the text and are listed in Table 2. The dashed line shows the extent of the permanent ice.

Bathymetry (a) and water-column thickness (b) in m for the ice-covered region. The permanent ice front is shown by the dashed line.

Open-boundary conditions were elevation-specified using the global ocean model of Schwiderski (1980a, b) with amplitudes and phases for the principal diurnal and semi-diurnal tidal constituents extracted from the model and interpolated onto the numerical model grid. These boundary conditions were used throughout the preliminary investigations described in this paper. It is recognized that other, perhaps better, global tide models are available (Andersen and others, 1995) and some of these will be the subject of future investigation, although the Schwiderski model gives reasonable agreement with data from pelagic sites near to the open boundaries (see Table 1).
Comparison of pelagic measurements with Schwiderski’s model for the principal semi-diurnal (M 2 , S 2 ) and diurnal (Ο 1 , K 1) tidal constituents at various sites near the model open boundaries. For each site the first line is the measurement and the second is the model output. All measurements are from the unpublished (1994) Appendix to the IAPSO Pelagic Tidal Constants publication (Smithson, 1992) except site G (Smithson, 1992)

Measurements
There are, unfortunately, few data available from the region for comparison with the model results. Figure 2 shows the locations of those known within the model domain. Table 2 lists the semi-diurnal tidal constituents M 2 and S 2 and the diurnal constituents O 1 and K 1 measured at each site.
Principal semi-diurnal (M2 , S 2 ) and diurnal (O 1 , K 1) tidal constituents for all known sites within the model boundaries

The data from sites 1–7 (Smithson, 1992, unpublished appendix (1994)) are all pelagic measurements made using bottom pressure recorders. Data at sites 1 and 2 from deployments by the Proudman Oceanographic Laboratory (POL) are from long records using multiple sensors. Data from different sensors and at different times at a given site are identical within any experimental uncertainties and should be very reliable. Constituents at sites 3 and 4 were measured by the Alfred-Wegener-Institut (AWI) and are from long, clean time series and are consistent with another site which is close by but outside the model boundary. Data from site 5 by the University of Bergen are from an analysis of 30 d of continuous data which were of very good quality. The constituents at site 6, also by the University of Bergen, are from a noisier time series but this is compensated for by being of a much longer duration. Constituents from sites 1–6 can therefore be considered as being reliable. Data at site 7 are from a record of only 4.2 d in duration and standard errors for the constants may be as large as 6% in amplitude and 3° in phase. This site is near the edge of the Ronne Ice Shelf.
Data from sites 8–15 (Doake, 1992) are gravimeter or tiltmeter measurements. Constituents at site 8, on the Ronne Ice Shelf, are from analysis of 9d of gravimeter data by the British Antarctic Survey (BAS) from a hot-water drill site well away from the coast. Site 9 is on the Filchner Ice Shelf about 2 km from the ice front and 115 km from the nearest land. Analysis is for a gravimeter record of 43 d in length. The original paper (Thiel and others, 1960) gives an amplitude for unresolved components K 1 and P 1 of 41 cm. Constituents for sites 10–12 are gravimeter measurements of duration 5–10 days. Sites 13 and 14 are at the mouth of Rutford Ice Stream. For site 13, the constituents were derived from a tiltmeter record of 43 d. Site 14, although quoted as the same latitude and longitude, is in fact about 20 km downstream from site 13. The gravimeter record at this site was too short for accurate tidal analysis and constituents were extracted by assuming that the phases and relative amplitudes were the same as at site 13 (Doake, 1992). The amplitudes computed are about 30% higher than those from site 13. Site 15 is on Doake Ice Rumples near the grounding line. Analysis was for a record of 43 d duration. Gravimeter and tiltmeter measurements of tides under ice shelves are an indirect method of measurement and various corrections need to be applied in order to extract tidal heights. Amplitudes must therefore be used with caution. Phase lags should be correct, although the short duration of some of these records may mean that some components are unresolved leading to errors in the phases.
Model Runs and Results
Initially, the bottom-friction parameter, k, was set to 0.0025 and the model was allowed to spin up for 7 d and run for a further 7 d. Sea-surface elevations were computed for hourly values and analysed for the M 2 tide. Comparison with measurements at various sites showed that in the open ocean, away from the ice front, there was good agreement between the model and measurements, but over the ice-covered region the agreement worsened with distance from the ice front. Nevertheless, these initial results were encouraging considering the uncertainties inherent in the bathymetry and open-boundary conditions. Subsequent runs of the model used the improved bathymetry of Vaughan and others (1994) and the model was modified to allow the bottom-friction coefficient, k, under the ice-covered water to be different from that in open water. As slated earlier, this was in order to simulate dissipation of tidal energy by the ice shelf. No assumptions are being made about the mechanism for energy dissipation. Following the method of MaeAyeal (1984) the bottom-friction coefficient was doubled to 0.0050. The model was allowed to run for 4 weeks and the hourly elevations produced were analysed for the principal semidiurnal constituents M 2 and S 2 and the diurnal constituents O 1 and K 1 . This was adopted as the “standard” run and used for comparison with all subsequent runs. Figure 4 shows the amplitudes and phases for these four constituents. The main features observed are the amphidromes in M 2 and S 2 at the edge of the Ronne Ice Shelf, Although this is consistent with the available measurements, there are not enough data to support or refute the existence of such a feature. The M 2 tide also appears to be in agreement with the work of Gcnco and others (1994). There is also evidence for maxima in the O 1 and K 1 amplitudes at about 73° S, 50° W near to the continental shelf break. In the open sea the results were consistent with the available measurements. In the ice-covered region there was no significant improvement and, as with the initial runs where the friction coefficients under the ice and in the open ocean were equal, the correspondence between model output and measurements on the ice shelf worsened with distance from the ice front.
Amplitudes mid phases for the principal semi-diurnal and diurnal tidal constituents for the “standard” model run (under-ice betiom-friction coefficient, k, double that in the open ocean). The extent of the permanent ice is given by the dashed line.

In order to reproduce the observed tides at the grounding line sites it was necessary to use a value for the friction parameter under the ice which was 25 times that used for the “standard” run (50 times the open-sea value). The results for the same four tidal constituents, M 2, S 2, O 1 and K 1 , are shown in Figure 5. The effect on the semi-diurnal constituents, M 2 and S 2 , is to move the amphidromes to the west and produce a general increase in the amplitudes, with the earlier agreement with measurements near the ice front, and indeed with the pelagic measurements, being spoiled. However, the measurements near to the grounding line are now reproduced much more accurately. The diurnal constituents O 1 and K 1 are not affected to any large extent but there is a small increase in amplitude with the appearance of further maxima following the line of the continental shelf break. There is little or no change in phase.
Amplitudes and phases for the principal semi-diurnal and diurnal tidal constituents with the under-ice bottom-friction coefficient, k, 50 times that in the open ocean. The extent of the permanent ice is given by the dashed line.

Summary and Discussion
The numerical finite-difference model of Flather (1994) has been used to simulate the tides of the Weddell Sea. Initial findings show that, although the tides of the open ocean can be reproduced satisfactorily, the model is not so effective in the ice-covered regions, especially near to the grounding line. This might be expected as one moves towards sites near the grounding line because of the effects of ice-shelf bending. Flexure of the ice shelf is likely to be significant within several kilometres of the grounding line but it is not thought to be an important factor at greater distances (Holdsworth, 1977). Doubling the friction coefficient under the ice does not produce any significant changes. It is necessary to increase the friction 50-fold under the ice in order to give acceptable results near to the grounding line. The consequence of this is that, for the semi-diurnal tides, any agreement near to the ice edge and in the open ocean is lost. It seems that, in order to produce agreement over the whole region, it may be necessary to use a friction coefficient under the ice shelf which can vary with distance from the grounding line, matching the open-ocean value at the ice front. The diurnal tides are not altered greatly by the increase in bottom friction. However, they do show some interesting effects in the region of the continental shelf break, suggesting the generation of shelf waves.
Future work will involve modifying the model in order to allow for a variable bottom-friction coefficient under the ice. The ellect of using alternative global ocean models for specification of the open-boundary conditions and the importance of the equilibrium tide and sea-bed deformation will also be investigated. In this way, it may be possible to determine some of the factors which are important to the tidal motion.
It is clear that a major constraint in producing an accurate model of the region is the lack of ground-truth data for model validation. There are, however, immense technical problems in taking accurate tidal measurements close to the ice front or, indeed, under the ice itself. Nevertheless, these problems are being addressed and it is possible that bottom-pressure recorders will be deployed near to the permanent ice front early in 1998, with recovery of the instruments the following year. Model experiments will help to pinpoint the best locations for such deployments. It may be that the failure to reproduce the data near to the grounding line is due to some mechanism missing from the model and it is hoped that accurate measurements in the region will allow us to establish a set of model parameters for the southern Weddell Sea, enabling us to gain some insight into the physical processes at work under the ice.



