


The spate of sharply critical think-pieces published over the past few years might seem to suggest that the digital humanities are in something of a crisis, but the discipline – if, indeed, it can be described as such – continues to thrive.Footnote 1 As even a cursory glance through the schemes announced and projects subsidized by (among others) the American Council of Learned Societies and the National Endowment for the Humanities, the Canadian Social Sciences and Humanities Research Council, the British Academy, the Leverhulme Trust, and the Arts and Humanities Research Council, and the European Research Council makes apparent, public and private funding bodies across North America and Western Europe remain robustly supportive of digital humanities initiatives, facilitating cross-disciplinary and cross-sector collaborations and laying the groundwork for research that – in many cases, at least – is orientated towards the capacity for communication beyond traditional readerships. The digital humanities glow with such promise that some of us – among whom I must include myself – have quietly set aside any misgivings we might have, instead finding ways of incorporating digital technologies and methodologies into our work. But mute complicity is not the only alternative to vocal censure, as is made clear by the many accounts of systematic experiments and other personal experiences in the digital humanities posted on blogs – of course! – and, increasingly, published in peer-reviewed journals.Footnote 2 Grounded in self-reflective practices, this sort of autoethnography offers a productive way forward, I suggest, prompting us to consider our complex and sometimes contradictory motivations for engaging with the digital humanities; to think through our research processes; and to contemplate other paths our projects could have taken or, indeed, may yet take. In this essay, I reflect on a digital network visualization and analysis project I have pursued over the past five years, entitled (in its final iteration) ‘Visualizing the French Voice’. I try to understand my motives at each turn, which are clearly bound up with that seductive promise of a broader readership (if, indeed, ‘readership’ is quite the right word for a visualization), but also, albeit much less clearly, of ‘impact’ – a word with particular valence in the United Kingdom, where (since the 2014 Research Excellence Framework) research has been assessed for its academic, economic, and societal impact, but one that remains all too relevant for those of us active in other academic settings as well.
Exactly why I thought the French voice needed to be visualized is a longer story than I have space for here, but it had to do with precisely the sort of interdisciplinary nexus on which the digital humanities are founded. I sketched my first network diagram on a piece of A4 paper at the Bibliothèque Nationale de France, in an attempt, through an initially chaotic web of nodes and edges, to make sense of the relationships between the French physicians, pedagogues, and performers whose names appeared in the vocal treatises, singing methods, and other archival materials I had recently uncovered. I returned often to this piece of paper following my return to the United States, fleshing out my diagram whenever I ran across new names or affiliations that seemed significant in some way to the scientific study of the singing voice in late nineteenth- and early twentieth-century France. I soon found myself overwhelmed not only by the amount of data I had amassed, but also by the haphazardness of my methodology, which seemed to depend far too much on my limited, though rapidly expanding, knowledge of vocal science and singing pedagogy. I was confident, for example, that Manuel Garcia, Jr, belonged in my diagram – many pedagogues and physicians identified him as one of the founders of modern vocal medicine, due in large part to his supposed invention of the laryngoscope – but less certain of the significance of a figure who was, if anything, more compelling: Léon Melchissédec, a renowned operatic bass-baritone turned Paris Conservatoire professor.Footnote 3 Melchissédec's method drew on the latest advances in vocal science – including, for example, the use of photographic technologies to analyse singers’ diction – but garnered far less (and far less complimentary) attention than did Garcia's.Footnote 4 I was less sure still of whether to include scientifically minded pedagogues who taught privately rather than at the Paris Conservatoire, such as Victor Maurel, or medical professionals employed by other Parisian institutions, such as Pierre Bonnier, consulting laryngologist for the Comédie-Française and the Opéra-Comique around the turn of the century.Footnote 5 How did such pedagogues and physicians situate their methods in relation to those of others? What role did institutions play in the circulation and reception of their theories among the wider musical and medical fields? Who trained with or sought treatment from these figures? The answers to these and other such questions would emerge from the primary sources, I expected, if only I could find a way of comprehending – at a global as well as a granular level – the connections between them.
In the days before the digital humanities, I might simply have settled in for the hours of reading that lay ahead, perhaps refining my research questions along the way – if for no other reason than to limit the potentially infinite bibliography. And that is surely what I would have done, had not a colleague introduced me to digital network visualization and analysis. I was persuaded to try this new technique on the basis of its supposed ability to render data according to complex algorithms, thereby revealing previously unknown – and, crucially, otherwise unknowable – aspects of the relationships I had charted.Footnote 6 I began experimenting with Gephi, then apparently one of the most robust open-source network visualization and analysis platforms available – and one of the most user-friendly, given the array of tutorials, several of which are authored by humanists, accessible online.Footnote 7 I dutifully entered the names of physicians, professors, private teachers, and performers (as well as that of a single institution, the Paris Conservatoire) into one Microsoft Excel spreadsheet, then recorded the relationships between them – and described their nature, which I defined according to activity, e.g. ‘taught’, ‘collaborated with’, ‘cited’, and so on – in another. When I finally imported my spreadsheets into Gephi, however, I discovered that applying algorithm-driven layouts (such as ‘ForceAtlas 2’, a force-directed layout in which ‘nodes repulse each other like charged particles, while edges attract their nodes, like springs’) did not unearth anything unexpected – or, indeed, much of anything at all.Footnote 8 The digitizing process made me feel as if I had mastered my data, as did the crisp lines of the digital visualization, but my network diagram remained stubbornly chaotic, reflecting not only the limits of my knowledge but also those of the software.
At this point, I could easily have admitted that digital network visualization and analysis had not proved productive for my purposes, but instead I decided to offer the software a more substantial – and also, I thought, less subjective – dataset, culled from the pages of the Paris Conservatoire's tableaux annuels des classes (annual class lists/tables).Footnote 9 Meticulously maintained by hand, the tableaux record the surnames of the students who enrolled in (or withdrew from) each professor's studio over the course of a given academic year, as well as other details deemed pertinent by the record-keeper – and thus reported only inconsistently – such as students’ awards, physical ailments, and regional or national identities. With the help of a research assistant, I copied the chant, grand opéra and opéra-comique records (that is, for ‘singing’, ‘all-sung opera’, and ‘opera with spoken dialogue’) from 1870 until 1914 into a series of spreadsheets, from which I then extracted the data needed to create the network diagram: the names of professors and pupils, which became my nodes, as well as the topic taught by each professor (chant, grand opéra or opéra-comique), which differentiated the directed edges I drew from pedagogues to their protégés.Footnote 10 When I imported this dataset into Gephi, however, I was disappointed to find that the software's algorithms brought nothing of significance to the surface: the nodes and edges did not suddenly snap into meaningful configurations, as some part of me had hoped that they would do.
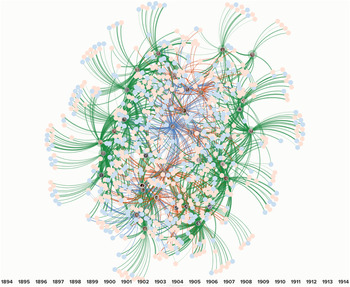
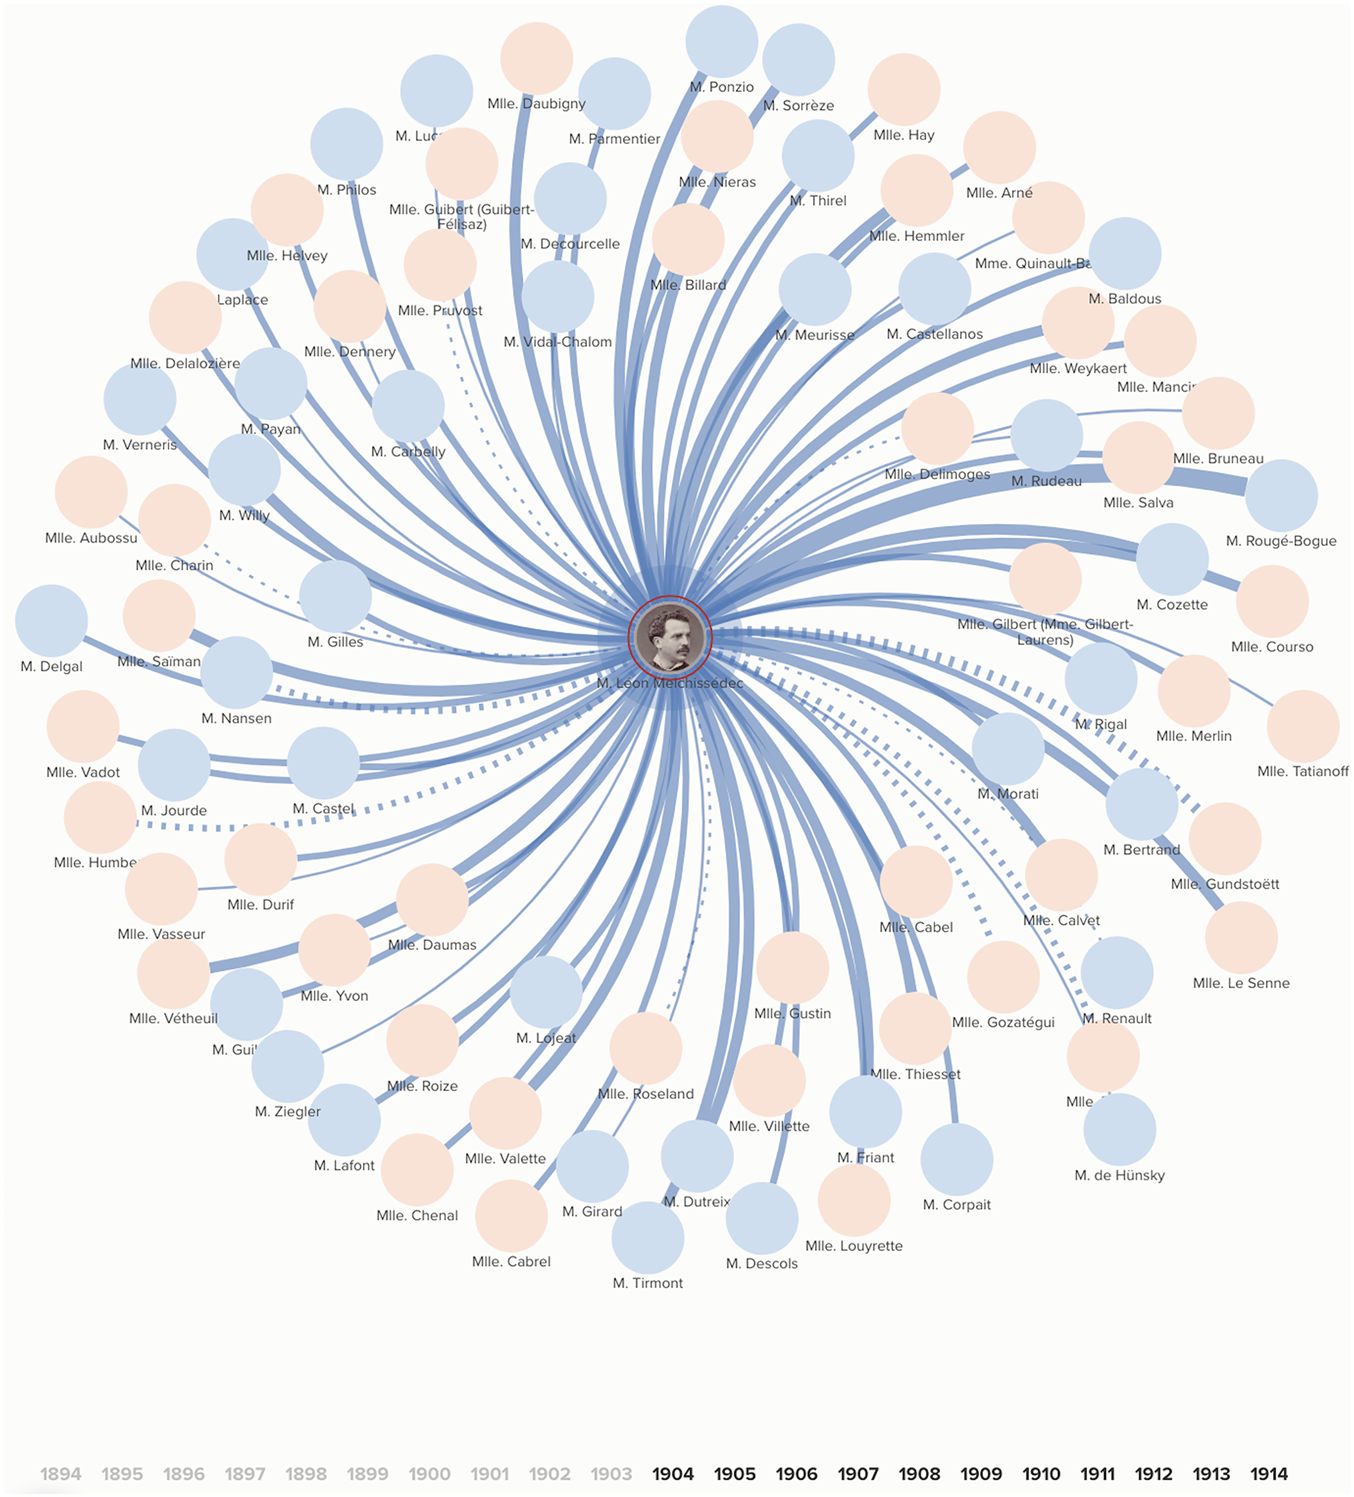
Once again, I reasoned that the problem had more to do with my data – or, perhaps, my software – than with network visualization and analysis as a methodology. I mined the tableaux for additional attributes that Gephi could parse, such as the gender of each student (identified as ‘Monsieur’, ‘Mademoiselle’, or ‘Madame’ in the Conservatoire's records) and the approximate starting and ending date of each relationship, and when I eventually encountered Gephi's limits – or, rather, the limits of my patience with Gephi, which made manual (as opposed to algorithm-driven) manipulation of the data into a laborious process – I switched to a web-based relationship mapping platform, Kumu, which promised to visualize and analyse attributes in a more flexible fashion.Footnote 11 After importing my spreadsheets and applying Kumu's force-based layout to the data, I began to experiment with the platform's categorization and customization tools. I tagged students based on their gender, which I decided to represent with coloured nodes (pale pink for female students and pale blue for male – perhaps in itself a measure of how the effort required by digital data manipulation impoverishes everything else). I tagged professors according to the type of class each of them taught, then ‘decorated’ – to use Kumu's terminology – each node with a corresponding ‘bullseye’, the colour of which radiated through the directed edges extending from professors to their pupils (green for chant, blue for grand opéra, orange for opéra-comique). Using the approximate starting and ending dates of each relationship, as well as other information scrawled in the margins of the tableaux (such as students’ resignations, transfers and dismissals), I further customized the appearance of the edges, using the relative width of each line to reflect the length of time a professor spent working with a student and the style of the line (solid or broken) to suggest something of the nature of their working relationship, with solid lines implying seemingly stable connections, broken lines tenuous, even volatile relationships. Finally, I created an interactive timeline (also based on the starting and ending dates of working relationships), which allowed me to explore how relationships between the Conservatoire's professors and students evolved from year to year. As may well be apparent, I was enchanted with Kumu's aestheticization of my data (notwithstanding the pink and blue), and expectant of its analytical abilities, perhaps more so than my earlier experiences with network analysis should have warranted (see Fig. 1).
Network visualisation of professors and students of chant, grand opéra and opéra-comique active at the Paris Conservatoire between 1894 and 1914, created using Kumu's ‘relationship mapping’ platform. In this figure and all subsequent figures, the colours of the ‘bullseyes’ and corresponding lines – visible in the online version of this essay – indicate the topics taught by professors, with green for chant, blue for grand opéra, and orange for opéra-comique. The relative width of each line reflects the length of time a professor and student worked together, and the style of the line hints at the nature of their working relationship, with solid lines suggesting stable connections, broken lines unstable relationships (as indicated by resignations, moves, and dismissals requested by students).

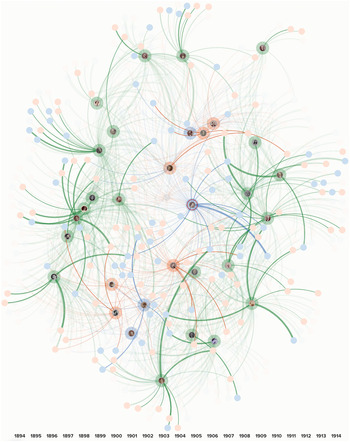
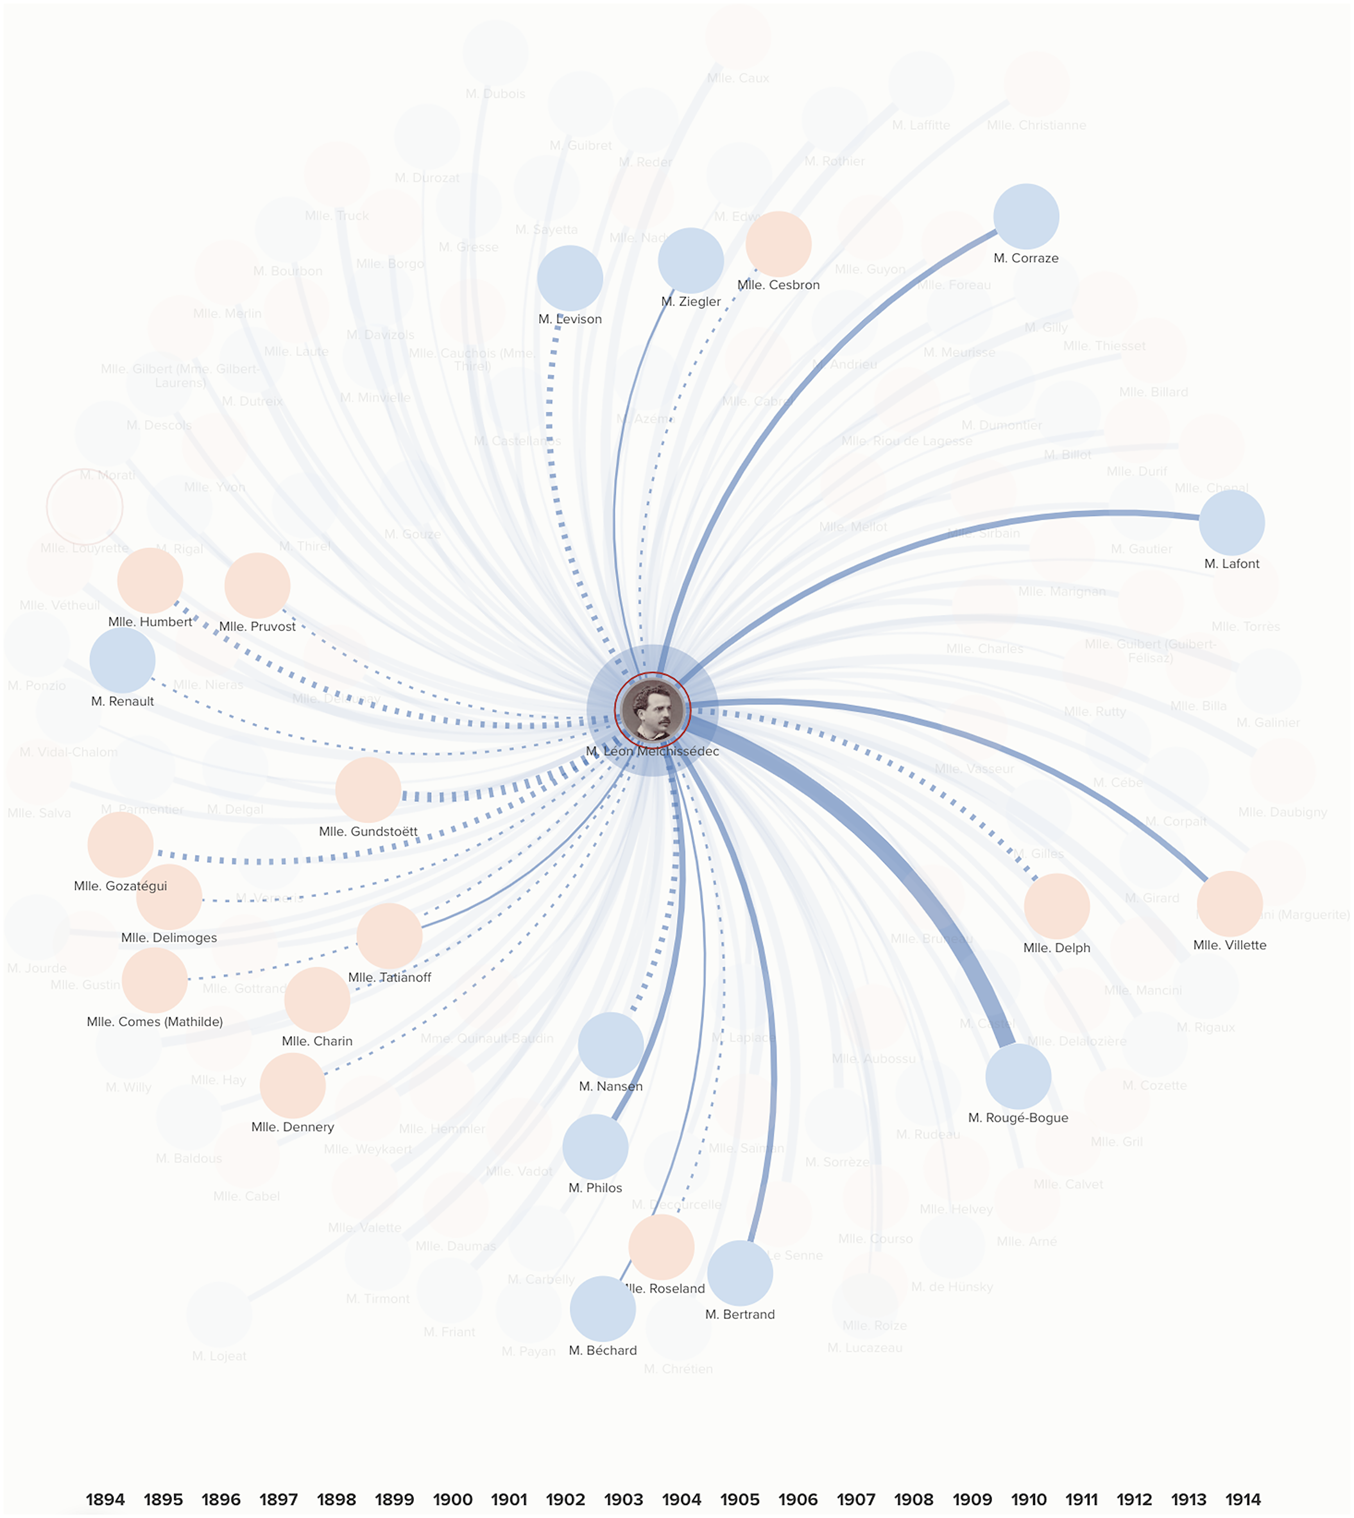
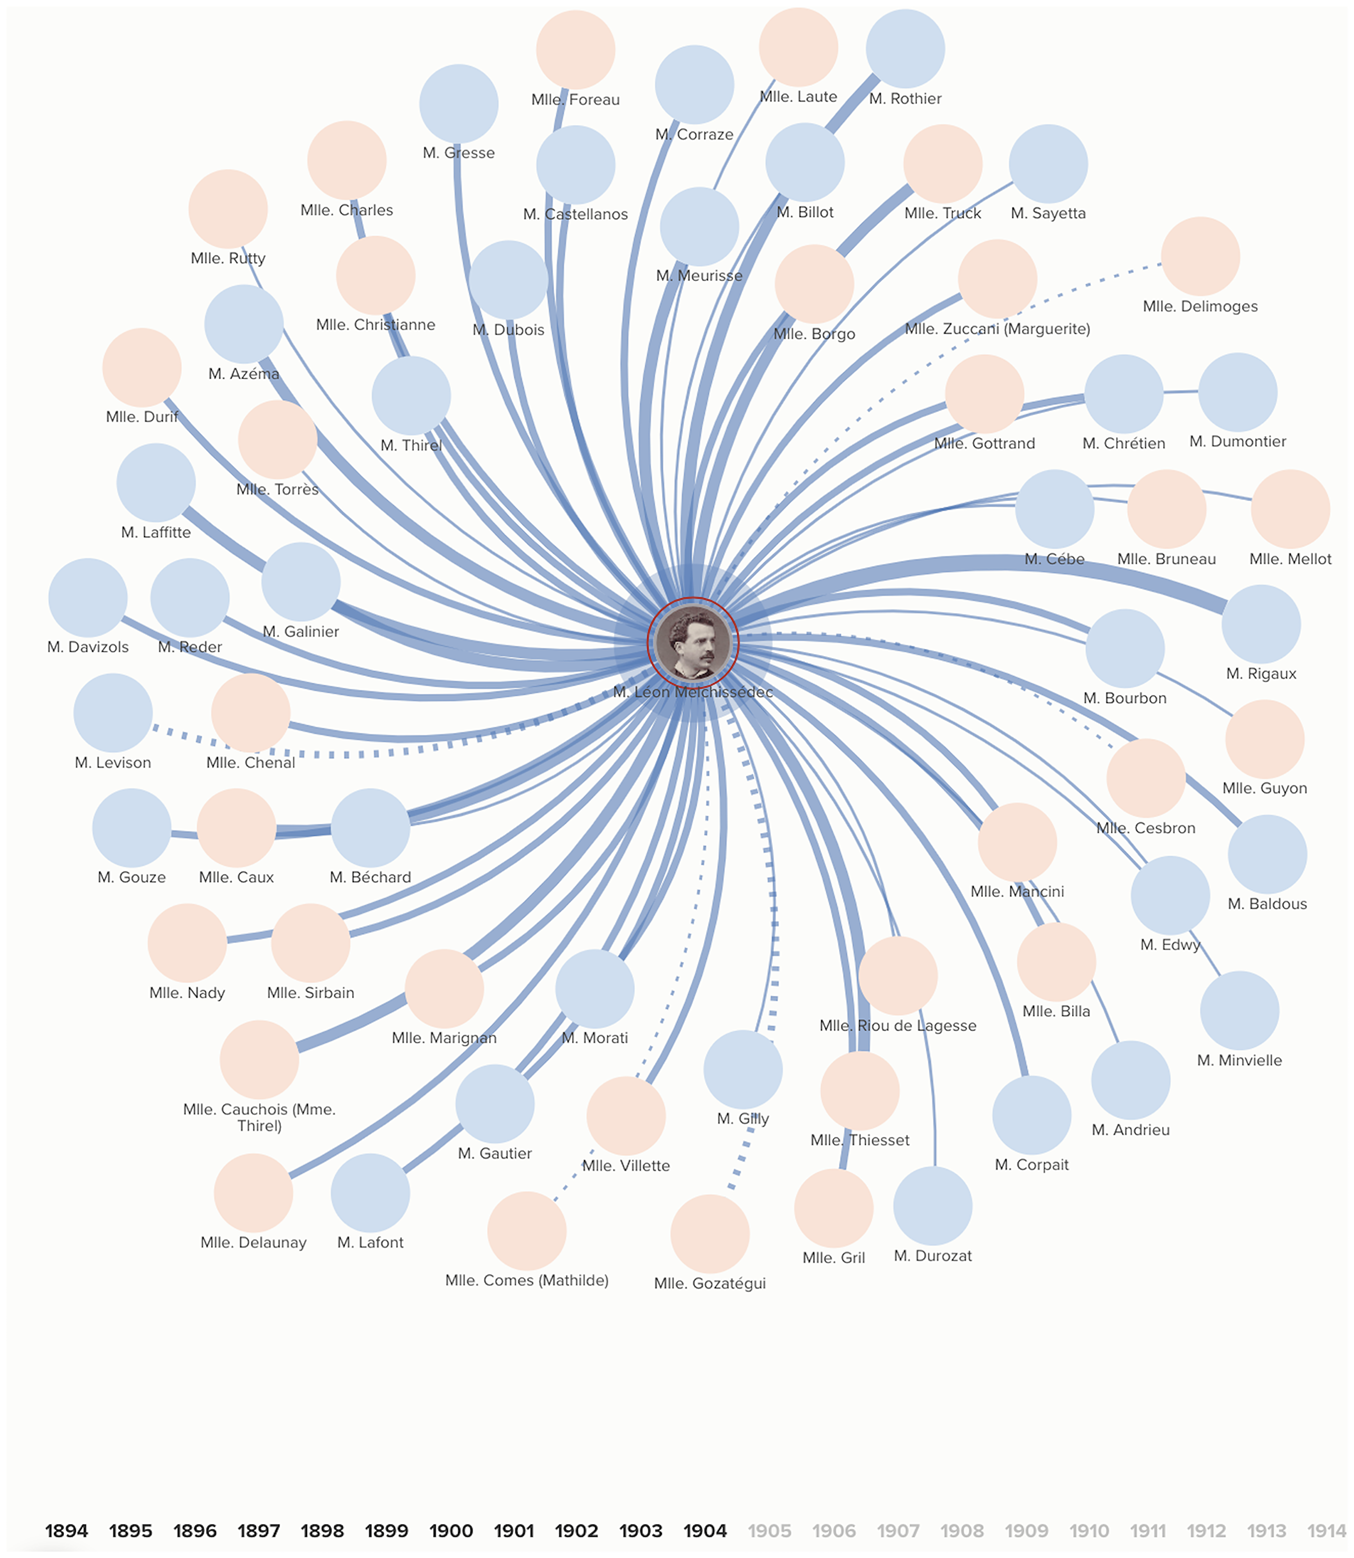
By way of a case study, I decided to focus my attention on Melchissédec, whose harsh critiques of the Conservatoire's singing curriculum – not to mention his brusque manner – polarized professors and pupils over the first two decades of his teaching career (1894–1914), as I had discovered while pursuing archival research for a monograph, which examines how emerging sound technologies such as the théâtrophone (a subscription telephone service connected to various theatres), phonograph and synchronized-sound film shaped operatic culture in Paris and the provinces around the turn of the nineteenth century.Footnote 12 Exploring Melchissédec's relationships with his students by means of Kumu's filters, I (at last!) made two findings: a large number of broken lines overall, with a sharp increase in wide, solid lines over the second decade of Melchissédec's career. As the many broken lines suggest, Melchissédec's students vacated his studio at a high rate: indeed, just over 11 per cent of all resignations, transfers and dismissals (whether at the administration's request or that of the student) recorded between 1894 and 1914 were from Melchissédec's studio (see Figs. 2a and 2b).Footnote 13 Of the 23 students who left him, only nine did so involuntarily; the remaining 14 elected to resign from Melchissédec's studio, transfer to another studio, or petition to be dismissed or excused from the class, which effectively allowed students to start their studies of déclamation lyrique (lyric declamation) anew, without having the time spent in Melchissédec's studio counted as one of their semesters of study. The number of students in the latter category is especially striking: between 1894 and 1914, the administration approved only five petitions to be dismissed, three of which were made by Melchissédec's students – M. Levison (in 1903), Mlle. Roseland (in 1909) and Mlle. Pruvost (in 1912) – and only one to be dispensée (excused), an exceptional request that came in 1908 from Mlle. Dennery, another of Melchissédec's students. Less striking but still salient, however, is the steady rise in the number of returning students Melchissédec saw over his second decade at the Conservatoire (see Figs. 3a and 3b). Although the majority of Melchissédec's students spent three or fewer semesters in his studio, between 1904 and 1914 an increasing number returned for a fourth or even a fifth semester.
Resignations, moves, and dismissals from all studios active between 1894 and 1914.

Resignations, moves, and dismissals from Melchissédec's studio between 1894 and 1914.

Enrolment in Melchissédec's studio 1894–1904.

Enrolment in Melchissédec's studio 1904–1914.

Such findings shed new light on Melchissédec's standing at the Conservatoire over the first two decades of his career, offering a fresh context for the letters, reports, and press clippings preserved in his personnel file.Footnote 14 Or that, at least, was what I argued in earlier versions of this essay. Indeed, the piece that I initially proposed to write for this special issue of Nineteenth-Century Music Review – and went so far as to submit – argued on the basis of the outcomes outlined above that network visualization and analysis could usefully complement more conventional investigative methods in historical musicology.
But did I unearth anything I would not have stumbled upon in the sources? Or, indeed, anything worth knowing full stop? To be sure, the findings I made by way of network visualization and analysis supported what the archival sources suggested, adding a layer of quantitative certitude to a narrative I might otherwise have had to couch with caveats. But after reflecting on my project for the better part of a year, I can finally admit that the answers Kumu afforded were to queries I designed (and carefully circumscribed) with the platform's capabilities in mind, rather than those with which I actually wanted to wrestle – and also, perhaps more importantly, that I set aside these more substantial questions because I believed, at least to some extent, that network visualization and analysis would show me something I had not yet seen, perhaps would never see without technological assistance. Such techno-positivism runs rife in the digital humanities, but of course this ideology is not an invention of the twenty-first century, as I was well aware. Indeed, many of the late nineteenth- and early twentieth-century physicians and pedagogues I have found myself studying over the past few years held similar views, which I have approached with a scholarly air of detachment, not to say scepticism. Why, then, did I have such difficulty doing the same when it came to my own engagement with technology?
The answers to this question are many, of course, but the most compelling have to do with how this project – and the digital humanities more broadly – paved the way for what I relatively recently began to think of as my career in academia. The roll-call of funders with which I began tells a very public story of no-doubt well-intentioned falling into line that some will call a principled striving to maximize the dissemination among the general population of knowledge created with the help of government and philanthropic money, and others uncritical jumping on the bandwagon. But what about the private story? I was a fourth-year PhD student when I began dabbling in the digital humanities, the strategic significance of which I came to realize as I searched for employment – to be clear, a tenure-track university position – over the next couple of years.Footnote 15 In conversations with potential colleagues and administrators, I found myself discussing the digital technologies I used in my research and teaching in a decidedly enthusiastic fashion, responding to what I perceived as techno-positivism on the part of those interviewing me. After it all came right and I started that tenure-track position at a research-intensive – or R1, to use the Carnegie Classifications of Institutions of Higher Education's terminology – institution, I continued to advocate for the digital humanities: I spoke frequently, both formally and informally, about my experiences with digital network visualization and analysis; I worked with my students to curate online exhibitions of cultural heritage objects, such as théâtrophonics, which explores how Parisians used personal and public telephones to listen in real time to musical and theatrical performances taking place across the city from the early 1880s through the mid-1930s; I collaborated with colleagues in my college (what in the United Kingdom might be called a faculty) to develop an Integrated Learning Major in the Digital Humanities; I co-organized regional symposia and working groups to facilitate conversations between students and faculty about the digital humanities, for which I raised funding from departments and centres across campus as well as the Central New York Humanities Corridor.Footnote 16 I was not only an initiate, in other words, but an energetic evangelist. The various iterations of my ‘Visualizing the French Voice’ project eased my entrée into an intellectual community and helped me forge an identity within it; perhaps it is no wonder, then, that I found it difficult to admit that digital network visualization and analysis had foreclosed – rather than facilitated – intellectual inquiry. I also expected that this project would help me to maintain my newfound position within this community, if only I could demonstrate its impact within my discipline (and, I hoped, well beyond it): surely the pressure to do so – I was nearing the mid-point of my tenure-track timeline when I penned the initial version of this piece – made me less able to see that this project had not, alas, fully achieved its intended impact.
As I have written this short piece, I have wondered often whether my project has indeed failed, or whether it is instead – still – incomplete. What, if any, new configurations would take shape on the screen, for example, if I integrated the details inconsistently recorded in the tableaux (such as the students’ regional and national identities) into the digital visualization? What would become of my neat patterns of pedagogical transmission if I layered professors’ and pupils’ phonograph recordings over their nodes? What would I learn, in other words, if, instead of adapting my data so that it could be analysed by an algorithm, I approached the digital visualization as itself having the status of an archive: information in need of scholarly – rather than technological – intervention? Such questions have led me to start thinking of my digital network visualization as something akin to that first network diagram I began to sketch now more than six years ago: a determinedly chaotic web of nodes and edges, the haphazardness of which not only reflects that of the scholarly process, but also respects that of the historical record.
As I leave off commenting and go back to my material – now all on my own hard drive rather than inconveniently away in Paris – I can't help but be struck by how many aspects of my digital humanities experience are self-referential. The same techno-positivism in the object of study as in the subject doing the studying, the aestheticization of the visualization matching the neatness of the conclusions it facilitated, the university courses created to give a raison d’être to the material: all this often seems circular to me now. Perhaps this is the inevitable result of adopting an autoethnographic attitude. I wonder, though, whether the real impact of this kind of project will turn out to be less on those people ‘out there’ who might otherwise not have any purchase on large-scale, multi-source academic work – though who could deny the importance of visualizing interrelationships between professors and pupils active at the Paris Conservatoire around the turn of the nineteenth century? – and rather more on the people ‘in here’ who do that work, whoever our imagined readership happens to be.