Introduction
In 1980, a new mineral with the idealized formula K6Al4BSi6O20(OH)4Cl was discovered in the Khibiny massif, Kola Peninsula, Russia. The mineral was named kalborsite based on its composition (Khomyakov et al., Reference Khomyakov, Sandomirskaya and Malinovskii1980). The crystal structure of kalborsite is characterized by the EDI type zeolite tetrahedral framework, which is topologically equal to those in the crystal structure of edingtonite, Ba2[Al4Si6O20]·4H2O (Taylor and Jackson, Reference Taylor and Jackson1933; Galli, Reference Galli1976; Gatta et al., Reference Gatta, Ballaran Boffa, Comodi and Zanazzi2004). Instead of water molecules, the large cavities of the kalborsite framework contain additional Cl– and [B(OH)4]–-tetrahedra (Malinovskii and Belov, Reference Malinovskii and N.V1980), which compensate for the excess positive charge that occurs when 2Ba2+ in edingtonite is replaced by 6K+ in kalborsite. These additional anions alternate along the c axis, which result in doubling of the parameter c in kalborsite (c ≈ 13 Å) compared to edingtonite (c ≈ 6.5 Å). Due to topological similarity to edingtonite, kalborsite was proposed to be classified as a zeolite, despite the absence of water molecules in its structure (Pekov and Chukanov, Reference Pekov and N.V1996). It was included in the list of zeolites as a derivative of the edingtonite structure (Coombs et al., Reference Coombs, Alberti, Armbruster, Artioli, Colella, Galli, Grice, Liebau, Mandarino, Minato, Nickel, Passaglia, Peacor, Quartieri, Rinaldi, Ross, Sheppard, Tillmanns and Vezzalini1998; Baerlocher et al., Reference Baerlocher, McCusker and Olson2007).
In the sodalite syenite of the Lovozero alkaline massif (Kola Peninsula, Russia), we discovered a ‘kalborsite-like’ mineral, which differs from kalborsite in the substitution of the negatively charged [B(OH)4]–-tetrahedra by the neutral [Si(OH)4]0-tetrahedra, which is controlled by the Si:Al ratio of 1:1 within the framework. This new mineral species with the idealized formula K6Al5Si6O20(OH)4Cl was named arzamastsevite in honour of Dr. Andrey A. Arzamastsev (Russian Cyrillic: Cyrillic: Андрей Александрович Арзамасцев) (b. 1950), a leading researcher from the Institute of Precambrian Geology and Geochronology of the Russian Academy of Sciences (Saint-Petersburg, Russian Federation). He has made remarkable contributions to the petrology of the alkaline massifs of the Kola alkaline province and alkaline volcanic rocks of the East African Rift.
In this work we present the structural, chemical and physical characteristics of arzamastsevite (IMA symbol Azm) and discuss its probable genesis. The holotype material is deposited in the collection of the Geological and Mineralogical Museum of the Geological Institute of the Kola Science Centre of the Russian Academy of Sciences, Apatity, Russia, catalogue number GIM 7986. This new mineral and its name were approved by the Commission on New Minerals, Nomenclature and Classification of the International Mineralogical Association (IMA2024-085, Mikhailova et al., Reference Mikhailova, Pakhomovsky, Selivanova, Zolotarev, Aksenov and V.N2025).
Occurrence
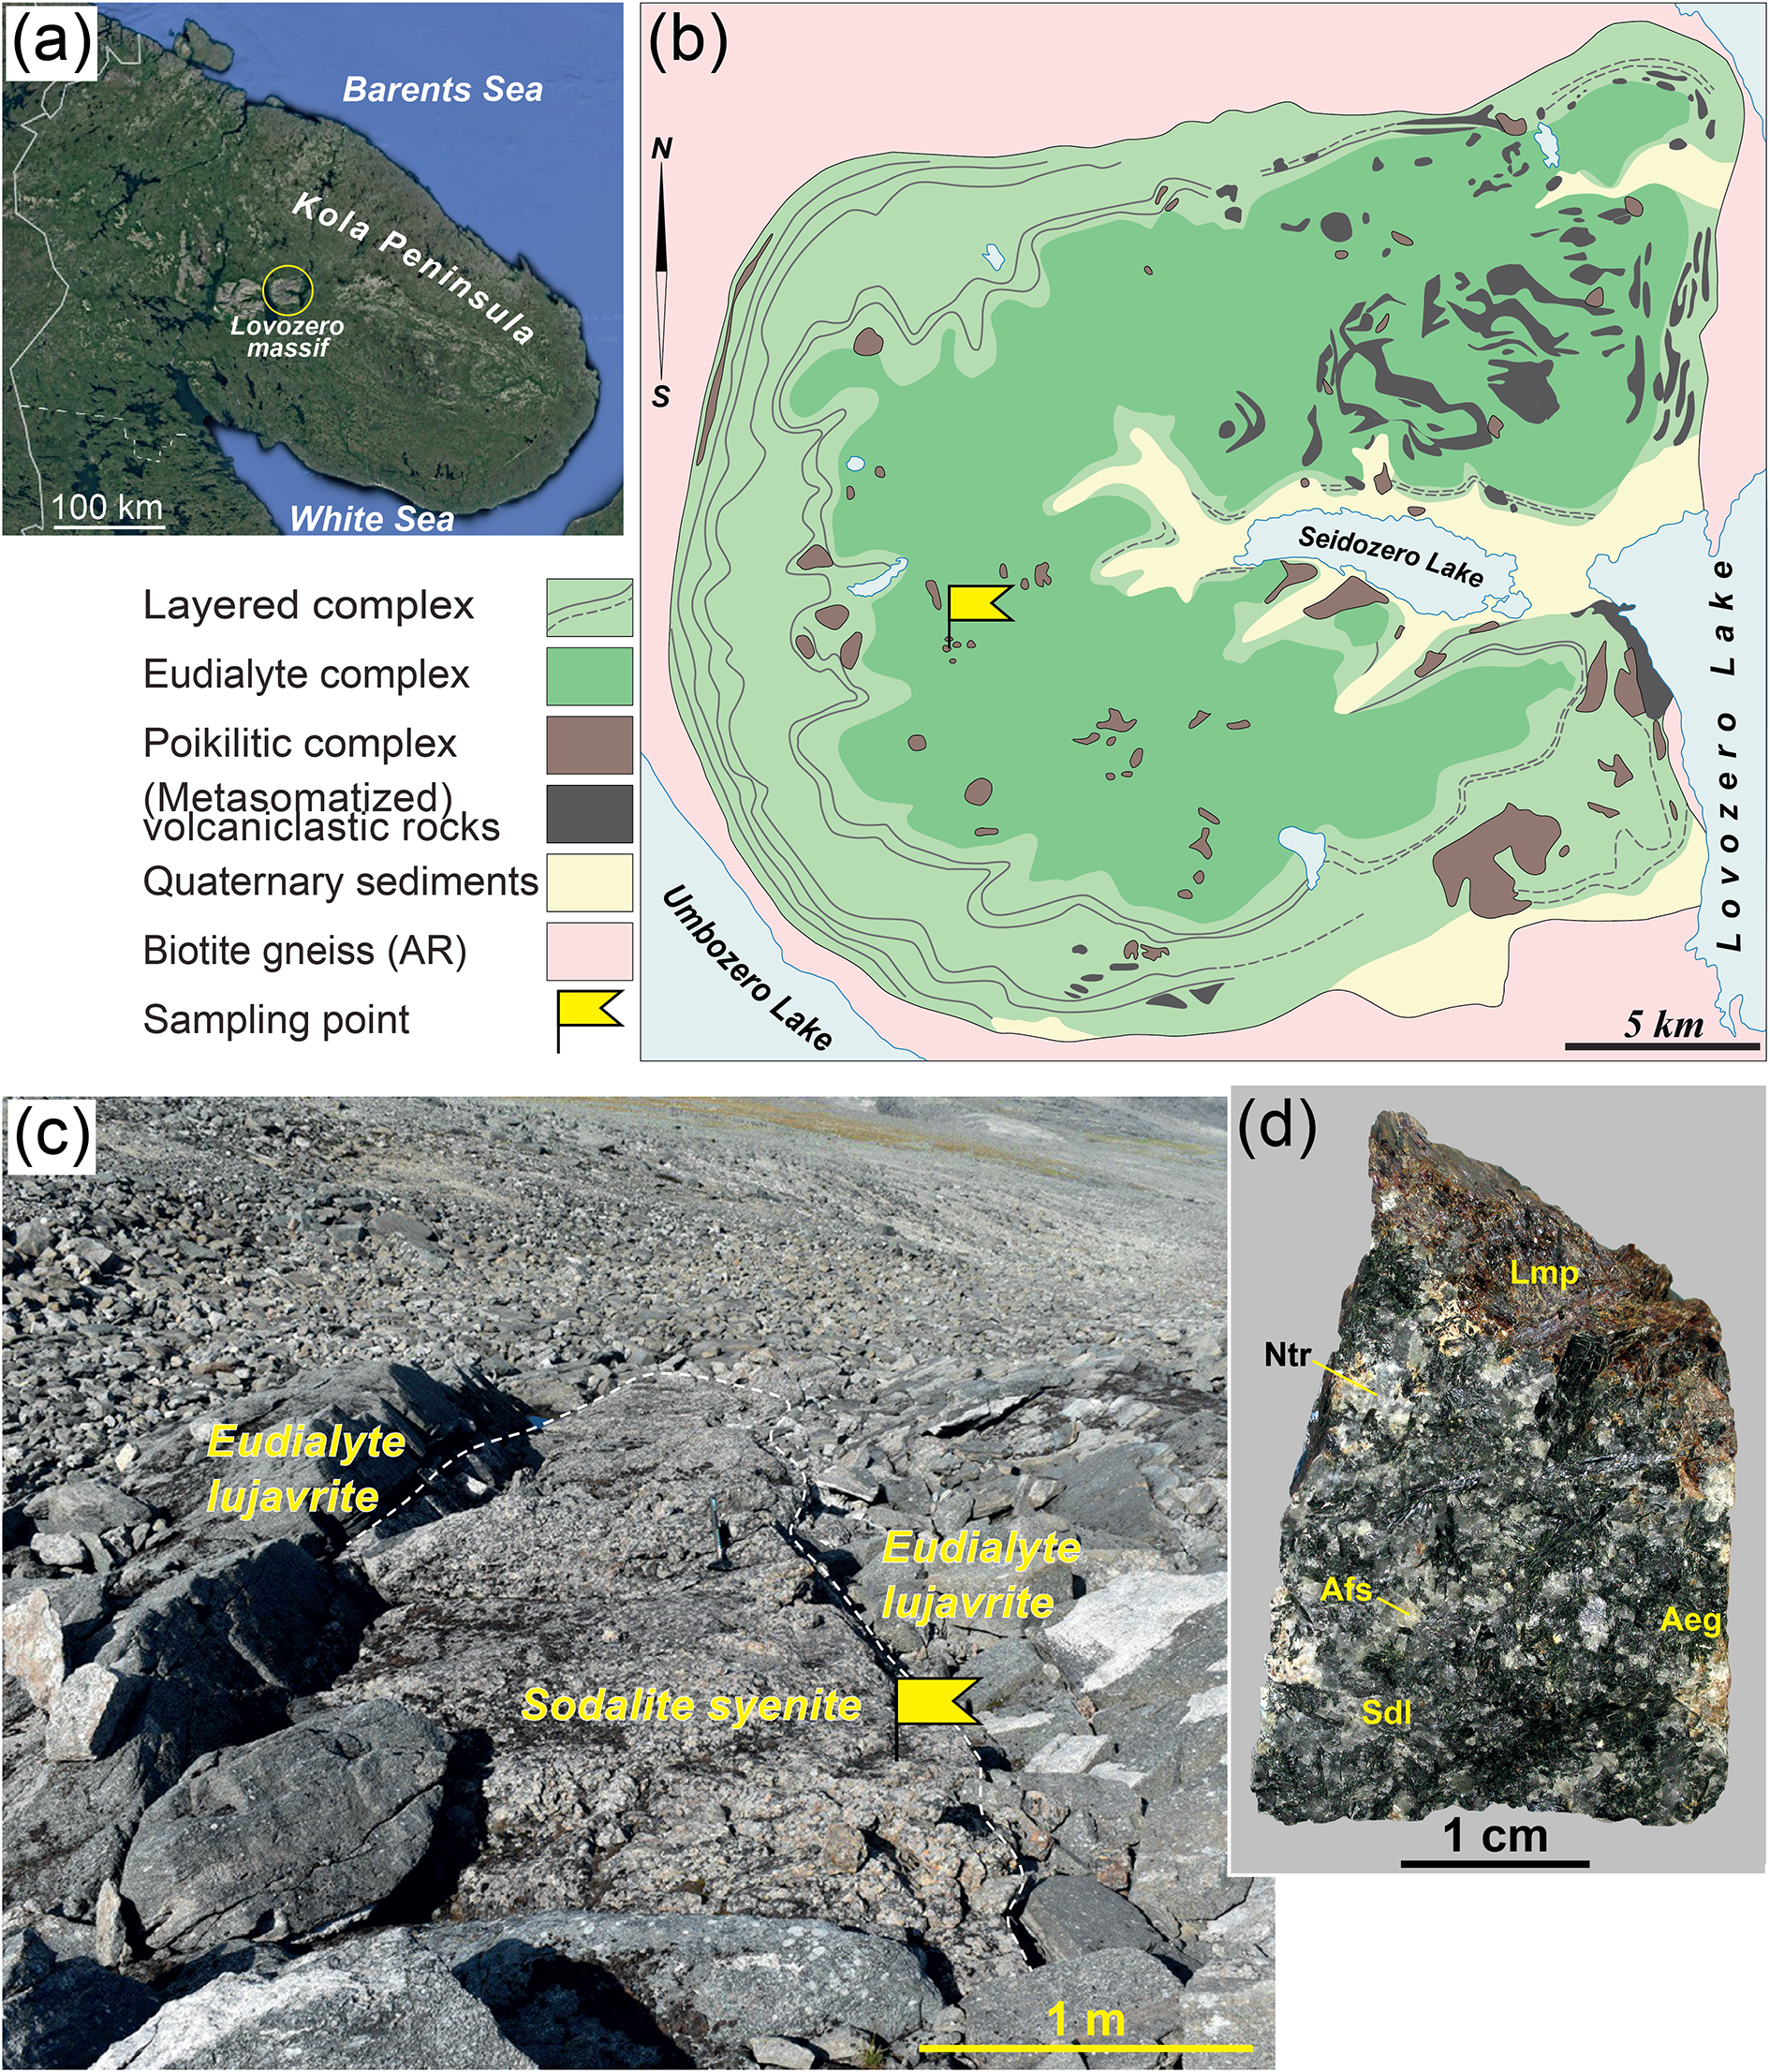
The Lovozero massif is located in the centre of the Kola Peninsula, Russia, and covers an area of 650 km2 (Fig. 1). This layered laccolith-type pluton was emplaced at 360–370 Ma (Kramm and Kogarko, Reference Kramm and L.N1994; Mitchell et al., Reference Mitchell, Wu and Y.-H2011; Wu et al., Reference Wu, Yang, Marks, Liu, Zhou, Ge, Yang, Zhao, Mitchell and Markl2010) into Archean granite gneiss covered by Devonian volcaniclastic rocks (Korchak et al., Reference Korchak, Men’shikov, Pakhomovskii, Yakovenchuk and G.Y2011). The pluton consists of three main complexes (Gerasimovsky et al., Reference Gerasimovsky, Volkov, Kogarko, Polyakov, Saprykina and Yu.A1966; Bussen and Sakharov, Reference Bussen and A.S1972): layered, eudialyte and poikilitic.
(a) The photograph of Kola peninsula from satellite data (the location of the Lovozero alkaline massif is shown by a yellow circle); (b) geological scheme of the Lovozero alkaline massif (after Bussen and Sakharov, Reference Bussen and A.S1972, with simplifications); (c) outcrop of natrolitized sodalite syenite among eudialyte lujavrite at Parguaiv Mt (67°47′22.4″N, 34°35′10″E); (d) sample of natrolitized sodalite syenite with arzamastsevite. Afs – alkali feldspar, Aeg – aegirine, Lmp – lamprophyllite, Ntr – natrolite, Sdl – sodalite.

Figure 1 Long description
A) Satellite image of the Kola Peninsula with Lovozero location marked by a yellow circle. B) Geological map of Lovozero massif showing layered, eudialyte and poikilitic complexes, with sampling points marked. C) Outcrop of sodalite syenite among eudialyte lujavrite at Parguaiv Mt, labeled with rock types. D) Sample of natrolitized sodalite syenite with minerals labeled: alkali feldspar, aegirine, lamprophyllite, natrolite, sodalite. Scale bars indicate distances: 100 km, 5 km, 1 m and 1 cm.
The layered complex is more than 1700 metres thick and consists of regularly repeating subhorizontal layers (or rhythms). Each rhythm is a sequence of rocks ranging (from top to bottom): melano- or mesocratic trachytoid nepheline syenite (co-called lujavrite) – weakly trachytoid to massive leucocratic nepheline syenite (foyaite) – massive foidolite (urtite). The layered complex is overlapped by the eudialyte complex, which consists mainly of lujavrite enriched in eudialyte-group minerals (eudialyte lujavrite). Within the eudialyte lujavrite, there are layers or lenses of foyaite, less commonly urtite. Poikilitic complex, or complex of poikilitic syenites, is a collective name for a group of rocks diverse in mineral and modal composition (Semenov, Reference Semenov1972; Bussen and Sakharov, Reference Bussen and A.S1972). The main distinguished feature of the rocks of this complex is the presence of poikilitic crystals of potassium feldspar with the inclusions of different feldspathoids (nepheline, sodalite, vishnevite). The rocks of the poikilitic complex occupy ∼5% of the massif volume; they form lenses, sheet-like or irregularly shaped bodies with sizes of 10 km × 0.5 km to 50 cm × 30 cm, which are located in both the layered and eudialyte complexes. Arzamastsevite was discovered in a sample of natrolitized sodalite syenite of the poikilitic complex collected from an outcrop at Parguaiv Mt (67°47′22.4″ N, 34°35′10″ E).
Appearance and physical properties
Arzamastsevite was found in a rock consisting of subhedral to anhedral grains of alkali feldspar (up to 0.8 cm across), anhedral sodalite grains (up to 1.2 cm across), long-prismatic crystals of aegirine and short-prismatic crystals and subhedral grains of magnesio-arfvedsonite. The accessory minerals are loparite, rhabdophane-(Ce), lamprophyllite, sphalerite, galena, pyrrhotite and pyrite. The secondary minerals are natrolite and nordstrandite, and the supergene mineral is goethite.
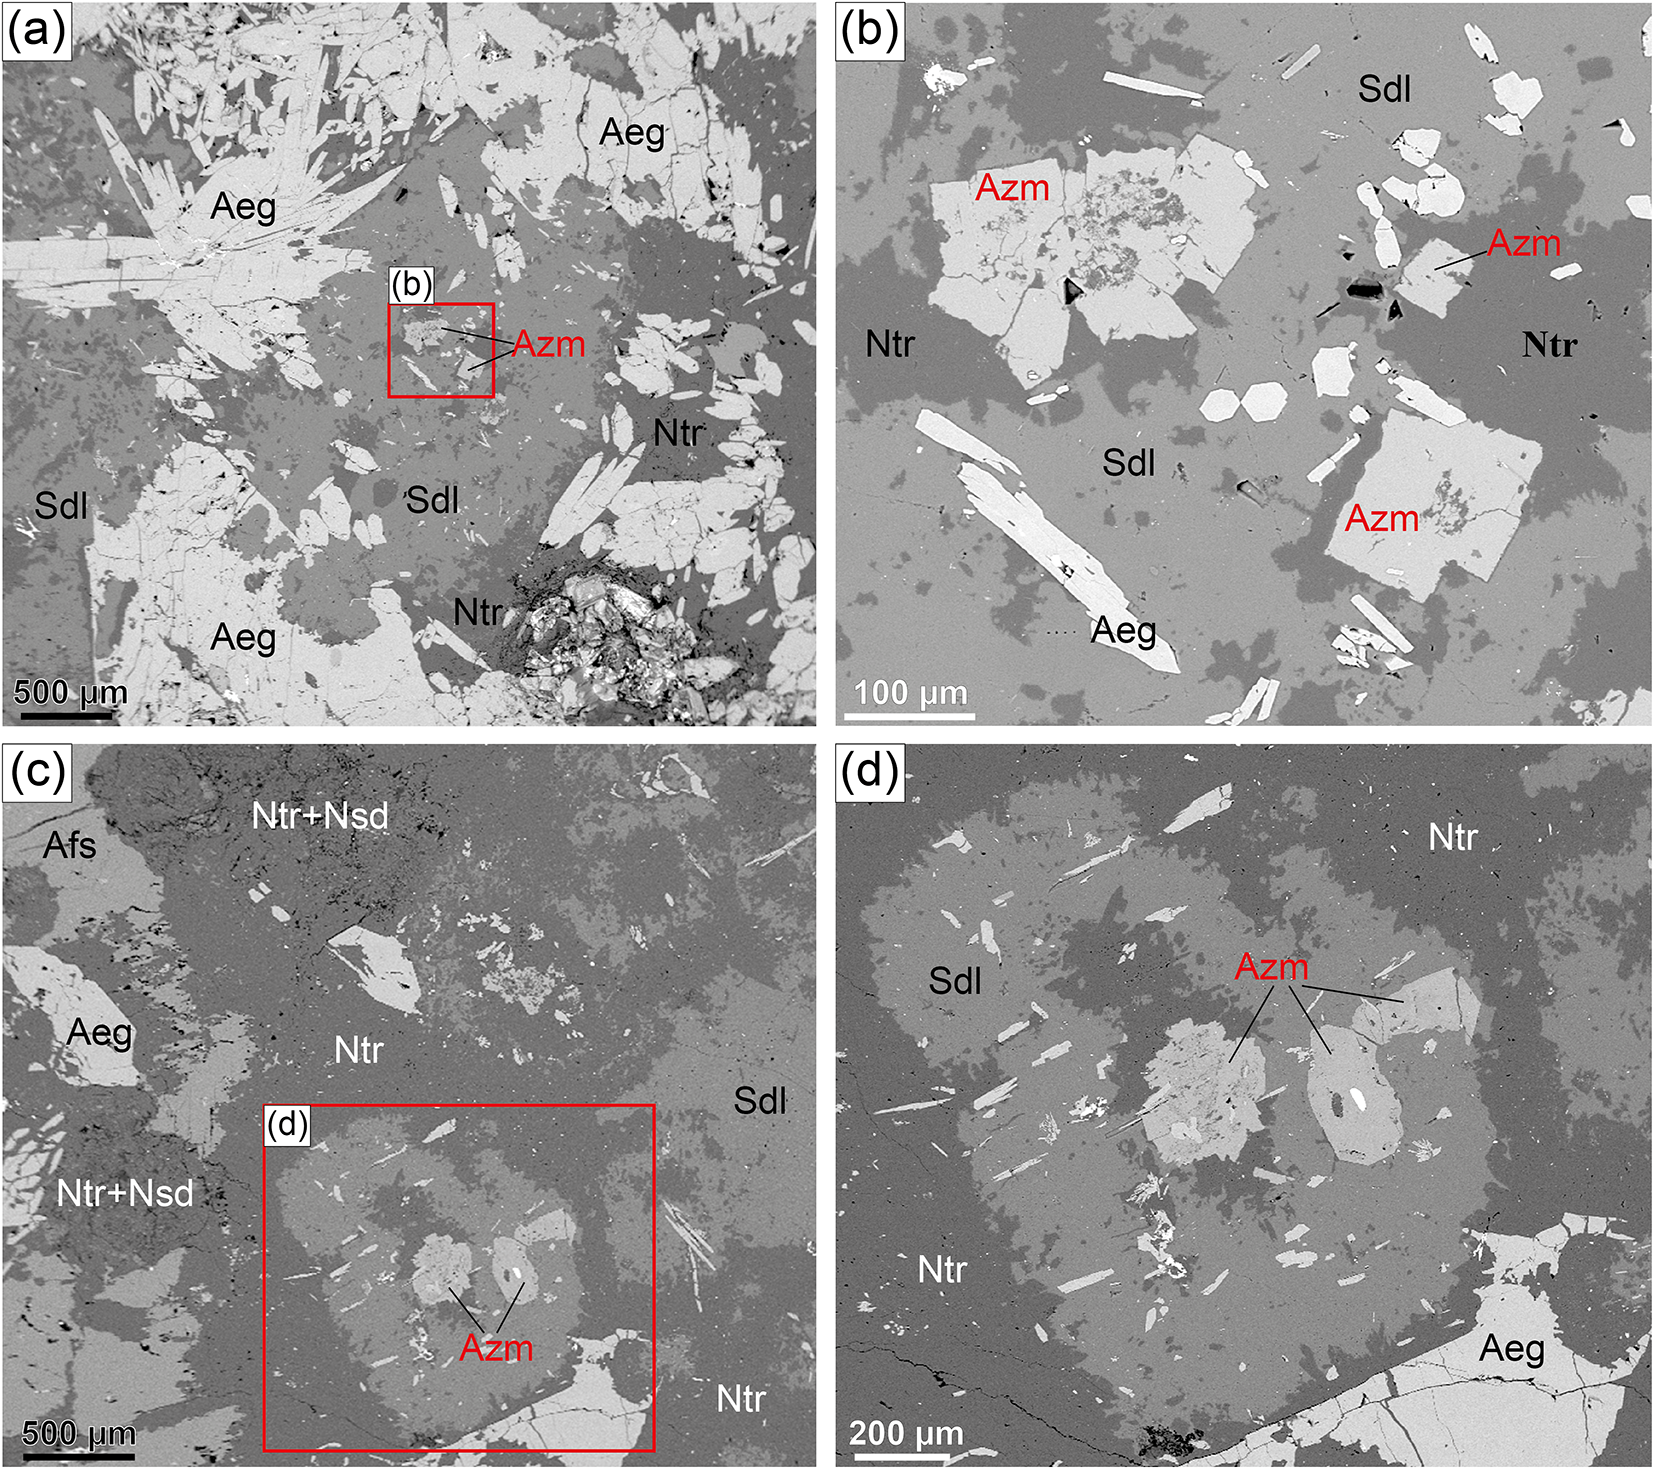
Arzamastsevite occurs as short-prismatic crystals (average 60 µm across; Fig. 2a,b) and anhedral grains (average 50 µm across; Fig. 2c,d) in fine-grained natrolite replacing sodalite. The largest observed arzamastsevite crystal is 180 µm across. Aggregates of 2–5 crystals are typically observed. Arzamastsevite is transparent and colourless. The mineral is non-fluorescent. Arzamastsevite is optically uniaxial (+), with the refractive indices ω = 1.530(2), ε = 1.532(2) (for λ = 589 nm). Pleochroism and dispersion were not observed. The streak is white and lustre is vitreous. The mineral is brittle and has an uneven fracture. Cleavage and parting were not observed. The density determined by the float-sink method in Clerici solution is 2.50(5) g·cm–3, while the density calculated using the empirical formula and single-crystal unit-cell parameters is 2.51 g·cm–3 (calculated density based on structural data is 2.521 g·cm–3). A Gladstone-Dale calculation provides a compatibility index of 0.011 (using the empirical formula and measured density), which is regarded as superior.
Back-scattered electron images of arzamastsevite (Azm) and associated minerals. Aeg – aegirine; Afs – alkali feldspar; Ntr – natrolite; Nsd – nordstrandite; Sdl – sodalite.

Chemical composition
The chemical analyses of arzamastsevite were obtained using a Cameca MS-46 electron microprobe operating in the WDS-mode at 20 kV with a beam of 20–30 μm diameter and a beam current of 20 nA. The elimination of mineral damage and analytical data distortion was achieved by the rastering of the electron beam to an area with the diameter of 20–30 μm and constant moving of the mineral sample under the electron probe for 10 s while simultaneously measuring of the intensity of the corresponding characteristic X-ray radiation of three chemical elements. To study the uniformity of the mineral within individual grains, a scanning electron microscope LEO-1450 equipped with an AZtec-4.4 energy dispersion system and ULTIM MAX 100 detector was used. The following standards were used: wollastonite (Si), pyrope (Al), enstatite (Fe), wadeite (K), lorenzenite (Na) and atacamite (Cl).
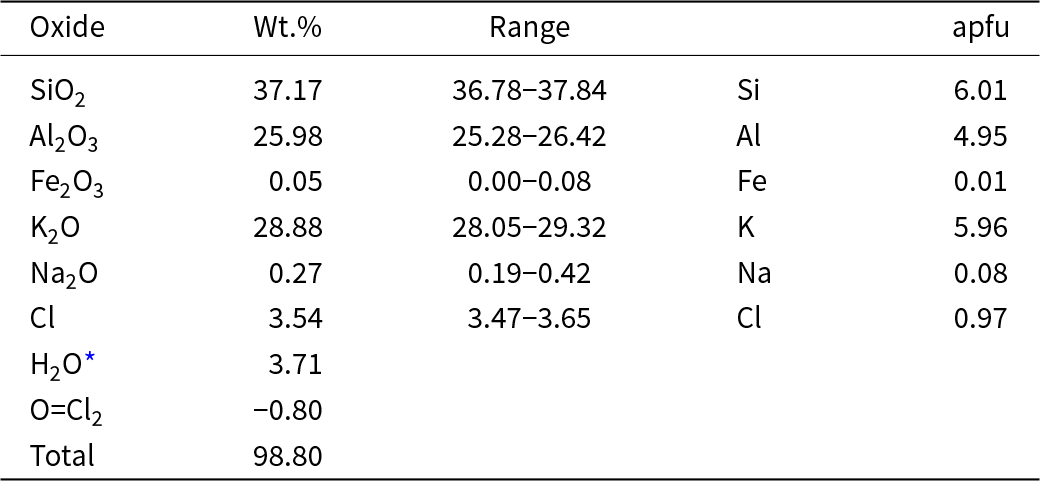
We did not have sufficient material for the direct determination of H2O. The presence of OH groups is confirmed by Raman spectroscopy and structural data based on BVS calculations (see below). The mean analytical results (6 analyses of 6 different arzamastsevite grains, each analysis being the average of 5–6 points) are given in Table 1.
Composition and unit formula for arzamastsevite

Table 1 Long description
Oxide weight percent values are listed with a range column for most oxides, and a separate apfu column for selected elements. Silicon dioxide is 37.17 wt percent with a range from 36.78 to 37.84, and silicon apfu is 6.01. Aluminum oxide is 25.98 wt percent with a range from 25.28 to 26.42, and aluminum apfu is 4.95. Iron(III) oxide is 0.05 wt percent with a range from 0.00 to 0.08, and iron apfu is 0.01. Potassium oxide is 28.88 wt percent with a range from 28.05 to 29.32, and potassium apfu is 5.96. Sodium oxide is 0.27 wt percent with a range from 0.19 to 0.42, and sodium apfu is 0.08. Chlorine is 3.54 wt percent with a range from 3.47 to 3.65, and chlorine apfu is 0.97. Water marked with an asterisk is 3.71 wt percent with no range shown, and the row labeled, O equals Cl2 is minus 0.80 wt percent with no range shown. The total is 98.80 wt percent.
* Calculated from the crystal structure information, i.e. H = 4; apfu – atoms per formula unit.
The empirical formula calculated on the basis of [20O + 4(OH)] = –44 apfu is (K5.96Na0.08)Σ6.04[Al4.95Fe3+0.01Si5.01O20]Cl0.97·[Si(OH)4]. The crystal-chemical (structural) formula is [K4(K1.96Na0.08)]Σ2.04[(Al3.95Si4.01)(AlSi)O20]Cl0.97·[Si(OH)4]. The simplified formula is (K,Na)6[Al5Si5O20]Cl·[Si(OH)4]. The idealized formula is K6[Al5Si5O20]Cl·[Si(OH)4] or K6Al5Si6O20(OH)4Cl which requires (wt. %): K2O 29.39, SiO2 37.49, Al2O3 26.51, Cl 3.69, H2O 3.75, O=Cl2 –0.83, Total 100.
Raman spectroscopy
The Raman spectrum of arzamastsevite (Fig. 3) was obtained using a Horiba Jobin-Yvon LabRam HR 800 spectrometer equipped with Ar-ion laser (λ = 514 nm) and an Olympus BX41 microscope, using a 100× confocal objective and a 600 gr/mm grating. The Raman spectrum was recorded at room temperature in the range from 70 to 4000 cm–1 with resolution of 2 cm–1 and processed using the LabSpec (Horiba Jobin Vyon, 2008) and Origin software (OriginLab Corporation, 2009).
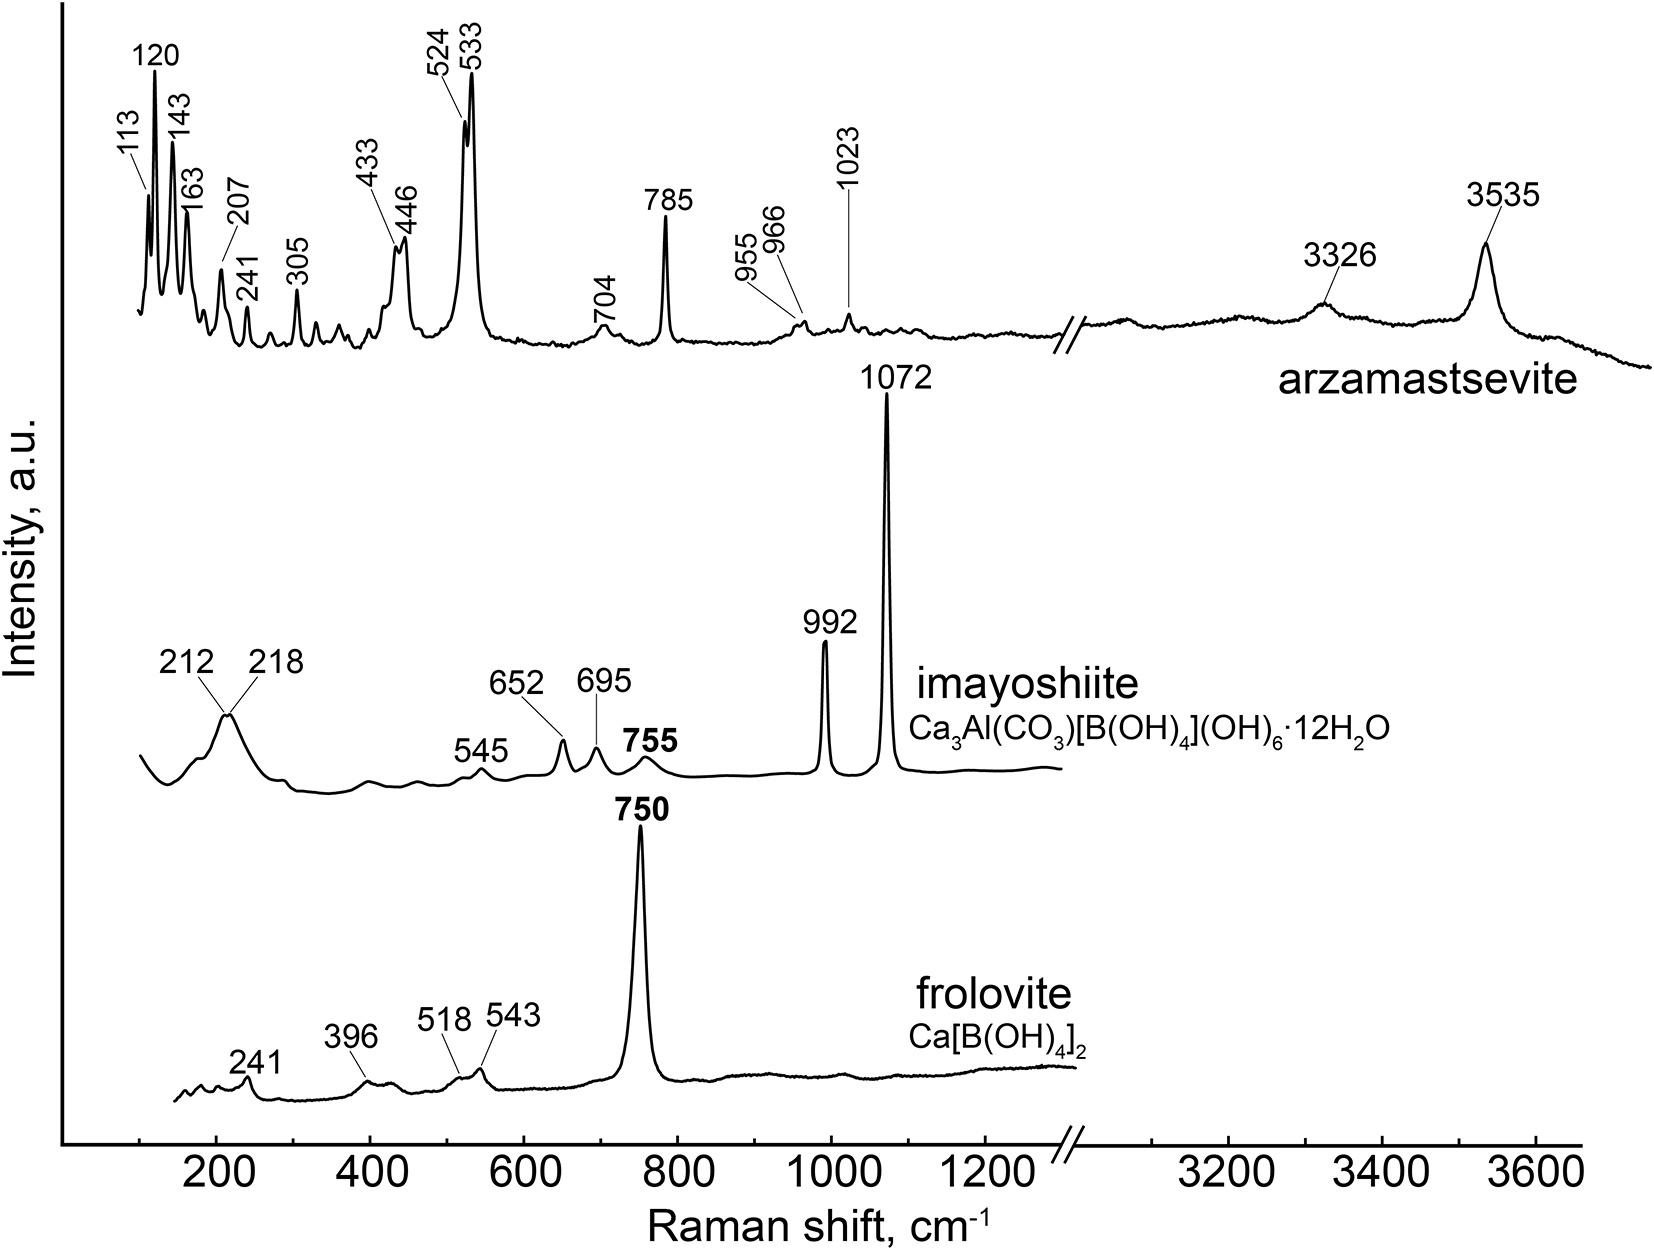
Raman spectra of arzamastsevite, imayoshiite (RRUFF ID: R210019.2 https://rruff.info/imayoshiite/) and frolovite (RRUFF ID: R070469 https://rruff.info/Frolovite). The bands at 750 and 755 cm–1, attributed to the [B(OH)4]– group, are present in frolovite (750 cm–1) and imayoshiite (755 cm–1) spectra, but absent in the spectrum of arzamastsevite.

Figure 3 Long description
Three stacked line graphs labeled arzamastsevite, imayoshiite and frolovite compare Raman spectra using the same axes. The x-axis label is Raman shift, centimeter superscript minus 1, with labeled ticks at 200, 400, 600, 800, 1000, 1200, 3200, 3400 and 3600. The y-axis label is Intensity, a dot u dot. Arzamastsevite spectrum: Many labeled peaks occur between about 100 and 1100 on the Raman shift scale, with additional labeled peaks at higher Raman shift. Imayoshiite spectrum: Labeled peaks occur between about 200 and 1100 on the Raman shift scale. Text next to the label shows the formula, Ca subscript 2 Al CO subscript 3 B OH subscript 3 OH subscript 6 dot 12 H subscript 2 O. Frolovite spectrum: Labeled peaks occur between about 200 and 800 on the Raman shift scale. Text next to the label shows the formula, Ca B OH subscript 4 subscript 2.
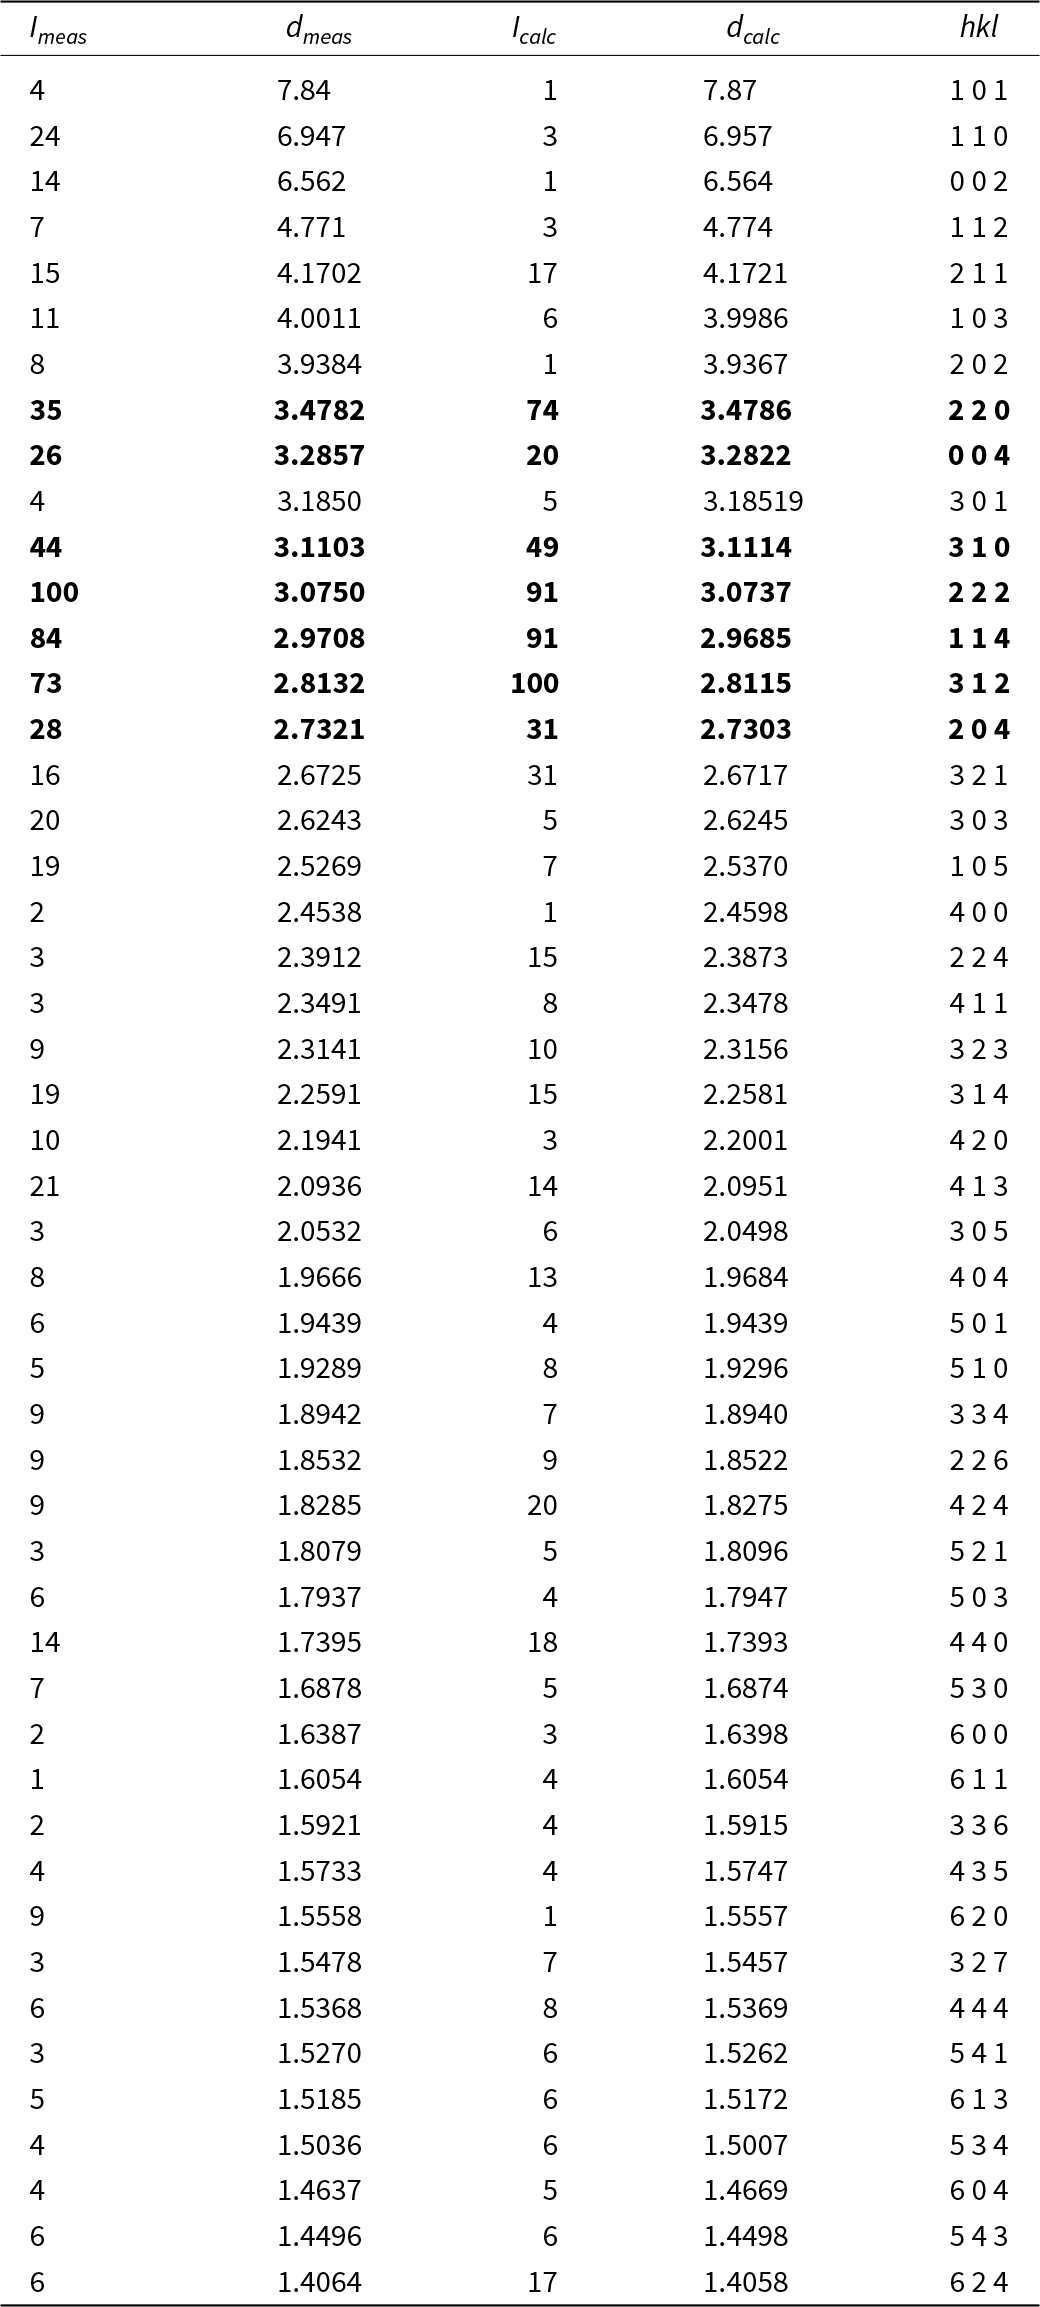
The unit-cell parameters determined from the powder pattern are: a = 9.839(2) Å, c = 13.129(7) Å, V = 1270.90(8) Å3, and Z = 2, which are in good agreement with the single-crystal data. The strongest lines of the powder X-ray diffraction data [listed as d in Å (I in %) (hkl)] are: 3.4782 (35) (220); 3.2857 (26) (004); 3.1103 (44) (310); 3.0750 (100) (222); 2.9708 (84) (114); 2.8132 (73) (312) and 2.7321 (28) (204).
Crystal structure
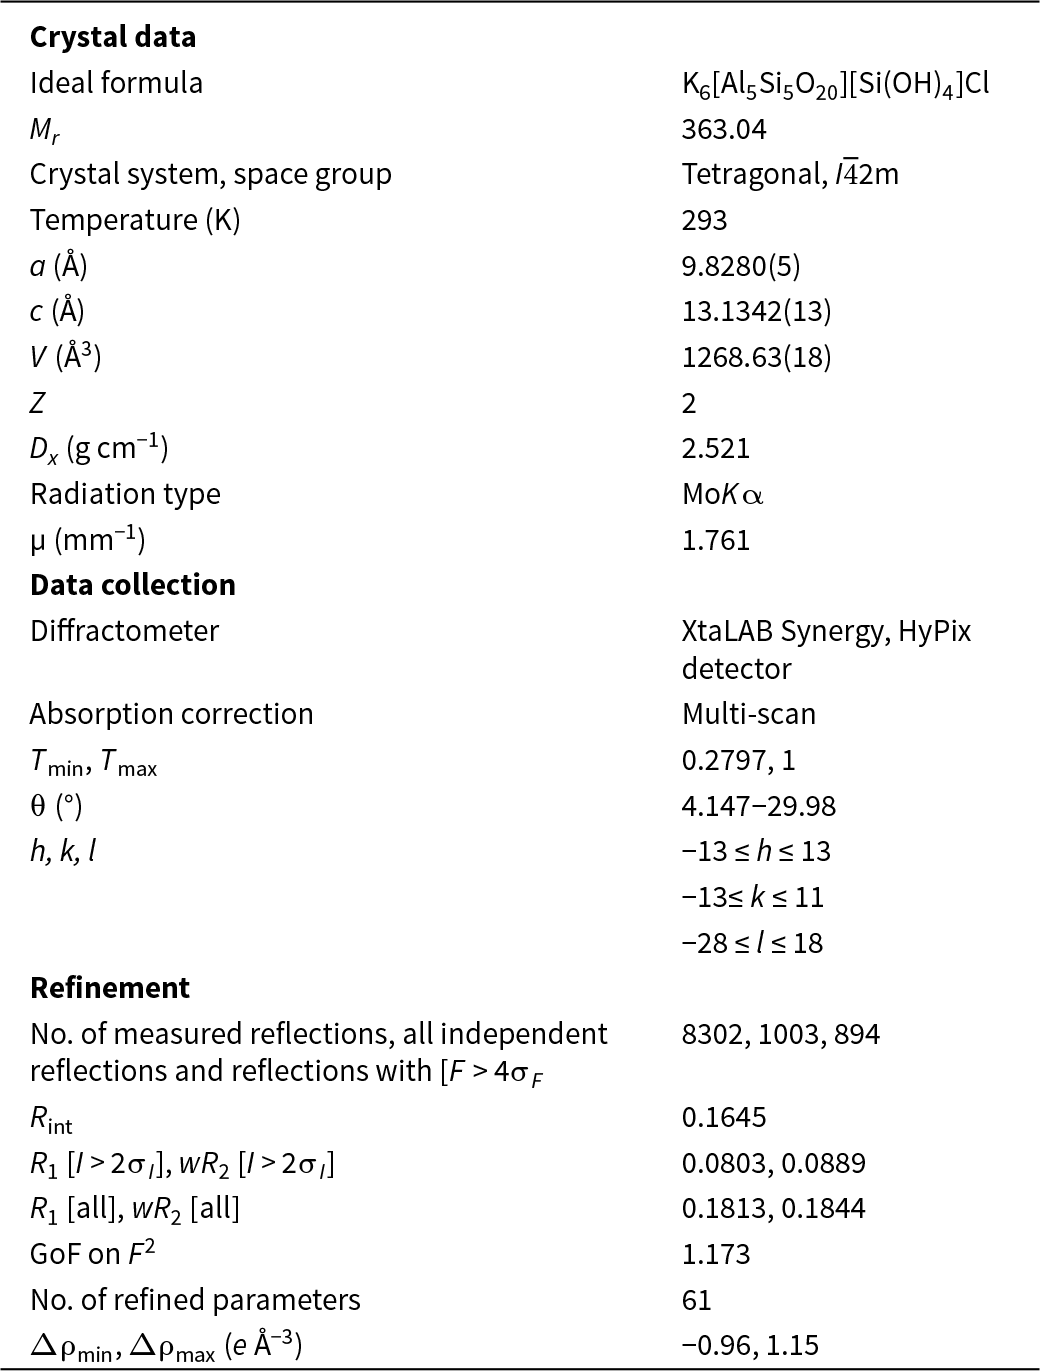
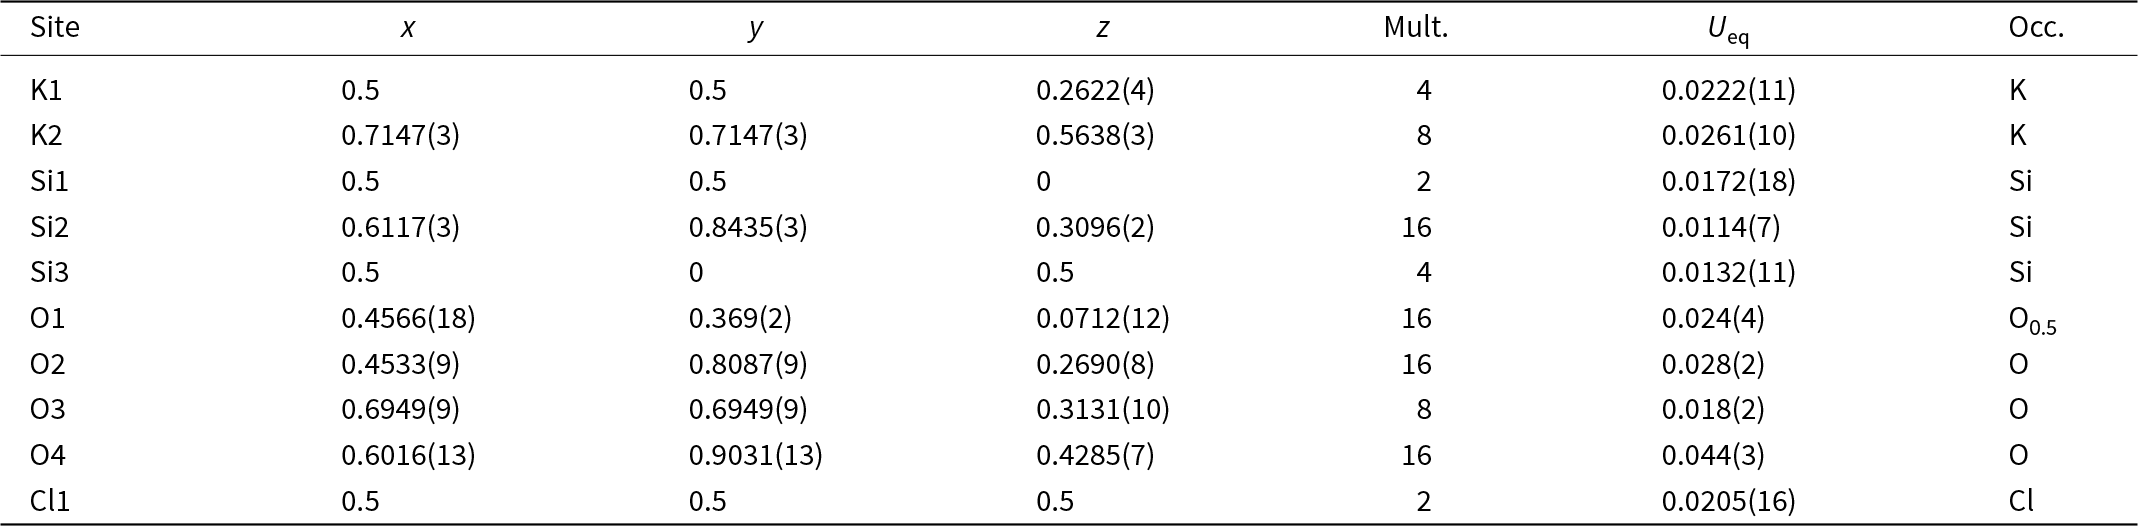
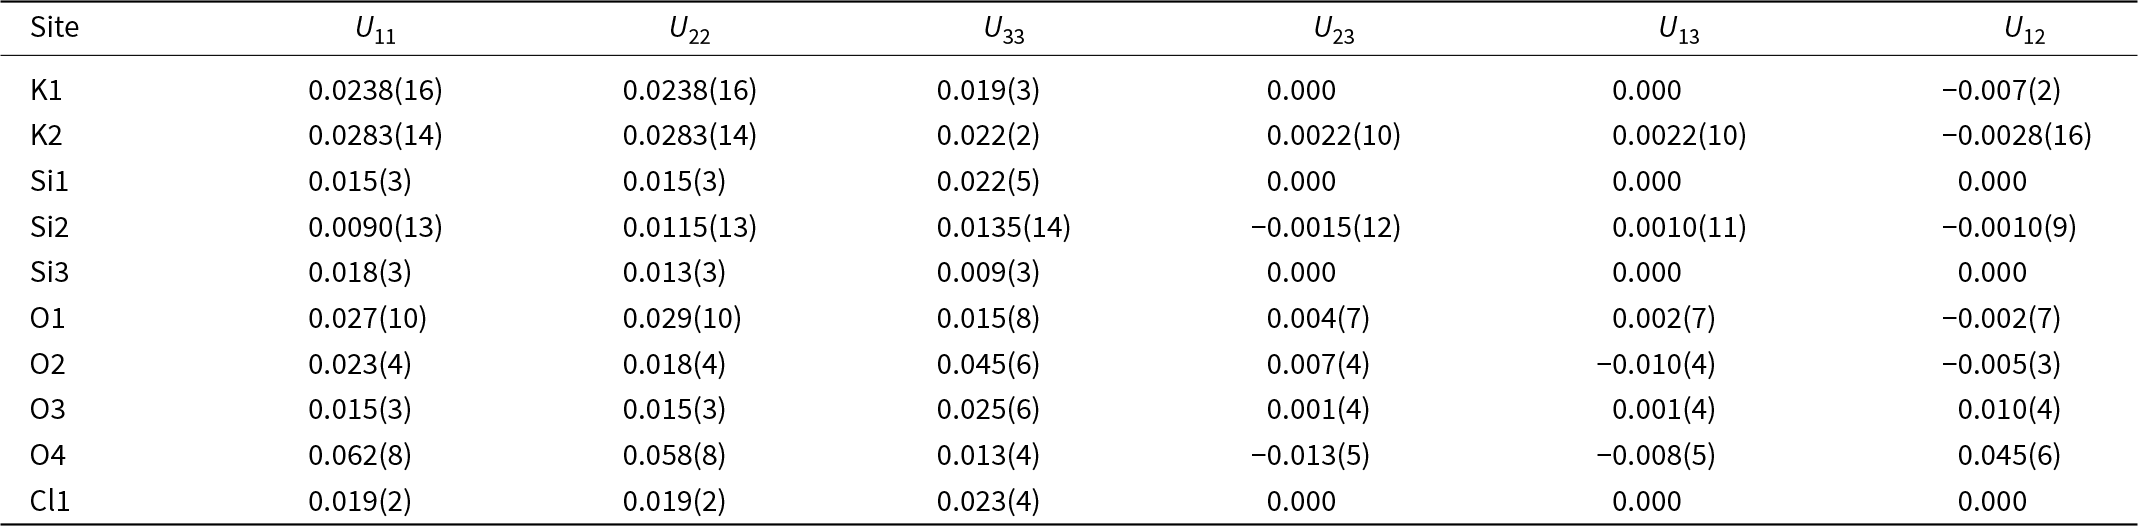
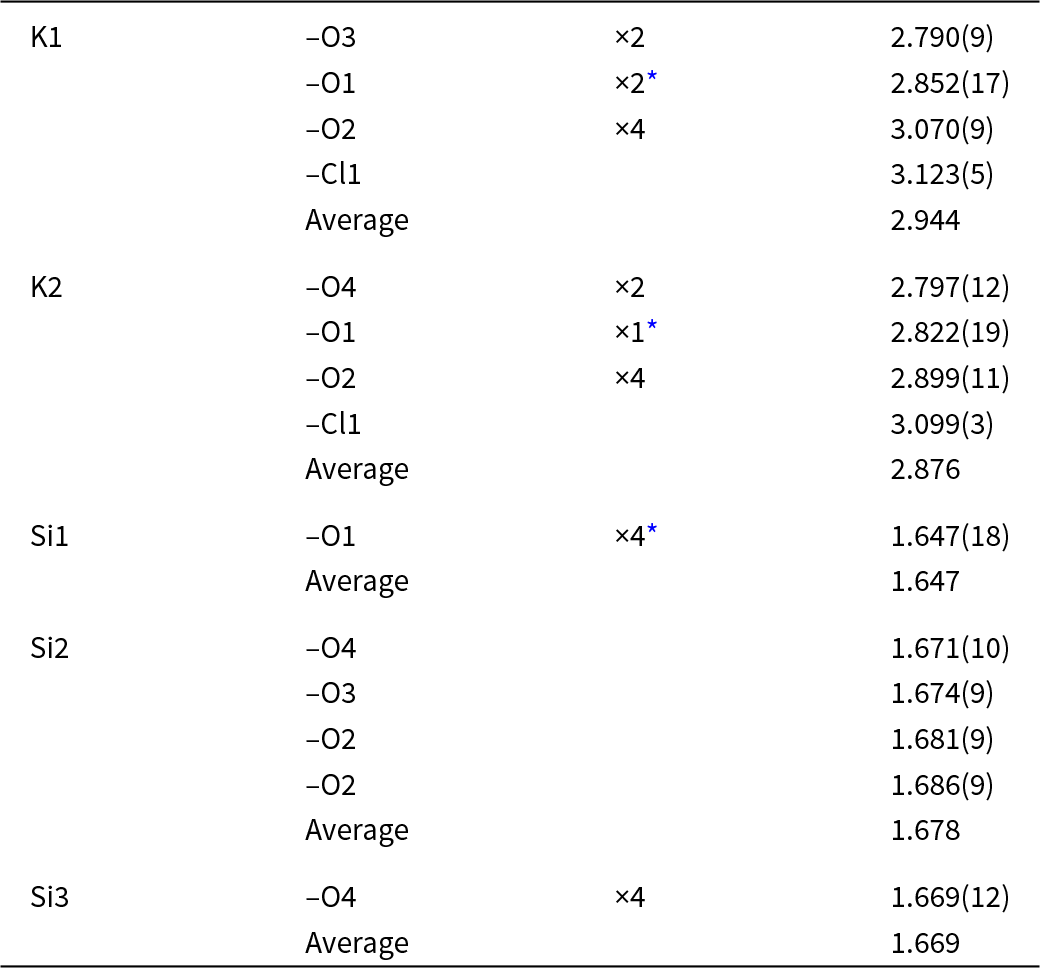
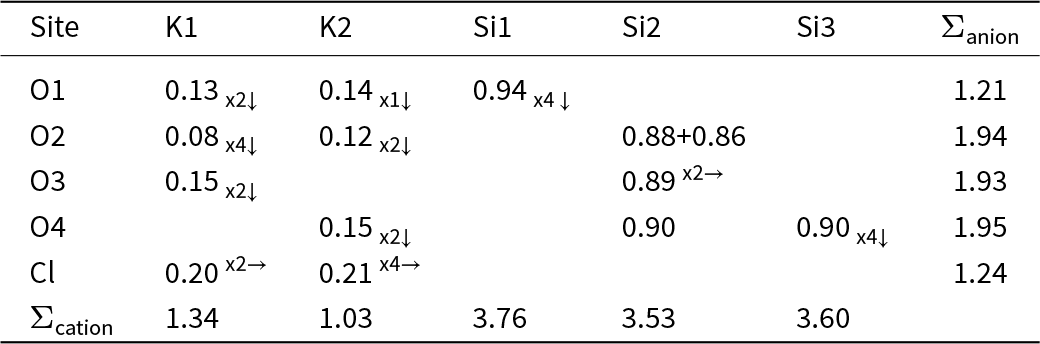
Single-crystal X-ray studies were carried out by means of a Rigaku XtaLAB Synergy-S diffractometer (MoKα radiation) with a high-stability sharp-focus X-ray source PhotonJet-S and a high-speed direct-action detector HyPix-6000HE. The CrysAlisPro software was used for further processing (CrysAlisPro Software System, version 1.171.39.44, Agilent Technologies, 2015). An absorption correction was introduced using the SCALE3 ABSPACK algorithm. The obtained data were loaded into the Olex2 program software (Dolomanov et al., Reference Dolomanov, Bourhis, Gildea, Howard and Puschmann2009) and the crystal structure was solved by direct methods and refined by the ShelX program package (Sheldrick, Reference Sheldrick2015). The illustrations were created using the DIAMOND program (Brandenburg and Putz, Reference Brandenburg and Putz2005). The atomic scattering coefficients for neutral atoms, together with corrections for anomalous dispersion, were taken from the International Tables of Crystallography (Prince, Reference Prince2004). The crystal data, experimental details of the data collection and refinement results are shown in Table 3. Table 4 lists the fractional atomic coordinates, site occupancy, site symmetry and equivalent isotropic atomic displacement parameters (U eq). Anisotropic atomic displacement parameters (Uij) are presented in Table 5. Selected interatomic distances are given in Table 6. Bond-valence sum (BVS) calculations (Table 7) were performed using the bond-length parameters from Brown and Altermatt (Reference Brown and Altermatt1985) and Gagné and Hawthorne (Reference Gagné and F.C2015). BVS parameters were taken from Gagné and Hawthorne (Reference Gagné and F.C2015) for the K–O, Si–O and Al–O bonds and from Brown and Altermatt (Reference Brown and Altermatt1985) for the K–Cl bond. The crystallographic information file has been deposited with the Principal Editor of Mineralogical Magazine and is available as Supplementary material (see below). The unit-cell parameters determined from the single-crystal X-ray data are: a = 9.8280(5) Å, c = 13.1342(13) Å, V = 1268.63(18) Å3, and Z = 2.
Powder X-ray diffraction data (d in Å) for arzamastsevite*

Table 2 Long description
Powder X ray diffraction lines are listed with columns for Imeas, dmeas in angstroms, Icalc, dcalc, and hkl. Measured d spacings run from 7.84 down to 1.4064 angstroms. The largest Imeas value is 100 at dmeas 3.0750 angstroms with Icalc 91, dcalc 3.0737, and hkl 2 2 2. Other high Imeas entries include 84 at dmeas 2.9708 with Icalc 91 and hkl 1 1 4, and 73 at dmeas 2.8132 with Icalc 100 and hkl 3 1 2. Additional prominent measured intensities are 44 at dmeas 3.1103 with hkl 3 1 0, and 35 at dmeas 3.4782 with Icalc 74 and hkl 2 2 0. Across rows, dmeas and dcalc are close in value, for example 7.84 versus 7.87, 3.0750 versus 3.0737, and 1.9439 versus 1.9439. Lower Imeas values appear throughout, including 1 at dmeas 1.6054 with hkl 6 1 1 and 2 at dmeas 2.4538 with hkl 4 0 0.
* The strongest lines are given in bold.
Crystal parameters, data collection and structure refinement details for arzamastsevite

Table 3 Long description
Crystal data, data collection, and refinement details are listed for arzamastsevite. The ideal formula is K6 Al5 Si5 O20 with Si OH 4 and Cl, with Mr 363.04. The crystal system is tetragonal with space group I bar 4 2m, measured at 293 K. Unit cell parameters are a 9.8280 angstrom and c 13.1342 angstrom, with volume 1268.63 cubic angstrom and Z 2; Dx is 2.521 grams per cubic centimeter. Radiation type is MoK alpha with mu 1.761 per millimeter. Data collection used an XtaLAB Synergy diffractometer with HyPix detector, multi scan absorption correction, Tmin 0.2797 and Tmax 1, theta range 4.147 to 29.98 degrees, and index ranges from minus 13 to 13 for h, minus 13 to 11 for k, and minus 28 to 18 for l. Refinement reports 8302 measured reflections, 1003 independent reflections, and 894 reflections with F greater than 4 sigma F; Rint is 0.1645. R1 and wR2 for I greater than 2 sigma I are 0.0803 and 0.0889, and for all data are 0.1813 and 0.1844. Goodness of fit on F squared is 1.173, with 61 refined parameters and residual density minimum minus 0.96 and maximum 1.15 electrons per cubic angstrom.
Fractional atom coordinates, site multiplicities (Mult.), equivalent displacement parameters (U eq, Å2), and site composition for arzamastsevite

Table 4 Long description
Fractional atom coordinates are given by columns, x, y, and z, along with site multiplicity in column, Mult., equivalent displacement parameter in column, Ueq, with units of angstrom squared, and site composition in column, Occ. K1 has x 0.5, y 0.5, z 0.2622(4), Mult. 4, Ueq 0.0222(11), Occ. K; K2 has x 0.7147(3), y 0.7147(3), z 0.5638(3), Mult. 8, Ueq 0.0261(10), Occ. K. Si1 has x 0.5, y 0.5, z 0, Mult. 2, Ueq 0.0172(18), Occ. Si; Si2 has x 0.6117(3), y 0.8435(3), z 0.3096(2), Mult. 16, Ueq 0.0114(7), Occ. Si; Si3 has x 0.5, y 0, z 0.5, Mult. 4, Ueq 0.0132(11), Occ. Si. O1 has x 0.4566(18), y 0.369(2), z 0.0712(12), Mult. 16, Ueq 0.024(4), Occ. O0.5; O2 has x 0.4533(9), y 0.8087(9), z 0.2690(8), Mult. 16, Ueq 0.028(2), Occ. O; O3 has x 0.6949(9), y 0.6949(9), z 0.3131(10), Mult. 8, Ueq 0.018(2), Occ. O; O4 has x 0.6016(13), y 0.9031(13), z 0.4285(7), Mult. 16, Ueq 0.044(3), Occ. O. Cl1 has x 0.5, y 0.5, z 0.5, Mult. 2, Ueq 0.0205(16), Occ. Cl. Notes associated with the table state that Si2 and Si3 are expected to be occupied by Al0.5Si0.5, and that the site occupancy factor for O1 is fixed and corresponds to OH0.5.
Notes: Si2 and Si3 are expected to be occupied by (Al0.5Si0.5); the site occupancy factor O1 is fixed and corresponds to (OH)0.5
Anisotropic atomic displacement parameters for arzamastsevite

Table 5 Long description
Anisotropic atomic displacement parameters are listed by site, with columns U11, U22, U33, U23, U13, and U12. K1: U11 0.0238(16), U22 0.0238(16), U33 0.019(3), U23 0.000, U13 0.000, U12 minus 0.007(2). K2: U11 0.0283(14), U22 0.0283(14), U33 0.022(2), U23 0.0022(10), U13 0.0022(10), U12 minus 0.0028(16). Si1: U11 0.015(3), U22 0.015(3), U33 0.022(5), U23 0.000, U13 0.000, U12 0.000; Si2: U11 0.0090(13), U22 0.0115(13), U33 0.0135(14), U23 minus 0.0015(12), U13 0.0010(11), U12 minus 0.0010(9); Si3: U11 0.018(3), U22 0.013(3), U33 0.009(3), U23 0.000, U13 0.000, U12 0.000. O1: U11 0.027(10), U22 0.029(10), U33 0.015(8), U23 0.004(7), U13 0.002(7), U12 minus 0.002(7); O2: U11 0.023(4), U22 0.018(4), U33 0.045(6), U23 0.007(4), U13 minus 0.010(4), U12 minus 0.005(3); O3: U11 0.015(3), U22 0.015(3), U33 0.025(6), U23 0.001(4), U13 0.001(4), U12 0.010(4); O4: U11 0.062(8), U22 0.058(8), U33 0.013(4), U23 minus 0.013(5), U13 minus 0.008(5), U12 0.045(6). Cl1: U11 0.019(2), U22 0.019(2), U33 0.023(4), U23 0.000, U13 0.000, U12 0.000.
Selected interatomic distances in arzamastsevite (in Å)

Table 6 Long description
Interatomic distances are listed in angstroms for K1, K2, Si1, Si2, and Si3 to neighboring O and Cl atoms, with multiplicities and averages. For K1, distances are to O3 with multiplicity 2 at 2.790(9), to O1 with multiplicity 2 and an asterisk at 2.852(17), to O2 with multiplicity 4 at 3.070(9), and to Cl1 at 3.123(5), with an average of 2.944. For K2, distances are to O4 with multiplicity 2 at 2.797(12), to O1 with multiplicity 1 and an asterisk at 2.822(19), to O2 with multiplicity 4 at 2.899(11), and to Cl1 at 3.099(3), with an average of 2.876. For Si1, the distance to O1 has multiplicity 4 and an asterisk at 1.647(18), with an average of 1.647. For Si2, distances are to O4 at 1.671(10), to O3 at 1.674(9), to O2 at 1.681(9), and to O2 again at 1.686(9), with an average of 1.678. For Si3, the distance to O4 has multiplicity 4 at 1.669(12), with an average of 1.669. Asterisks appear on O1 entries for K1, K2, and Si1.
* Taking into account the half occupancy of O1 site.
Bond valences (in valence units) for arzamastsevite

Table 7 Long description
Bond valences in valence units are listed by anion site rows O1 to O4 and Cl, against cation site columns K1, K2, Si1, Si2, and Si3, with an anion total column. Row O1 has K1 0.13 with a twofold marker, K2 0.14 with a onefold marker, and Si1 0.94 with a fourfold marker, giving an anion total of 1.21. Row O2 has K1 0.08 with a fourfold marker, K2 0.12 with a twofold marker, and Si2 values 0.88 plus 0.86, for an anion total of 1.94. Row O3 has K1 0.15 with a twofold marker and Si2 0.89 with a twofold marker, for an anion total of 1.93. Row O4 has K2 0.15 with a twofold marker, Si2 0.90, and Si3 0.90 with a fourfold marker, for an anion total of 1.95. Row Cl has K1 0.20 with a twofold marker and K2 0.21 with a fourfold marker, for an anion total of 1.24. The final row gives cation totals of 1.34 for K1, 1.03 for K2, 3.76 for Si1, 3.53 for Si2, and 3.60 for Si3.
Note: BVS is obtained by multiplying on the site occupancy factor for the O1 site. In mixed sites bond-valence contribution of each cation has been weighted according to its occupancy. The ×2↓ sign indicates the doubling of the corresponding valence contributions in columns due to symmetry. BVS parameters were taken from Gagné and Hawthorne (Reference Gagné and F.C2015) for the K–O, Si–O and Al–O bonds and from Brown and Altermatt (Reference Brown and Altermatt1985) for the K–Cl bond.
Most of the bands presented are related to tetrahedral vibrations TO4, T stands for Si or Al. The spectrum bands at 3535 and 3326 cm–1, can be assigned to the O–H stretching vibrations. The bands centred at 1112, 1091, 1071, 1043, 1023, 996, 966 and 955 cm–1 are attributed to T–O stretching vibrations (Gujar et al., Reference Gujar, Moye, Coghill, Teeters, Roberts and G.L2005; Tsai et al., Reference Tsai, Huang, Li, Hung, Jiang, Liu and Chen2021).
The spectral band at 785 cm–1, can be assigned to the Si–O vibration in the [Si(OH)4] group (Zotov and Keppler, Reference Zotov and Keppler2000, Reference Zotov and Keppler2002; Hunt et al., Reference Hunt, Kavner, Schauble, Snyder and Manning2011; McIntosh et al., Reference McIntosh, Swedlund and Söhnel2011). In fact, according to (McIntosh et al., Reference McIntosh, Swedlund and Söhnel2011), the symmetric ν(SiO) mode in the Raman spectra occur at 787 cm−1 for H4SiO4 in solution. According to calculations of the frequencies and the relative Raman intensities of the normal modes of the H4SiO4 molecule (Zotov and Keppler, Reference Zotov and Keppler2000), the band at 760–780 cm−1 is due to the totally symmetric stretching mode of H4SiO4.
The band at 704 cm–1 can be attributed to T–O bending vibrations. The spectrum bands at 533, 524, 446, 433 cm–1 are related to the oxygen atom vibration in T–O–T, and bands centred at 305, 241, 207, 163, 143, 120, 113 cm–1 are attributed to M–O (where M is metal) and lattice modes (Gujar et al., Reference Gujar, Moye, Coghill, Teeters, Roberts and G.L2005; Tsai et al., Reference Tsai, Huang, Li, Hung, Jiang, Liu and Chen2021).
The absence of bands near 750 cm–1, attributed to the [B(OH)4]– group (Zhou et al., Reference Zhou, Fang, Fang and Zhu2011; Zhu et al., Reference Zhu, Zhang, Liu, Zhou, Wang and Fang2020; Sasidharanpillai et al., Reference Sasidharanpillai, Cox, Pye and Tremaine2023), are evidence for the absence of such a group in arzamastsevite, in accordance with the chemical and structural data. Figure 3 shows the spectra of arzamastsevite and minerals containing the B(OH)4– group, namely imayoshiite (Nishio-Hamane et al., Reference Nishio-Hamane, Ohnishi, Momma, Shimobayashi, Miyawaki, Minakawa and Inaba2015; Lafuente et al., Reference Lafuente, Downs, Yang, Stone, Armbruster and Danisi2015; RRUFF ID: R210019.2 https://rruff.info/imayoshiite/) and frolovite (Simonov et al., Reference Simonov, Kazanskaya, Egorov-Tismenko, Zhelezi and N.V1976; Lafuente et al., Reference Lafuente, Downs, Yang, Stone, Armbruster and Danisi2015; RRUFF ID: R070469 https://rruff.info/Frolovite) in the range from 100 to 1300 cm–1. The band at 750 and 755 cm–1, attributed to the [B(OH)4]– group, is present in frolovite and imayoshiite spectra, but is absent in the spectrum of arzamastsevite.
Powder X-ray diffraction
Powder X-ray diffraction data were recorded using a Rigaku R-Axis Rapid II diffractometer system (Gandolfi-like mode, CoKα radiation, 40 kV, 15 mA, rotating anode with the microfocus optics, Debye-Scherrer geometry, d = 127.4 mm, exposure 10 min.). The raw powder XRD data were collected using a program suite designed by Britvin et al. (Reference Britvin, Dolivo-Dobrovolsky and M.G2017). Observed d values and intensities are given in Table 2 along with the calculated values.
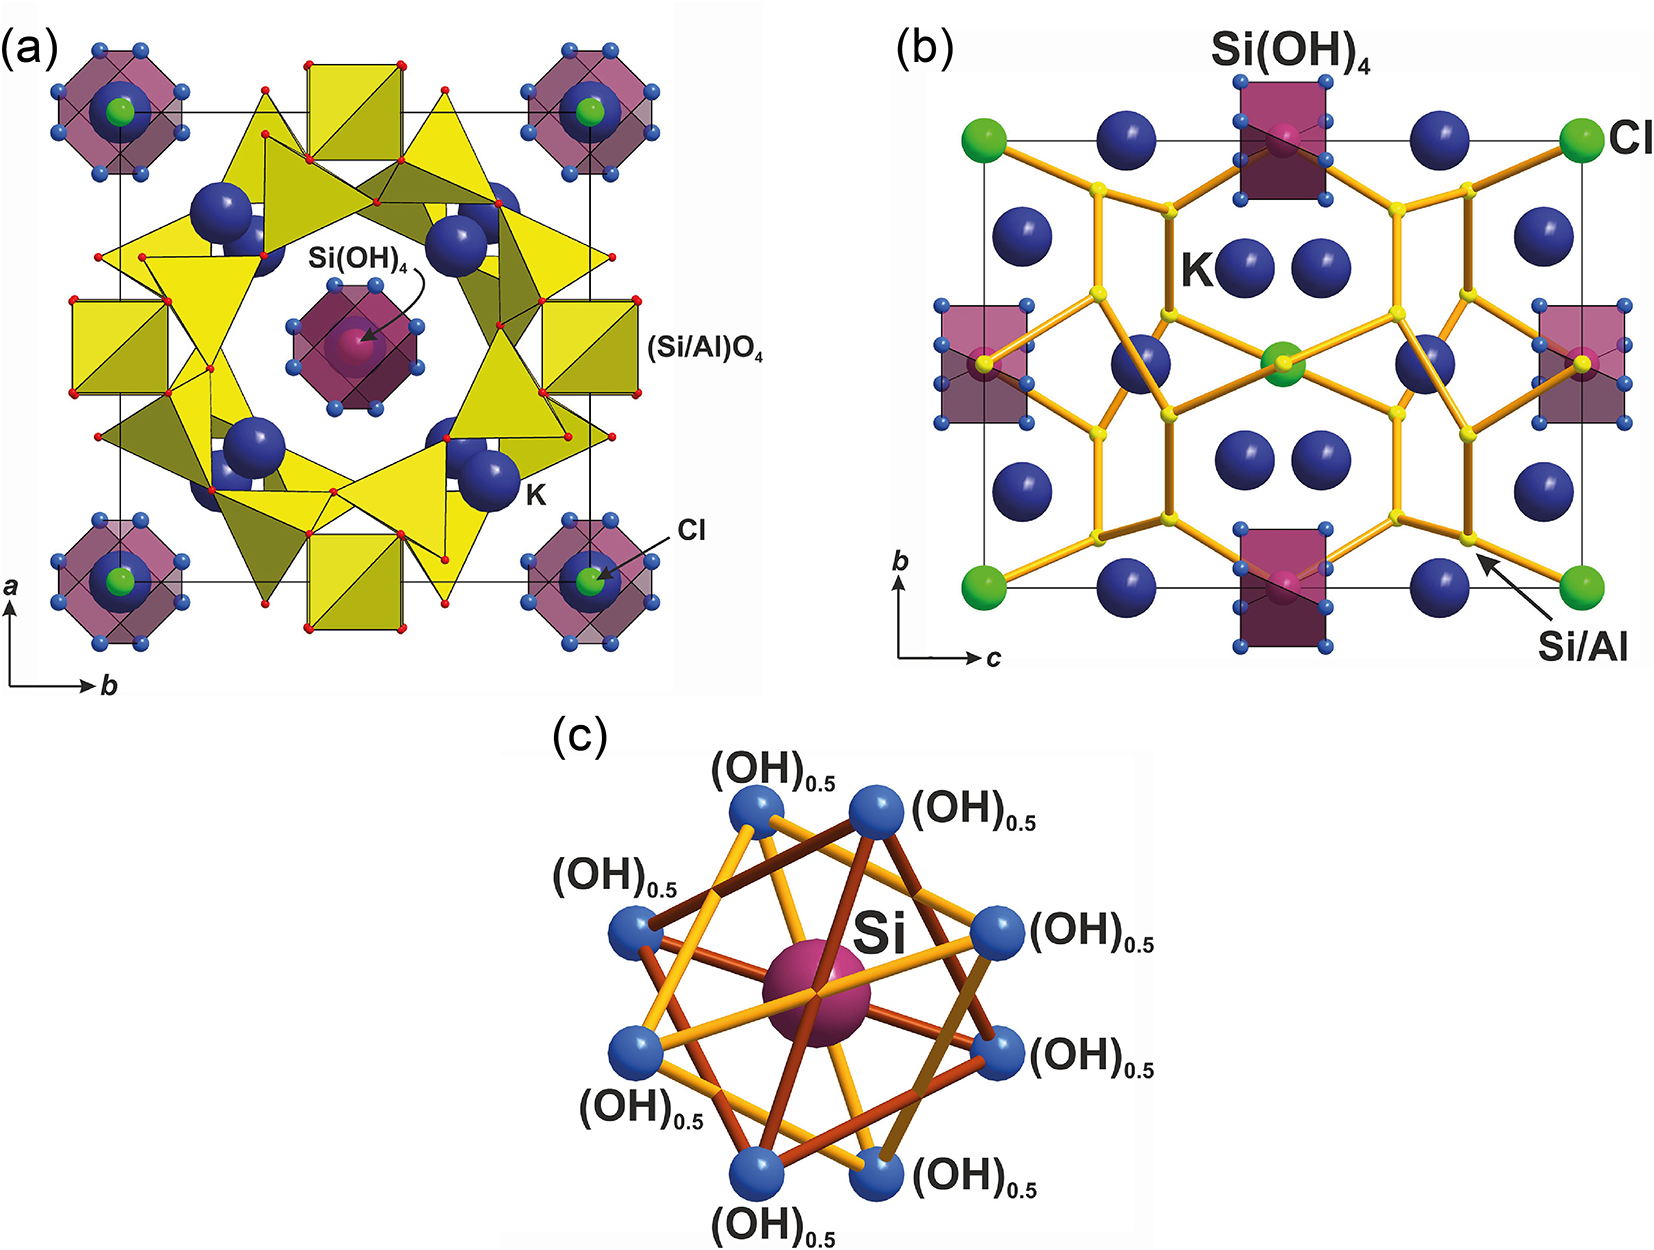
The crystal structure of arzamastsevite (Fig. 4a,b), K6[Al5Si5O20]Cl·[Si(OH)4], is characterized by the EDI type zeolite tetrahedral framework, which is topologically equal to those in the crystal structure of edingtonite Ba2[Al4Si6O20]·4H2O (Gatta et al., Reference Gatta, Ballaran Boffa, Comodi and Zanazzi2004) and kalborsite K6[Al4Si6O20]Cl·[B(OH)4] (Malinovskii and Belov, Reference Malinovskii and N.V1980) as well as related synthetic materials.
General view of the crystal structure of arzamastsevite: (a) projection on the (001); (b) projection on the (100); (c) the disordered [Si(OH)4]0-tetrahedra. The illustrations were created using the DIAMOND program (Brandenburg and Putz, Reference Brandenburg and Putz2005).

Figure 4 Long description
The crystal structure of arzamastsevite is illustrated in three parts. In the first part, projection along the c-axis left parenthesis 001 right parenthesis shows a central Si left parenthesis OH right parenthesis subscript 4 unit surrounded by yellow tetrahedra labeled Si slash Al O subscript 4, forming a framework. Blue spheres represent potassium ions, while green spheres indicate chlorine ions at the corners, highlighting the connectivity of the polyhedral structure. The second part, projection along the a-axis left parenthesis 100 right parenthesis, displays a hexagonal arrangement with Si left parenthesis OH right parenthesis subscript 4 units at the center, surrounded by purple squares and blue spheres representing potassium ions. Green spheres labeled Cl are positioned at the edges, forming a network that illustrates the positions of ions within the framework. The third part depicts the disordered Si left parenthesis OH right parenthesis tetrahedra, with a central Si atom surrounded by OH groups labeled OH subscript 0.5, connected by orange lines, representing the disorder within the tetrahedral arrangement.
In kalborsite, large framework cavities are filled with negatively charged [B(OH)4]–-tetrahedra, whereas in arzamastsevite, neutral [Si(OH)4]0-tetrahedra (Fig. 4c) are present instead of [B(OH)4]–-tetrahedra. To balance the charge, one of the Si atoms in the framework is replaced by Al by the following scheme: Si4+ + [B(OH)4]– → Al3+ + [Si(OH)4]0.
Accordingly, the Si:Al ratio within the framework changes from 2:3 in kalborsite to 1:1 in arzamastsevite. Such differences in the Si:Al ratio are the reason for the increase of the space group from P  $\overline 4 $21c in kalborsite (Malinovskii and Belov, Reference Malinovskii and N.V1980) where Si and Al are ordered within the tetrahedral sites to I
 $\overline 4 $2m in arzamastsevite. Such a relationship between symmetry and the Si:Al ratio is well known in tetrahedral framework minerals, i.e. in plagioclase and zeolites.
The structural model of kalborsite (space group P  $\overline 4 $21c) was used to check and compare the obtained results, however, the refinement in this model was considered by us to be inappropriate for the following reasons (in comparison with the model in space group I
 $\overline 4 $2m): lower refinement parameters (including the R-factor and non-positive values of atomic displacements for some atomic sites), unreasonable values and structural units (s.u.) for bond lengths as well as calculated BVS values. The minerals and synthetic compounds with EDI-type framework are also characterized by the orthorhombic and monoclinic space groups of symmetry (Aksenov et al., Reference Aksenov, Chukanov, Rastsvetaeva, Pushcharovsky, Deyneko, Kalashnikova, Tananaev, Burns and Altermatt2025). However, due to the absence of crystal chemical and structural peculiarities for lowering the symmetry for arzamastsevite we did not check all of the possible variants.
Thus, the model within the space group I  $\overline 4 $2m was accepted as more reliable. This model is probably realized due to the disordering of Al and Si over tetrahedral positions (it should also be noted that there are no reflections that violate the conditions for the I-cell). The high value of R int and other refinement parameters is primarily due to the low quality of the studied crystal. No merohedral twinning was detected according to the structural data (however, it should be noted that the quality of the structurally studied crystal and, accordingly, the collected data is not the best).
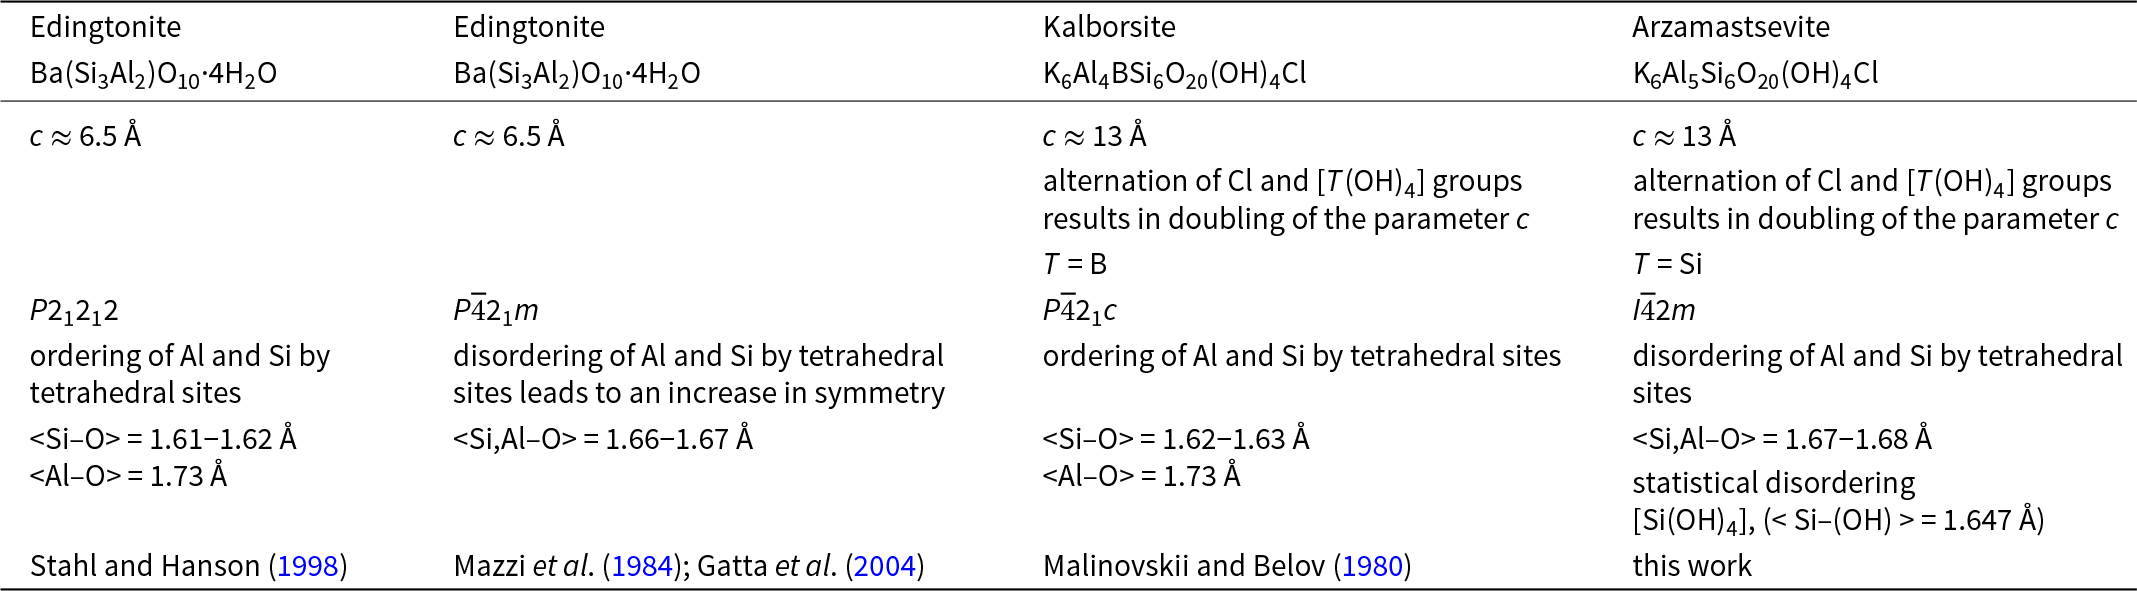
A comparison of the c parameters, space groups and features of the crystal structures of edingtonite, kalborsite and arzamastsevite is given in Table 8.
Comparative data for edingtonite, kalborsite and arzamastsevite

Table 8 Long description
Four mineral columns compare chemical composition, c parameter in angstroms, a note on alternation effects, a T assignment, space group, tetrahedral site ordering, mean bond lengths, and references. Two edingtonite entries list the same composition, barium with silicon and aluminium and ten oxygens plus four waters, and both list c near 6.5 angstroms. Kalborsite lists a potassium aluminum boron silicon oxyhydroxyl chloride composition and c near 13 angstroms; arzamastsevite lists a potassium aluminium silicon oxyhydroxyl chloride composition and c near 13 angstroms. For kalborsite and arzamastsevite, a note states that alternation of chlorine and tetrahydroxyl groups results in doubling of the c parameter, and the T entry is boron for kalborsite and silicon for arzamastsevite. Space groups are P21212 for the first edingtonite, P overbar 4 21m for the second edingtonite, P overbar 4 21c for kalborsite, and I overbar 4 2m for arzamastsevite. Tetrahedral site text states ordering of aluminium and silicon for the first edingtonite and for kalborsite, and disordering for the second edingtonite and for arzamastsevite, with the second edingtonite noting increased symmetry. Mean bond lengths list silicon oxygen near 1.61 to 1.62 angstroms for the first edingtonite and 1.62 to 1.63 angstroms for kalborsite; mixed silicon aluminium oxygen near 1.66 to 1.67 angstroms for the second edingtonite and 1.67 to 1.68 angstroms for arzamastsevite. Aluminium oxygen is 1.73 angstroms for the first edingtonite and for kalborsite; arzamastsevite lists statistical disordering and also lists silicon hydroxyl with a mean silicon hydroxyl length of 1.647 angstrom.
The <T–O> distances of tetrahedra in arzamastsevite are 1.678 and 1.669 Å, which are consistent with a mixed [Si0.5Al0.5] occupancy. The large cavities of the framework of tetrahedra in the arzamastsevite crystal structure are filled by K cations, Cl anions as well as [Si(OH)4]-tetrahedra. The Si–OH distances are generally similar with those, reported for the orthosilicic acid and its oligomers (Igarashi et al., Reference Igarashi, Matsumoto, Yagihashi, Yamashita, Ohhara, Hanashima, Nakao, Moyoshi, Sato and Shimada2017), but slightly differ because of the different nature of the coordinational ligands. The Si1–O1 bond length in arzamastsevite is 1.647 Å. Igarashi and colleagues (Igarashi et al., Reference Igarashi, Matsumoto, Yagihashi, Yamashita, Ohhara, Hanashima, Nakao, Moyoshi, Sato and Shimada2017) reported the following values for Si(OH)4: Si1–O1 (×2): 1.610 Å (by neutron diffraction) and 1.6186 Å (by X-ray diffraction); Si1–O2 (×2): 1.621 Å (by neutron diffraction) and 1.6258 Å (by X-ray diffraction); <Si–O> = 1.616 (by neutron diffraction) and 1.622 (by X-ray diffraction).
Discussion
Arzamastsevite, K6Al5Si6O20(OH)4Cl, a new mineral from the Lovozero alkaline massif (Kola Peninsula, Russia), is classified as a zeolite according to the definition of a zeolite mineral (Coombs et al., Reference Coombs, Alberti, Armbruster, Artioli, Colella, Galli, Grice, Liebau, Mandarino, Minato, Nickel, Passaglia, Peacor, Quartieri, Rinaldi, Ross, Sheppard, Tillmanns and Vezzalini1998): “A zeolite mineral is a crystalline substance with a structure characterized by a framework of linked tetrahedra, each consisting of four O atoms surrounding a cation. This framework contains open cavities in the form of channels and cages”. Additionally, arzamastsevite is a separate zeolite species under Rule 1a of the nomenclature for zeolite minerals (Coombs et al., Reference Coombs, Alberti, Armbruster, Artioli, Colella, Galli, Grice, Liebau, Mandarino, Minato, Nickel, Passaglia, Peacor, Quartieri, Rinaldi, Ross, Sheppard, Tillmanns and Vezzalini1998). It has an EDI-type topology of the framework and a composition which is distinctive in that [Si(OH)4]0-tetrahedra is present as an extra-framework group.
The crystal structure of arzamastsevite is generally similar to the crystal structure of kalborsite. In kalborsite, large framework cavities are filled with K cations, Cl anions, and negatively charged [B(OH)4]–-tetrahedra, whereas in arzamastsevite, neutral [Si(OH)4]0-tetrahedra are present instead of [B(OH)4]– groups. To balance the charge, one of the Si atoms in the framework is replaced by Al: Si4+ → Al3+.
The evidence for such a substitution is as follows: (1) The absence of the [B(OH)4]– group in arzamastsevite is confirmed by spectroscopic data. The Raman spectrum of this mineral does not contain bands near 750 cm–1 (Fig. 3). (2) The absence of negatively charged [B(OH)4]–-tetrahedra in arzamastsevite is confirmed by the Si:Al ratio of 1:1. Since part of the crystal structure of K6[Al5Si5O20]Cl is neutral, the presence of negatively charged [B(OH)4]– is impossible. (3) The presence of the [Si(OH)4]0 group in arzamastsevite is confirmed by spectroscopic data. The Raman spectrum of this mineral contains a band at 785 cm–1 (Fig. 3), corresponding to the symmetric stretching mode of H4SiO4. (4) The presence of the [Si(OH)4]0 group instead of the [B(OH)4]– group is confirmed by the electron density at the site as well as T–OH distances. The Si–OH distances in arzamastsevite (1.647 Å) are similar to those in orthosilicic acid (Igarashi et al., Reference Igarashi, Matsumoto, Yagihashi, Yamashita, Ohhara, Hanashima, Nakao, Moyoshi, Sato and Shimada2017). In the crystal structure of kalborsite, the B–OH distance is 2.345 Å (Malinovskii and Belov, Reference Malinovskii and N.V1980).
Arzamastsevite is a mineral of hydrothermal origin. It forms intergrowths with natrolite, which replaces feldspar and sodalite. It can be assumed that simultaneous hydrothermal alteration (natrolitization) of sodalite and feldspar is a necessary condition for the arzamastsevite crystallization. The source of potassium for the formation of arzamastsevite is feldspar, and the source of chlorine is sodalite.
Supplementary material
The supplementary material for this article can be found at https://doi.org/10.1180/mgm.2025.10182.
Acknowledgements
The X-ray diffraction studies were done at the Center for X-Ray Diffraction Studies of the Research Park of St. Petersburg State University. The authors acknowledge Saint-Petersburg State University for a research project 124032000029-9. We also thank reviewers for important comments. Investigations were funded by the Ministry of Science and Higher Education of the Russian Federation, project no. FMEZ-2024-0008.
Competing interests
The authors declare none.