Introduction
Many products are developed through an incremental design change. However, design changes initially perceived to be simple can sometimes propagate and result in undesirable outcomes (Eckert et al., Reference Eckert, Clarkson and Zanker2004; Giffin et al., Reference Giffin, de Weck, Buonova, Keller, Eckert and Clarkson2009; Shankar et al., Reference Shankar, Morkos and Summers2012; Fernandes et al., Reference Fernandes, Henriques, Silva and Moss2015). Design change is also referred to as “engineering change” in an engineering context and is described as “an alteration made to parts, drawings or software that has already been released during the product design process” (Jarratt et al., Reference Jarratt, Eckert, Caldwell and Clarkson2011). The propagation of change is described as “the process by which an engineering change to parts of a product results in one or more additional engineering changes to other parts of the product, when those changes would not otherwise have been required” (Koh et al., Reference Koh, Caldwell and Clarkson2012). In an empirical study documented by Clarkson et al. (Reference Clarkson, Simons and Eckert2004), chief engineers at an aerospace company consistently pointed out that design changes can propagate through indirect linkages and affect product/system components that are as far as four steps (i.e., linkages) away from the initial change. This assertion is supported in another empirical case study reported by Duran-Novoa et al. (Reference Duran-Novoa, Weigl, Henz and Koh2018) which traced the propagation of changes in the design of an electrical motorcycle and found that change propagation accounted for 20% of all changes made, with 67% of change propagation reaching components that were one step away from the initial change, 25% reaching components that were two steps away, and 8% reaching components that were between three to five steps away. Failure to anticipate design changes can, therefore, lead to delays and financial losses (BBC News, 2009).
Approaches to predict design change and its propagation include analyzing past changes (Suh et al., Reference Suh, de Weck and Chang2007; Yin et al., Reference Yin, Tang, Wang, Ullah and Zhang2017) and uncovering existing change dependencies (Clarkson et al., Reference Clarkson, Simons and Eckert2004; Xie and Ma, Reference Xie and Ma2016; Lee and Hong, Reference Lee and Hong2017; Chen et al., Reference Chen, Zheng, Xi and Li2020). The metric used to examine design change include engineering tolerance (Hamraz et al., Reference Hamraz, Hisarciklilar, Rahmani, Wynn, Thomson and Clarkson2013), workload (Tang et al., Reference Tang, Yin, Wang, Ullah, Zhu and Leng2016), staff affected (Koh et al., Reference Koh, Forg, Kreimeyer and Lienkamp2015), lead time (Ullah et al., Reference Ullah, Tang, Yin, Hussain and Wang2018), manufacturing (Siddharth and Sarkar, Reference Siddharth and Sarkar2017), lifecycle performance (Cardin et al., Reference Cardin, Kolfschoten, Frey, de Neufville, de Weck and Geltner2013), and profit margin (Yassine and Khoury, Reference Yassine and Khoury2021). Endogenous change dependencies between product components can be extracted from Product Data Management systems and engineering databases to support design change analysis (Jarratt et al., Reference Jarratt, Eckert, Caldwell and Clarkson2011). Exogenous change data such as customer needs are traditionally collected manually through user interviews and focus groups, which can be costly and inefficient. There is a growing effort to automate customer needs analysis from online data through artificial intelligence (AI) (Tucker and Kim, Reference Tucker and Kim2009; Tuarob and Tucker, Reference Tuarob and Tucker2015b; Sha et al., Reference Sha, Saeger, Wang, Fu and Chen2017; Tang et al., Reference Tang, Jin, Liu, Li and Zhang2019; Zhou et al., Reference Zhou, Ayoub, Xu and Yang2020). However, little work has been done to explore how such AI approaches can be integrated with design change prediction.
This paper reports on the development of a method that uses AI approaches to identify opportunities for design change and the set of product components affected by the change. The goal of the method is to aid decision quality in product planning by offering new ideas and insights from a customer sentiment perspective through social media data where a large volume of textual data is available and manual reading is impracticable. The work is positioned in the context of incremental design where an existing product architecture is present and early prediction of design change propagation between product components can be used to better understand the change impact associated with the new ideas. The output of this work can be used to identify key personnel responsible for the components affected by the new ideas and the resources required to support the change. In doing so, the change impact on the product architecture can be established and used to complement existing processes (e.g., cost assessment) to aid decision quality in product planning. The study connects two fields of research that are usually considered in isolation (i) the use of natural language processing in customer sentiment analysis and (ii) the use of dependency modeling in change prediction. The main contributions of this work are summarized as follows:
(1) A set of algorithms for uncovering product components that might be directly or indirectly affected by change candidates identified from social media.
(2) Analysis results from a case example that explore the feasibility and limitations of the proposed method.
(3) The dataset used in the case example (YouTube comments, https://github.com/NLPT/P1data).
Related work
This section is divided into two parts. The first part discusses the use of AI in customer needs analysis and focuses on the context of extracting product information from textual data in social media. The second part discusses techniques in design change prediction and establishes possible junctures to connect the two fields of research.
Analyzing customer needs from online data
Customer data come in many forms. Some data are captured in numerical and categorical format and are suitable for clustering and correlation studies. For instance, Wang et al. (Reference Wang, Sha, Huang, Contractor, Fu and Chen2018) present a data-driven approach that uses the correlation between customer preferences and product attributes to predict product co-consideration for a given customer demographic. Long et al. (Reference Long, Erickson and MacDonald2019) introduce a framework that models the customer decision-making process during purchase and links the considerations made to design requirements. Xie et al. (Reference Xie, Bi, Sha, Wang, Fu, Contractor, Gong and Chen2020) describe a dynamic network-based approach that analyses the evolution of product competitions through customer data captured across multiple years. Customer reviews can come in the form of textual data documented on professional product review websites (e.g., PC Magazine), e-commerce platforms (e.g., Amazon reviews), and social media (e.g., Twitter). Reviews on professional websites are usually much longer and are a source of valuable customer insights. Indeed, Liu et al. (Reference Liu, Jin, Ji, Harding and Fung2013) argue that a long review can better support latent customer needs elicitation as having more textual data means having more descriptions on the product attributes, user preferences, and use cases. Nevertheless, long reviews are harder to come by compared with short reviews captured on e-commerce platforms and social media.
Despite having less data, the relevance of short online reviews for customer needs analysis is advocated by Tuarob and Tucker (Reference Tuarob and Tucker2015b) in a case study which shows that the incorporation of certain product features can shift the sentiment in social media comments found on Facebook. The validity of using short customer reviews is also demonstrated in a study reported by Archak et al. (Reference Archak, Ghose and Ipeirotis2011) which successfully predicted product demand by using a set of algorithms to analyze sales data and customer review data from Amazon.com. In fact, based on a combined approach of word embedding (word2vec) and X-means clustering, Suryadi and Kim (Reference Suryadi and Kim2018) found that many product features that are mentioned in Amazon.com review titles are closely related to sales rank, suggesting that even textual data as short as titles can be used to better understand customer needs.
Approaches to identify opportunities from customer reviews include using keywords to search for information related to pre-defined product features (Lim and Tucker, Reference Lim and Tucker2016) and sorting all words based on the number of times they occur (i.e., term frequency) (Liu et al., Reference Liu, Jin, Ji, Harding and Fung2013). Affective words (e.g., “beautiful”) are sometimes emphasized to identify affective design properties that can provoke emotions and enhance customer satisfaction (Chang and Lee, Reference Chang and Lee2018; Wang et al., Reference Wang, Tian, Li, Wang, Barenji and Cheng2019). Topic modeling techniques can also be used to extract customer concerns (Zhan et al., Reference Zhan, Loh and Liu2009; Tang et al., Reference Tang, Jin, Liu, Li and Zhang2019). For instance, Zhou et al. (Reference Zhou, Ayoub, Xu and Yang2020) present a machine learning approach that uses latent Dirichlet allocation (LDA) (Blei et al., Reference Blei, Ng and Jordan2003) to extract topic areas from online review data, allowing users to manually label and scrutinize comments on each topic (e.g., “for kids”, “music-related”).
The sentiment of a comment or a topic (i.e., all comments in the topic) can be examined through supervised machine learning techniques with labeled review data (Tuarob and Tucker, Reference Tuarob and Tucker2015b). Unlabeled review data can also be analyzed through unsupervised lexicon-based techniques (Zhou et al., Reference Zhou, Ayoub, Xu and Yang2020), such as Vader (Hutto and Gilbert, Reference Hutto and Gilbert2014). Methods to fine-tune sentiment analysis include detecting sarcasm in comments (Tuarob et al., Reference Tuarob, Lim, Conrad and Tucker2018) and moderating opinion scores through customer rating history and tendency (Lim et al., Reference Lim, Conrad and Tucker2017). The scope of analysis can be adjusted by differentiating lead users from general users (Tuarob and Tucker, Reference Tuarob and Tucker2015a) and focusing on latent customer needs in extraordinary use cases (Zhou et al., Reference Zhou, Jiao and Linsey2015). Advancement in language models can also unlock new opportunities in customer sentiment analysis. For instance, the development of Transformer-based (Vaswani et al., Reference Vaswani, Shazeer, Parmar, Uszkoreit, Jones, Gomez, Kaiser and Polosukhin2017) language representation model such as the Bidirectional Encoder Representations from Transformers (BERT) (Devlin et al., Reference Devlin, Chang, Lee and Toutanova2018) along with its retrained versions [e.g., RoBERTa (Liu et al., Reference Liu, Ott, Goyal, Du, Joshi, Chen, Levy, Lewis, Zettlemoyer and Stoyanov2019)] has facilitated the use of pre-trained models that were trained on large dataset to be finetuned or used directly in similar tasks.
Analyzing design change propagation
Customer preferences can change over time. The change in preferences can be captured through customer reviews from different time periods and used to anticipate next-generation product features (Tucker and Kim, Reference Tucker and Kim2011; Jin et al., Reference Jin, Liu, Ji and Liu2016; Jiang et al., Reference Jiang, Kwong and Yung2017; Sun et al., Reference Sun, Guo, Shao and Rong2020). While product components directly affected by the new features can be determined based on the design options developed later, components that are indirectly affected through change propagation are usually identified through dependency modeling (Koh, Reference Koh2017). For instance, Kang and Tucker (Reference Kang and Tucker2016) present an AI approach to quantify dependencies between product components by mining textual technical descriptions from a textbook. The approach was demonstrated in a case study involving an automotive climate control system where a model that highlights direct dependencies between product components was produced with 94% accuracy compared to one that was manually created. Song et al. (Reference Song, Luo and Wood2019) discuss a method that uses data of prior design versions to identify a network of functions between components. The method was demonstrated using patent data on spherical rolling robots to identify interdependent platform components. Sarica et al. (Reference Sarica, Luo and Wood2020) describe a technology semantic network (TechNet) that uses natural language processing techniques to extract and vectorize terms from massive patent texts to establish their semantic relationships. Although it was not explicitly discussed, the semantic relationships established in TechNet can be extended to estimate dependencies between product components. The methods discussed above can be used to predict direct change propagation between components (i.e., changing A results in changes in B). Nevertheless, indirect change propagation is not considered in these methods (i.e., changing A results in changes in B, and subsequently changes in C).
The identification of indirect change dependencies through machine learning was explored by Wickel and Lindemann (Reference Wickel and Lindemann2015) where past change data were examined using association rules analysis (Agrawal et al., Reference Agrawal, Imieliński and Swami1993) to uncover component sets affected by frequently co-occurring changes. Approaches based on fault-tree analysis are available as well to reveal indirect component dependencies through functional failure (Roth et al., Reference Roth, Wolf and Lindemann2015). In addition, indirect change dependencies between components can be derived through the modeling of people and documents pertinent to each product component (Lindemann et al., Reference Lindemann, Maurer and Braun2009), through shared process dependencies such as tasks and events (Kreimeyer and Lindemann, Reference Kreimeyer and Lindemann2011; Kasperek et al., Reference Kasperek, Schenk, Kreimeyer, Maurer and Lindemann2016), and through shared association in design specifications and requirements (Kreimeyer, Reference Kreimeyer, Chakrabarti and Lindemann2016).
An established method for modeling indirect change dependencies is the change prediction method (CPM) introduced by Clarkson et al. (Reference Clarkson, Simons and Eckert2004). CPM calculates the combined likelihood of change propagation between any two product components by considering all possible change propagation paths between them using logic trees, where the likelihood of change propagation for a path is computed by multiplying the direct change propagation likelihood between consecutive components along the path. Over the years, extensions to CPM include the handling of concurrent design changes initiated on multiple components (Ahmad et al., Reference Ahmad, Wynn and Clarkson2013) and the addition of a reachability factor to account for finite change propagation resources (Koh et al., Reference Koh, Caldwell and Clarkson2013). Industry evaluations were also carried out and documented (Hamraz and Clarkson, Reference Hamraz and Clarkson2015). Other methods with a similar approach are put forward as well to address design changes carried out at the module-level (a module consists of multiple components) (Yin et al., Reference Yin, Sun, Xu, Shao and Tang2021) and at the feature-level (a component consists of multiple features) (Chen et al., Reference Chen, Zheng, Xi and Li2020). However, it remains unclear how efforts in design change prediction can be integrated to provide insights during the identification of design opportunities from social media.
Method
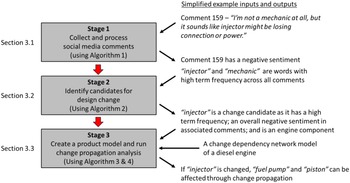
This section describes a method that uses social media sentiment analysis to identify opportunities for design change and the set of product components affected by the change. The method consists of three stages as shown in Figure 1. In Stage 1, social media comments related to a given product are captured for natural language processing to identify frequently used words and the sentiment of the comments containing those words. In Stage 2, frequently used words with comments that are negative in sentiment are checked against the component list of the given product to identify suitable components for design improvement. These components are referred to as “change candidates” in this paper. Lastly, in Stage 3, a product model that describes the change dependencies between its components is created and aligned with the change candidates to predict design change.
Overview of the method using a diesel engine as an example.

Collecting and processing social media comments
The goal of this stage is to gather online comments related to a given product of interest and determine areas that are frequently discussed along with the sentiment of the discussions. There are a number of ways to gather online comments, including the use of Application Programming Interfaces (API) and web scraping tools. The one presented in this paper uses the YouTube API to search for relevant videos and collect comments and replies associated with the videos found (for simplicity, replies are also referred to as comments in the remainder of this paper). The comments found are subsequently put through preprocessing to convert all text into lowercase, remove hyperlinks, remove non-alphanumeric characters except for $ and %, remove redundant spaces between words, reduce all words into their root form through stemming (i.e., “class” and “classes” stemmed as “class”), and remove stop words (i.e., words that have little meaningful semantics). In this work, the list of stop words builds on the Natural Language Toolkit (NLTK, https://www.nltk.org/) open-source Python library (e.g., “he”, “she”, “this”, “that”) and is extended with additional words specific to YouTube (e.g., “subscribe”, “channel”, “video”, “thanks”). The work also uses Google Translate through the deep-translator Python library (https://deep-translator.readthedocs.io) to translate all comments into English.
After the comments are collected and preprocessed, the comments for each video are combined into a corpus and the top words (i.e., most frequently used words) are identified by tokenizing the corpus into separate words for occurrence counting. Each top word is a unigram and the number of top words can be limited by observing a threshold frequency (e.g., more than 30 times). Subsequently, by going through one top word at a time for each video, comments with the top word are combined into a corpus to uncover linked words that are frequently mentioned along with the top word. Each linked word can be a single word (i.e., unigram) or a phrase consisting of a set of consecutive words (i.e., n-gram, n consecutive words). Similar to top words, the number of linked words can also be limited through a threshold frequency (e.g., more than 25% of the top word frequency). A discussion on the choice of threshold frequency is provided in the section “Setting threshold frequency for top words and linked words”. In this work, the “everygrams” function from the NLTK Python library (https://www.nltk.org/) is used together with a counter to identify the top words and their linked words for each video.
Once the top words and linked words are identified for each video, sentiment analysis is conducted for each unprocessed comment containing either a top word or a pairing of both a top word and its linked word through a RoBERTa-base language model that was trained on 58 million tweets and finetuned for sentiment analysis with the TweetEval benchmark (Barbieri et al., Reference Barbieri, Camacho-Collados, Neves and Espinosa-Anke2020) (model available at https://huggingface.co/cardiffnlp/twitter-roberta-base-sentiment). Each comment is classified as “Negative”, “Neutral”, or “Positive”. Subsequently, based on the computation of net sentiment described by Pratama et al. (Reference Pratama, Satyawan, Jannati, Pamungkas, Raspiani, Syahputra and Neforawati2019), a top word is classified as having a net negative sentiment if it is associated with more comments of “Negative” sentiment than “Positive” ones. “Neutral” comments are ignored as they do not affect the polarity of net sentiment (Pratama et al., Reference Pratama, Satyawan, Jannati, Pamungkas, Raspiani, Syahputra and Neforawati2019). The net sentiment for each pairing of top word and its linked word is determined using the same classification scheme. The pseudo-code for the processing of frequently used words (i.e., term frequency) and sentiment analysis is shown in Algorithm 1.

Identifying candidates for design change
Although the top words and their linked words along with the sentiment in which they are mentioned can be extracted as described in the previous stage, it is unlikely that all top words and linked words are directly linked to product components (e.g., top words such as “issue”, “good”, and “really”). Hence, in this stage, the top words extracted are placed in a word collection to be checked against a product component list. In anticipation of components with names that have more than one word (e.g., “wiring harness”), each pairing of top word and linked word are also combined and permutated, with each permutation added to the word collection. Product components that appear in the word collection are classified as likely to be changed if the net sentiment classification of the matching top word (or top word and linked word permutation) is negative. The assumption is that components that are frequently mentioned and discussed in a negative sentiment are suitable candidates for improvement through design change. These components are referred to as change candidates in this paper.
While it is possible to start off the mining of product information using pre-defined keywords (Lim and Tucker, Reference Lim and Tucker2016), where the keywords are component names of the product of interest, it is necessary to go through the process presented thus far as a product can be described at different levels of granularity (Maier et al., Reference Maier, Eckert and Clarkson2017) making it hard to anticipate the granularity used in social media comments. Given that the “correct” granularity level is fixed at the time the comments were made, an approach to get around the granularity issue is to use component lists of different granularity levels to be checked against. The component lists can be elicited from domain experts, extracted directly from company Product Data Management systems (Koh et al., Reference Koh, Forg, Kreimeyer and Lienkamp2015), or created using textual technical descriptions in textbooks (Kang and Tucker, Reference Kang and Tucker2016) and technology semantic networks such as TechNet (Sarica et al., Reference Sarica, Luo and Wood2020). However, in this work, the component lists are assumed to be directly available through company Product Data Management systems. The pseudo-code for creating a word collection and checking against component lists is shown in Algorithm 2.

Creating a product model and running change propagation analysis
This stage consists of two steps. The first step is to create a product model that considers both direct and indirect change propagation. The second step aligns the product model created with the change candidates identified in the section “Identifying candidates for design change” for design change prediction.
Creating a product model that considers direct and indirect change propagation
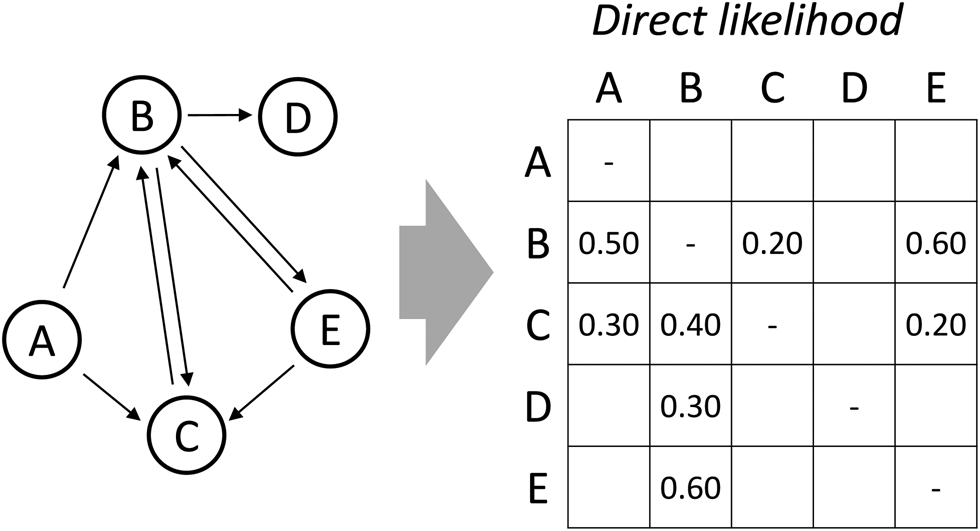
While there is no easy way to determine what the finest granularity level should be for a given product (Maier et al., Reference Maier, Eckert and Clarkson2017), the aim here is to create a product model that is as fine-grained as possible so that it can act as a baseline and is flexible to be adjusted to a coarser granularity when required. In this work, the product model is presented in the form of a design structure matrix (DSM) (Eppinger and Browning, Reference Eppinger and Browning2012) where the components are listed as column and row headers (see Fig. 2). The off-diagonal cells of the matrix indicate the direct change propagation likelihood between components and follow the convention where the column components affect the row components. The cell entries can be elicited from domain experts and range between 0 (will not propagate) and 1 (will propagate) (Clarkson et al., Reference Clarkson, Simons and Eckert2004). Other approaches, such as the use of past change records (Suh et al., Reference Suh, de Weck and Chang2007) and the use of textual mining techniques on domain texts (Kang and Tucker, Reference Kang and Tucker2016; Sarica et al., Reference Sarica, Luo and Wood2020), can also be adapted here to populate the cells. Cells with a 0 value are left blank for simplicity. For instance, with reference to the example in Figure 2, there is a 0.5 likelihood that changing Component A will result in direct change propagation to Component B (i.e., Column A, Row B) while changing Component B will have 0 likelihood of affecting Component A (i.e., Column B, Row A, shown as a blank entry).
An example of a product model in a DSM (DSM shown on right).

Indirect change propagation between product components is accounted for in this work through the CPM algorithm presented by Clarkson et al. (Reference Clarkson, Simons and Eckert2004). The CPM considers change propagation along three dimensions – likelihood, impact, and risk. However, instead of reproducing the CPM in its entirety, this paper focuses on the likelihood of change propagation as described in Eqs (1)–(3). Note that the reachability of change propagation is also included in this paper to account for finite change propagation resources (Koh et al., Reference Koh, Caldwell and Clarkson2013).
 $$L_{k, j} = 1-\mathop \prod \limits_{z\in Z} [ {1-( {l_z \times \alpha_z} ) } ], $$
 $$l_z = ( {l_{k, k-1} \times l_{k-1, k-2} \times \cdots \times l_{\,j + 1, j}} ), $$
 $$\alpha _z = ( {\alpha_{k, k-1} \times \alpha_{k-1, k-2} \times \cdots \times \alpha_{\,j + 1, j}} ), $$
where L k,j represents the combined (direct and indirect) change propagation likelihood from component j to k; l z and α z represent the change propagation likelihood and reachability for a particular path z, respectively; Z represents the entire set of change propagation paths from component j to k.
As pointed out by Clarkson et al. (Reference Clarkson, Simons and Eckert2004), Giffin et al. (Reference Giffin, de Weck, Buonova, Keller, Eckert and Clarkson2009), and Duran-Novoa et al. (Reference Duran-Novoa, Weigl, Henz and Koh2018), design changes rarely propagate beyond four steps. Hence, in this work, the change propagation reachability between successive components is set as 1 for the first propagation step (i.e., α j+1,j) and 0.3 for the second step onwards (e.g., α k,k−1) to bring the likelihood of five-step change propagation down to less than 0.01 (i.e., 1 × 0.34 < 0.01). In doing so, the likelihood of indirect change propagation paths is reduced and paths with more steps have less influence. Note that the first propagation step was assigned a reachability of 1 to ensure that the combined change likelihood computed does not fall below the direct change likelihood used in the computation. Equation (3) can therefore be rewritten as Eq. (4), where α F refers to the reachability factor (α F = 0.3 in this work) and n refers to the number of change propagation steps in a particular path z.
 $$\alpha _z = \alpha _F^{n-1} .$$
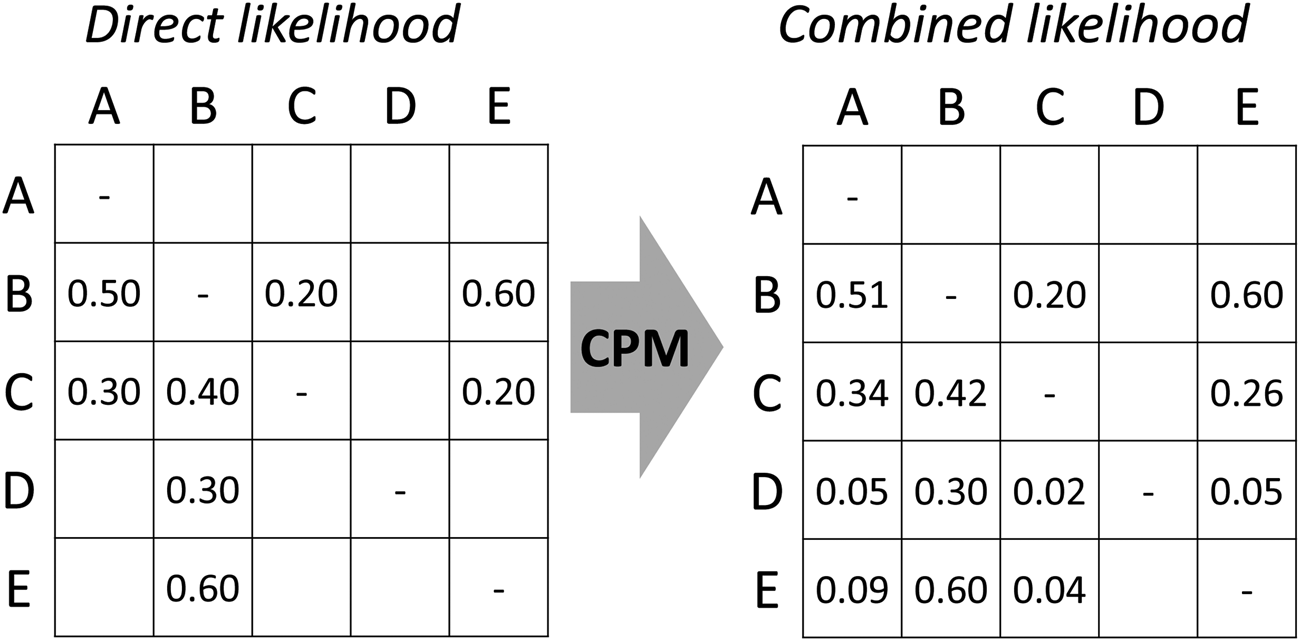
Through the use of Eqs (1)–(4), the product model shown in Figure 2 can be updated to consider indirect change propagation as shown in Figure 3. For instance, Component E in Figure 3 is not directly linked to Component D and the likelihood of direct change propagation is 0 (left DSM, Column E, Row D, shown as a blank entry). By considering indirect change propagation via Component B, the combined (direct and indirect) change propagation likelihood is updated to 0.05 (i.e., right DSM, Column E, Row D, 1 − [1 − ((0.60 × 0.30) × 0.32−1)] = 0.05).
Updating the product model using the change prediction method (CPM).

Although a standalone version of the CPM is available (Keller, Reference Keller2007), a Python implementation of the CPM is used in this work to align the data structure. In the first instance, the product model with direct change propagation likelihood is stored as a comma-separated values (.csv) file for easy processing. The computation of combined change propagation likelihood is later carried out according to Eqs (1)–(4) using the NetworkX Python library (https://networkx.org/). Essentially, the NetworkX “from_numpy_array” function is used to convert the product model (.csv file) into a digraph where each direct change propagation likelihood value is mapped as the “weight” of the corresponding directed edge. Subsequently, by going through each row and column in the product model, all paths between any two components are identified through the “all_simple_paths” function. Next, by using Eqs (1)–(4) to process the “weight” of the directed edges connecting the paths found, the combined change propagation likelihood between each component pair is computed and the product model is updated to be used in the next stage. The pseudo-code for the product model is shown in Algorithm 3.

Aligning the product model and change candidates to predict design change
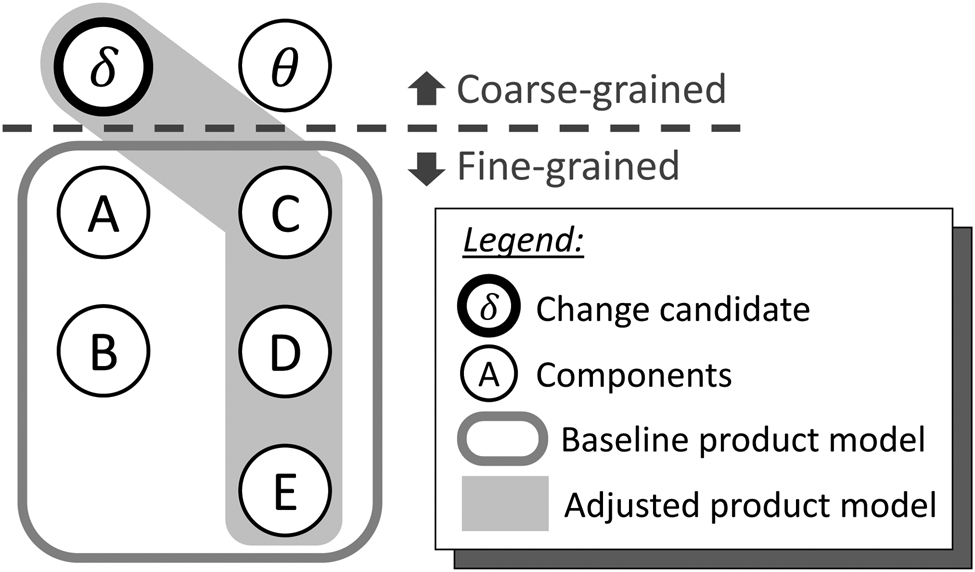
While the product model created in the previous step is intentionally as fine-grained as possible, the change candidates identified in the section “Identifying candidates for design change” can be of different granularity levels. Adjustment to the product model is therefore necessary if its components do not match the change candidates. An example where an adjustment is necessary is illustrated in Figure 4, which shows a product described by two sets of components with different granularity levels – a coarse-grained set with two components (i.e., Component δ and θ) and a fine-grained set with five components (i.e., Components A to E). Component δ is made up of Component A and B while Component θ is made up of Component C to E. Such mapping between components of different granularity is assumed to be available in this work (e.g., through Product Data Management systems) and accessible in the format shown in Figure 4, where the entity in the first row of each column is a coarse-grained component and the entities in the subsequent rows of each column are the constituent fine-grained components. In fact, the component lists with different granularity (P) described earlier in Algorithm 2 are basically derived from the first row of each mapping. For ease of computation, the fine-grained components in each mapping are standardized by using the same set of components in the product model described in the section “Creating a product model that considers direct and indirect change propagation” and each mapping is stored as a comma-separated values (.csv) file for processing.
Adjusting the model granularity to align with change candidates.

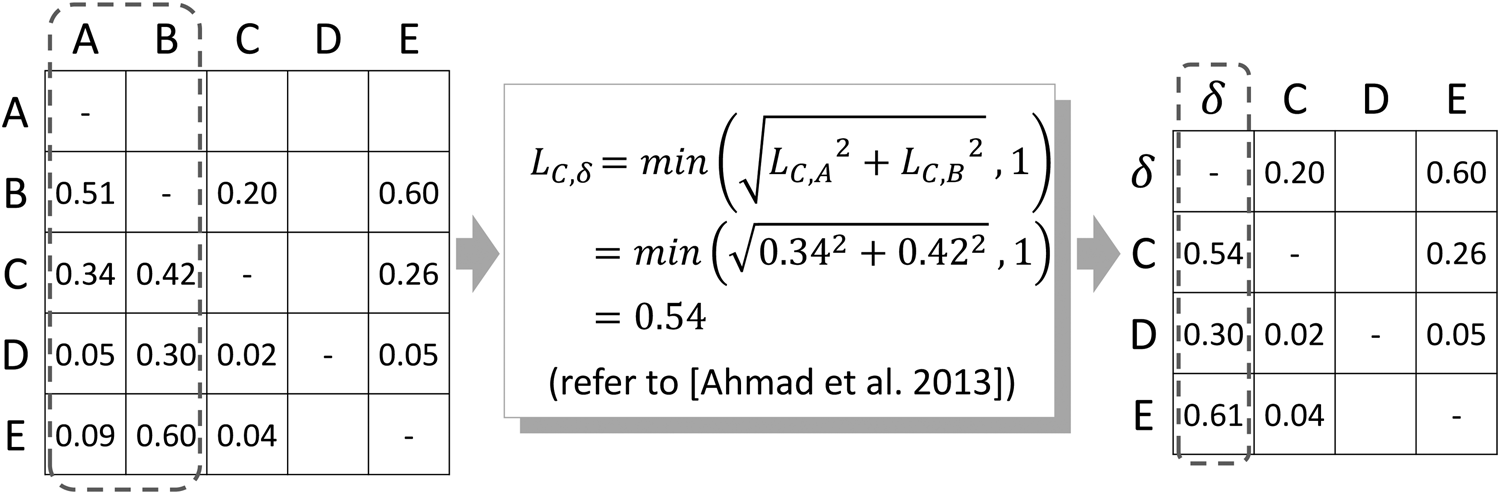
Given that the change candidate is Component δ (a coarse-grained component) in the example shown in Figure 4, the product model which consists of Component A to E (i.e., fine-grained components) needs to be adjusted in order to predict change propagation arising from the change candidate. The adjustment is carried out in this work based on a component merging technique (Ahmad et al., Reference Ahmad, Wynn and Clarkson2013) where the change propagation likelihood of a coarse-grained component is estimated as the root sum of squares of its fine-grained components. By using this merging technique, the change propagation likelihood of the coarse-grained component will be no lower than the individual likelihood values of its fine-grained counterparts and will fall within the 0 to 1 value range. In this paper, the technique is expressed as an equation as follows:
 $$L_{k, x} = {\rm min}\left({\sqrt {\mathop \sum \limits_{y\in Y} L_{k, y}^2 } \;, \;\;1} \right),$$
where L k,x represents the combined (direct and indirect) change propagation likelihood from a coarse-grained component x to component k; L k,y represents the combined change propagation likelihood from a particular fine-grained component y to component k; Y represents the entire set of fine-grained components that make up component x.
An example calculation of an adjustment is shown in Figure 5 where the change propagation likelihood from Component δ to Component C (L C,δ) is estimated as the root sum of squares of its fine-grained counterparts – from Component A to C (L C,A) and from Component B to C (L C,B). By repeating the technique described for all affected cells, the entire column of Component δ (i.e., the change candidate) is adjusted as shown. For instance, changing Component δ can result in change propagation to Components C, D, and E through direct and indirect paths with a likelihood of 0.54, 0.30, and 0.61, respectively. For completeness, the technique is also applied to the row of Component δ to keep the adjusted product model in a square matrix form. With the assumption that there are limited resources to prevent or prepare for the change propagation predicted, a minimum likelihood threshold can subsequently be introduced to remove components less likely to be affected by change propagation. For example, the results will be narrowed down to Components C and E if a minimum likelihood threshold of 0.50 is applied. The pseudo-code for aligning the product model with the change candidate is shown in Algorithm 4.

An example calculation for the adjusted product model.

Case example
A case example involving a heavy-duty diesel engine is presented in this section to demonstrate the feasibility of using the proposed method on an existing product. The actual process was automated. However, the intermediate results are broken down into two parts in this section to provide details. The first part describes the data collection of online comments from the YouTube platform and the identification of change candidates using the method (see Section “From online reviews to change candidates”). The second part describes the product model of the heavy-duty diesel engine used in this work and the prediction of change propagation arising from the change candidates (see Section “From change candidates to change propagation prediction”). A discussion on the generalizability of the proposed method on other products is provided in the section “Generalizability of the proposed method”.
From online reviews to change candidates
Search words in the format of “brand/company product model” were used in this case example. The “product” in this case was an “engine”. For confidentiality reasons, the “brand/company” of the engine is coded as “BX” in this paper. Three sets of “model” were used in the search. The first model was “truck”, which is a generic description of the model type. The second and third models have unique names and are coded as “M1” and “M2” in this paper. The maximum number of YouTube videos to be found by each set of search words was limited to the top 20 results to filter out videos that were less relevant.
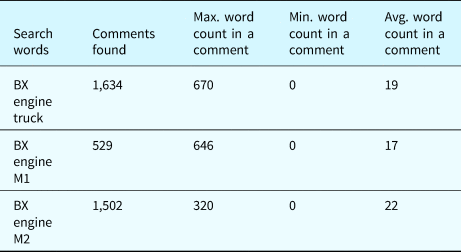
Based on the data collected on 19 March 2021, 1634 comments were captured for the search words “BX engine truck”, 529 comments were captured for the search words “BX engine M1”, and 1502 comments were captured for the search words “BX engine M2”. The comments found were subsequently preprocessed according to the proposed method and a summary of the data is shown in Table 1. The entire set of comments used is available on https://github.com/NLPT/P1data. It can be seen that the number of comments found was highly dependent on the search words used. For instance, there were approximately 3 times more comments on videos associated with “M2” compared to “M1”. The number of words found in each comment can differ as well with some having as many as 670 words in a single comment while others were left with no words after preprocessing. The average number of words per comment was found to be between 17 and 22 from the data collected.
A summary of the data collected

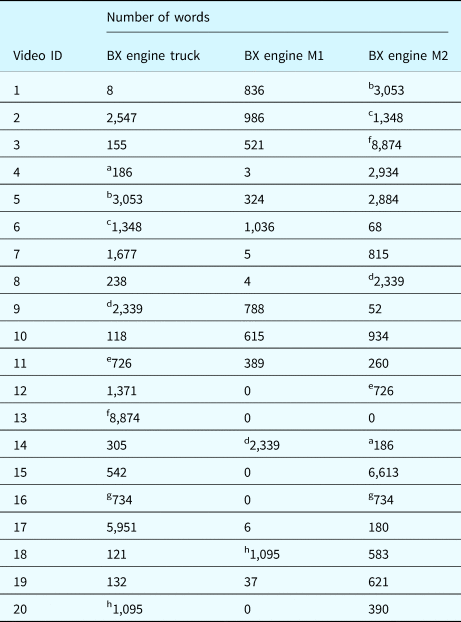
Table 2 shows a breakdown on the number of words analyzed for each video. The maximum number of words analyzed for a video was 8874 and the minimum was 0 (i.e., either no comment found or was left with no word after preprocessing). Note that some results were identical as they were derived from the same video. For instance, Video 20 of search words “BX engine truck” was the same video as Video 18 of search words “BX engine M1”. Hence, for clarity, results derived from the same video are labeled with a superscript in Table 2. In total, one video was identical across the three sets of search words, two videos were identical between “BX engine truck” and “BX engine M1”, and seven videos were identical between “BX engine truck” and “BX engine M2”.
A summary on the number of words analyzed for each video

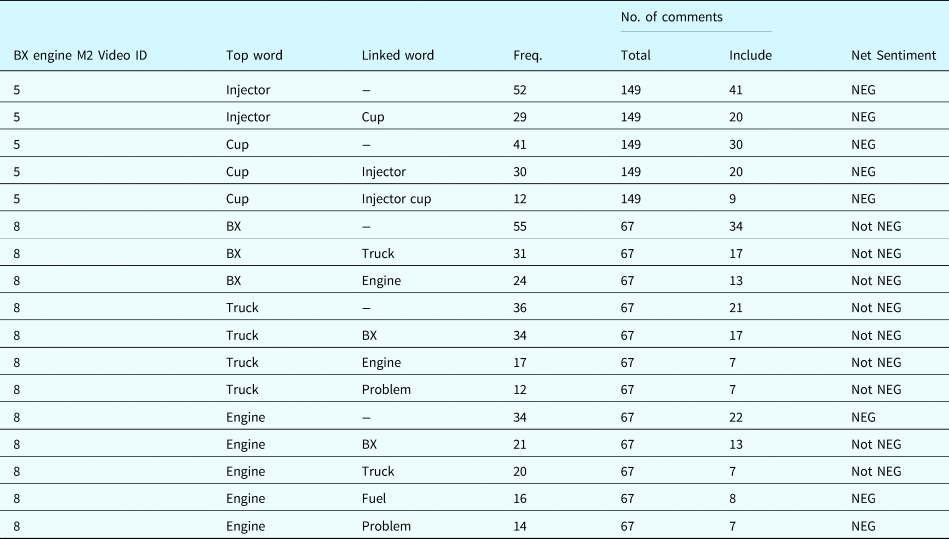
The top words and linked words associated with each set of search words were subsequently identified and a snippet of the results derived from Video 5 and 8 for “BX engine M2” is shown in Table 3. A threshold frequency of more than 30 occurrences was applied in the identification of top words. In addition, only words that appeared more than 25% of their top word occurrences would satisfy the threshold frequency as linked words. (A discussion on threshold frequency is provided in the section “Setting threshold frequency for top words and linked words”.) For instance, the top words found for Video 5 were “injector” and “cup”. “injector” appeared 52 times while “cup” appeared 41 times from the 149 comments collected from Video 5. The number of comments that included the top words were lower than the number of times the top words occurred as each top word can be mentioned more than once in a comment. For instance, the word “injector” only appeared in 41 comments but was mentioned 52 times. Sentiment analysis was later carried out on these 41 comments and the net sentiment was found to be “NEG” (i.e., negative). This implies that, out of the 41 comments, more comments were found to be negative than positive.
A summary of top/linked words and the sentiment associated with those words

The word “cup” was found to be a linked word of “injector” and was mentioned 29 times in 20 comments that contained the word “injector”. Indeed, the word “injector” was also found to be a linked word of “cup”, suggesting that the two words were often discussed together. In addition, “injector cup” was mentioned 12 times in 9 comments as well, suggesting that some comments on “cup” and “injector” were referring to the “injector cup”. The uncovering of “injector” (i.e., a component) and “injector cup” (i.e., a part of a component) highlights the potential of mining n-grams (i.e., consecutive words) to expose areas of concern at different levels of granularity.
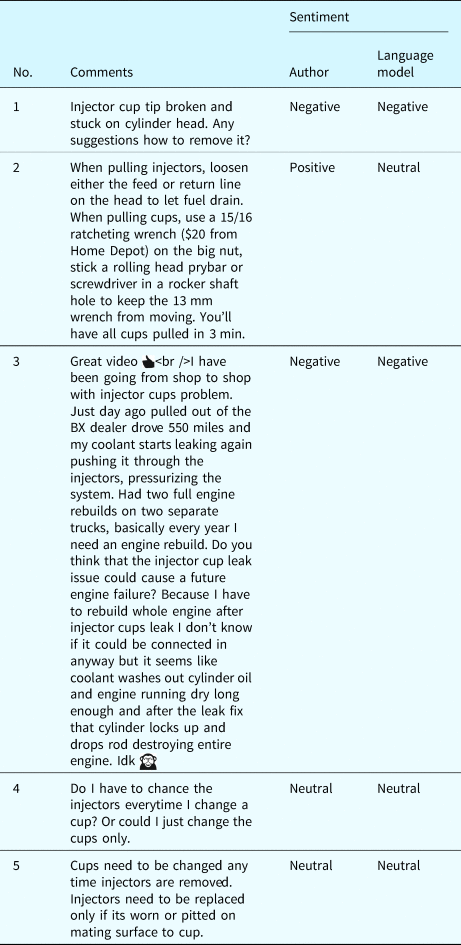
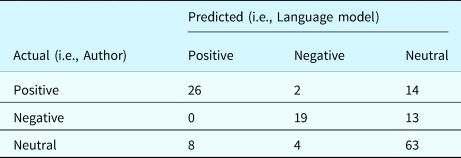
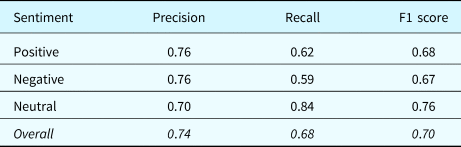
Table 4 shows five comments containing the word “injector” and “cup” extracted from Video 5. Comment 1 focuses on the injector cup, Comment 2 treats the injector and the cup as two separate entities, Comment 3 mentions the injector cup alongside with the injector (the company was coded as “BX” in the comment), Comment 4 is a question on the injector and cup with Comment 5 as one of the replies. The sentiment of these comments was assessed independently by the author (i.e., ground truth) and listed next to those classified by the RoBERTa-base language model (Liu et al., Reference Liu, Ott, Goyal, Du, Joshi, Chen, Levy, Lewis, Zettlemoyer and Stoyanov2019; Barbieri et al., Reference Barbieri, Camacho-Collados, Neves and Espinosa-Anke2020) in Table 4. It can be seen that the sentiment classification produced by the language model is not always aligned with the author's (e.g., Comment 2). Hence, in an effort to examine the extent of classification error, all 149 comments from Video 5 were labeled independently by the author and subsequently compared with the classification results produced by the RoBERTa-base language model used in this work (see Table 5). The precision, recall, and F1 score of the results were also calculated to support comparison (see Table 6). Precision refers to the number of correct classifications (e.g., true positive) out of all the entities predicted for that class (i.e., true positive and false positive). Recall refers to the number of correct classifications (e.g., true positive) out of all the entities that are actually in that class (i.e., actual positive). F1 score refers to the harmonic mean of precision and recall (equations can be found in Tuarob et al. (Reference Tuarob, Lim, Conrad and Tucker2018)). It was found that the overall precision, recall, and F1 score for the 149 comments analyzed were 0.74, 0.68, and 0.70, respectively. As pointed out in the introduction, this paper focuses on the integration of a pre-trained language model for social media sentiment analysis instead of the fine-tuning of it. Hence, the precision, recall, and F1 score reported here only serve as an indication of the classification error when using the RoBERTa-base language model in this work. As a comparison, a similar overall recall of 0.726 was reported in Barbieri et al. (Reference Barbieri, Camacho-Collados, Neves and Espinosa-Anke2020) where the same RoBERTa-base language model was applied on a different set of text (precision and F1 score not reported).
Comments with “injector” and “cup” in Video 5 and their sentiment scores

Confusion matrix for comments in Video 5

Precision, recall, and F1 scores for the comments analyzed

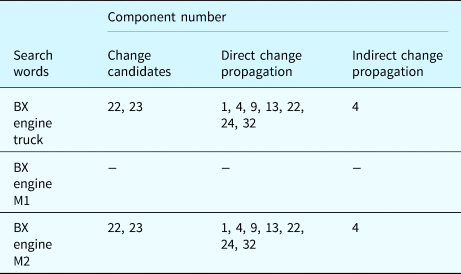
Table 7 shows a summary on the word collections created and change candidates found for each set of search words. It can be seen that 34 top words and 125 linked words were identified from videos found under “BX engine M2”, which was the highest across the search words used. These top words and their linked words, together with the permutations between them, resulted in 284 word collection entries, with 198 of the entries having a negative sentiment. The entries in the word collection were subsequently checked against a component list provided by the company that produces the engine (company coded as “BX” in this paper) and 2 components were identified as change candidates out of a set of 32 components named in the component list. The change candidates identified were the “injector” and the “fuel pump”. Both components were also identified as change candidates when the analysis was carried out under search words “BX engine truck”. However, no change candidate was identified under “BX engine M1”.
A summary of word collections and change candidates for different search words

From change candidates to change propagation prediction
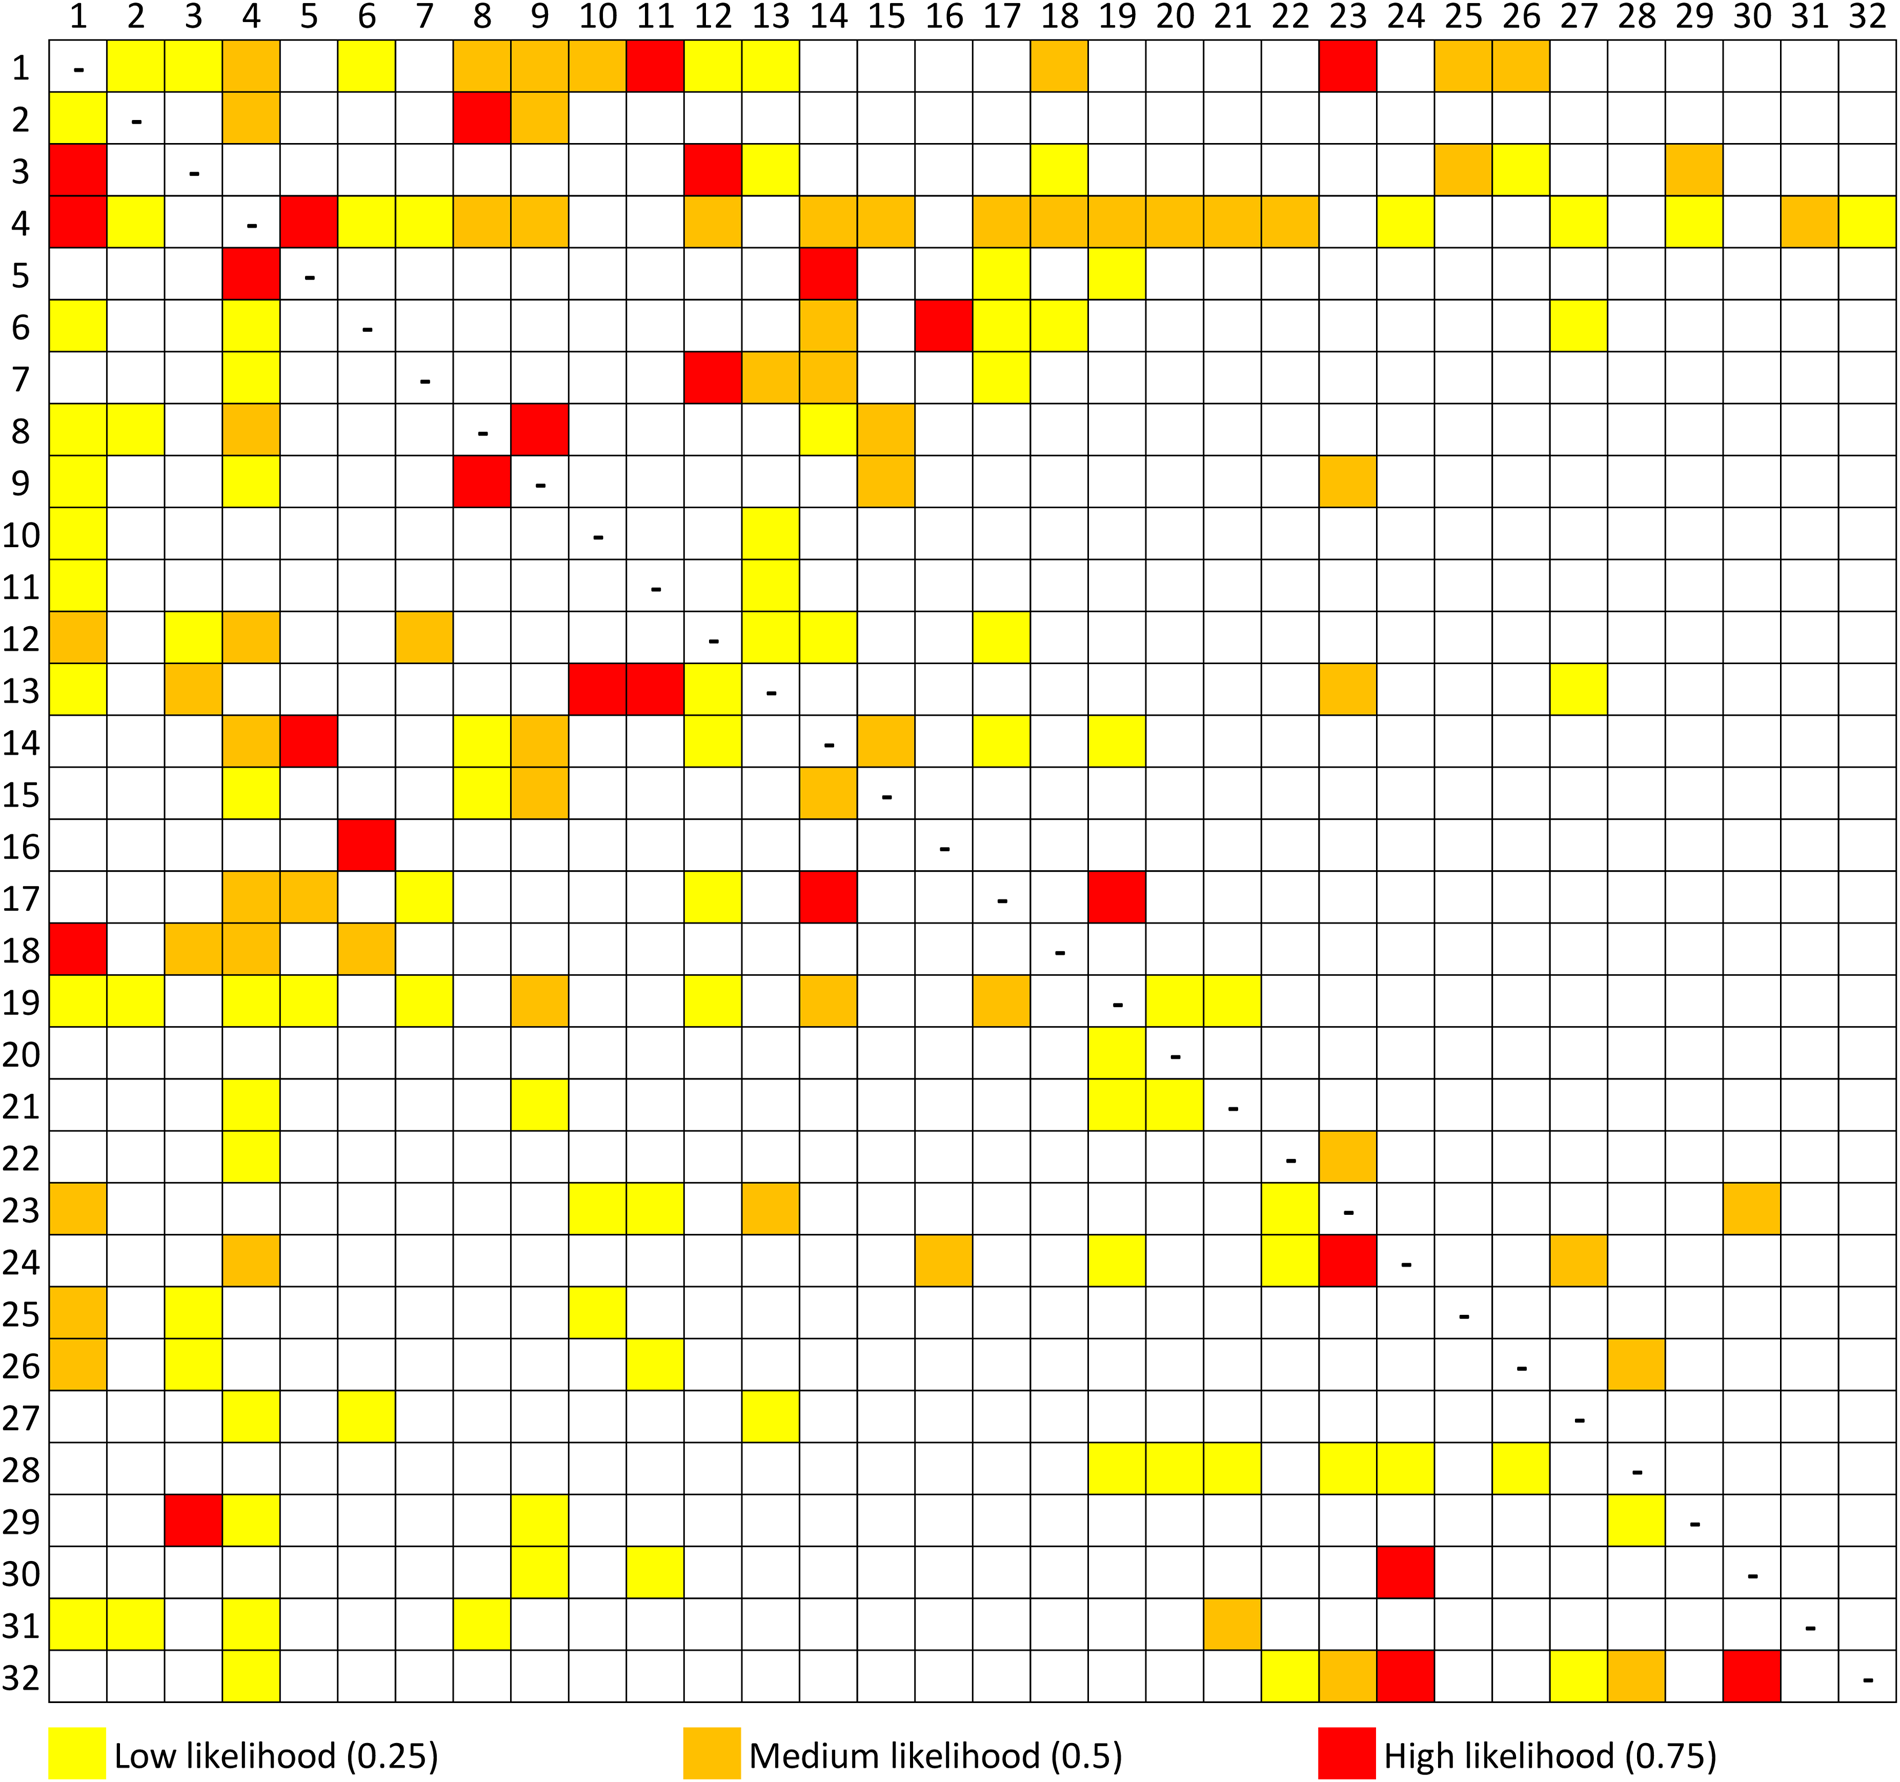
A product model of the heavy-duty diesel engine was analyzed in this part of the case example to predict how changes can propagate if the change candidates are changed. Similar to the component list, the product model used in this work was provided by the company that produces the engine (company coded as “BX” in this paper) and is shown in Figure 6 with the component names replaced with component numbers. As an indicator, the components in the model include the “cylinder block”, “piston”, “crank shaft”, “engine anchorage”, and “oil pump”. The “fuel pump” and “injector” (i.e., change candidates) were also in the model and are labeled as Components 22 and 23, respectively. The cell entries in Figure 6 are direct change propagation likelihood between components and are color coded for ease of visualization. Yellow cells represent entries with low change propagation likelihood and an assigned value of 0.25. Orange cells represent entries with medium change propagation likelihood and an assigned value of 0.50. Lastly, red cells represent entries with high change propagation likelihood and an assigned value of 0.75. The product model was subsequently processed as described in the proposed method and was updated with combined change propagation likelihood. Adjustment to the model granularity was not required in this case example as only one component list was used.
Direct change propagation likelihood between engine components.

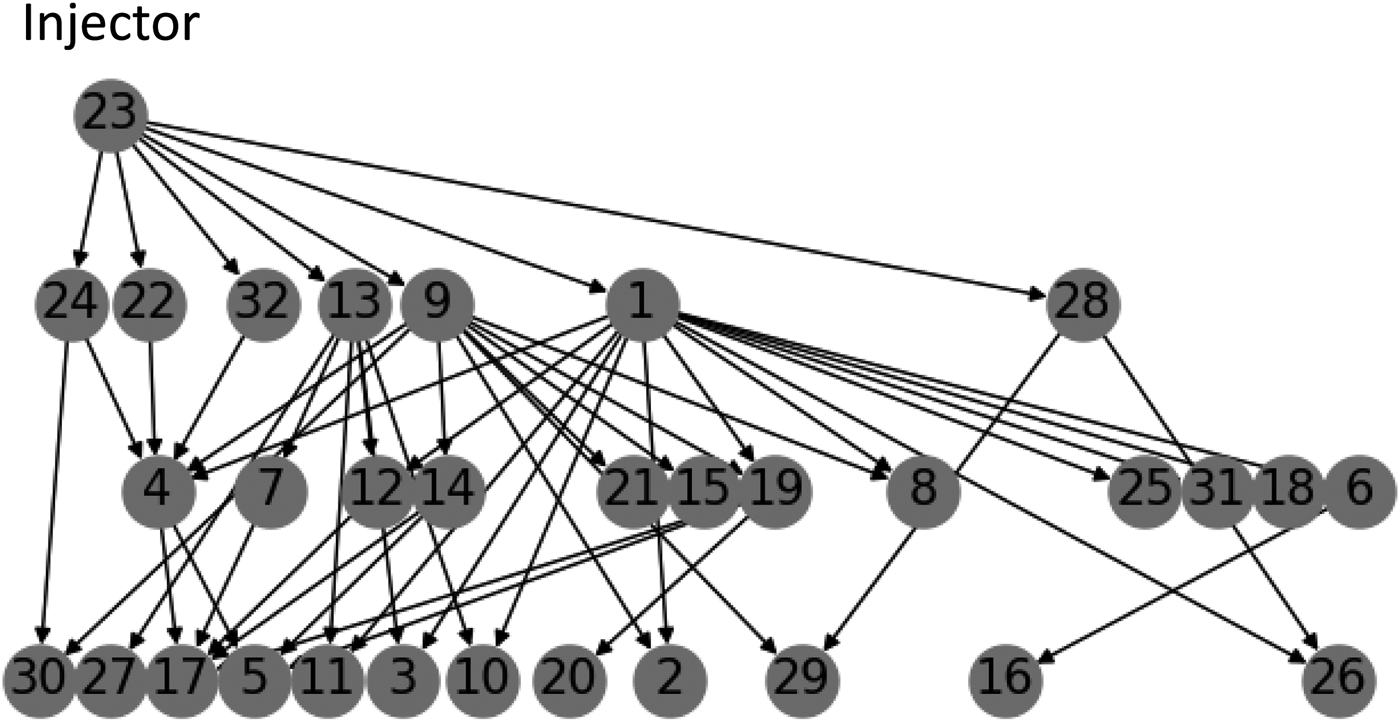
Table 8 shows a summary of the combined change propagation likelihood from the “injector” (i.e., a change candidate) to all engine components. It can be seen that all components can be affected by change propagation if the “injector” was changed (Component 23 is the “injector”). A likelihood threshold of 0.5 was later applied to identify components that were more likely to be affected and Components 1, 4, 9, 13, 22, 24, and 32 were found to be above the likelihood threshold (see Tables 8 and 9, entries in bold). This information can subsequently be used to better prepare for design changes. For instance, Figure 7 shows a change propagation tree with the “injector” as the point of change initiation and the other components plotted according to their shortest path from the “injector”. If the “injector” is to be changed, efforts should be made to prevent change propagation to Components 1, 4, 9, 13, 22, 24, and 32 as they were predicted as more likely to be affected. This is especially true for Components 1, 9, 22, 24, and 32 as they have direct linkages with the “injector” and changing any of these components can open up an indirect change propagation path for Component 4 to be affected.
Change propagation tree of “injector”.

Combined change propagation likelihood from the “injector” to other components

Combined change propagation likelihood from the “fuel pump” to other components

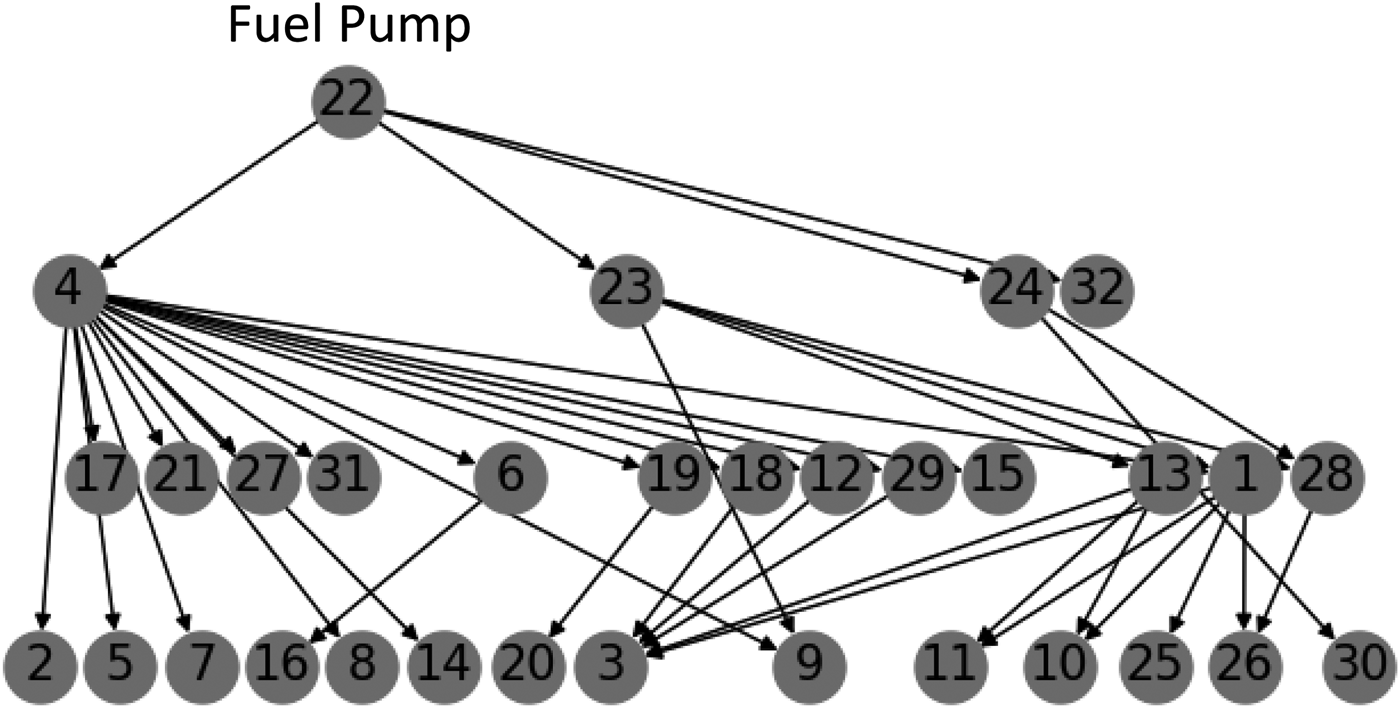
The combined change propagation likelihood from the “fuel pump” to all engine components is summarized in Table 9. Similar to the “injector”, all components can be affected by change propagation if the “fuel pump” was changed (Component 22 is the “fuel pump”). However, only Component 4 was found to have a combined change propagation likelihood above the 0.5 likelihood threshold. By referring to the change propagation tree shown in Figure 8, it can be seen that Component 4 is directly linked to the “fuel pump” and is also directly linked to 17 downstream components. Hence, even though the combined change propagation likelihood for other components were below the likelihood threshold, changing Component 4 can open up a gateway for changes to propagate further. Effort should, therefore, be made to prevent changes on Component 4.
Change propagation tree of “fuel pump”.

In summary, by using the proposed method, a query on “BX engine M1” did not return any change candidate but queries on “BX engine truck” and “BX engine M2” identified the same set of change candidates (i.e., “injector” and “fuel pump”). Both queries also uncovered additional engine components that may be affected through change propagation (see Table 10). Note that Component 4 is listed twice under “BX engine truck” and “BX engine M2” as it can be affected through direct change propagation from Component 22 and indirect change propagation from Component 23.
A summary of change prediction results

Discussions
The proposed method shows promise as demonstrated in the case example. Nevertheless, limitations were observed and are discussed here along with the assumptions made in this work.
Setting threshold frequency for top words and linked words
The threshold frequency to be used is influenced by a number of factors. Unlike traditional means of complaining through telephones and letters where companies can decide when and whether to respond, negative online comments through social media are visible to the public and need to be addressed swiftly (Laufer and Coombs, Reference Laufer and Coombs2006; Einwiller and Steilen, Reference Einwiller and Steilen2015; Grégoire et al., Reference Grégoire, Salle and Tripp2015; Javornik et al., Reference Javornik, Filieri and Gumann2020). From this perspective, the threshold frequency for top words and linked words should be set as low as possible to capture any mention of product components that are negative in sentiment. However, due to limited design resources and the need to prioritize change (Koh et al., Reference Koh, Forg, Kreimeyer and Lienkamp2015), the threshold frequency should be open to adjustments to identify change candidates that are mentioned more frequently. Indeed, it is important to point out that the threshold frequency is directly influenced by the data at hand. For instance, in the case example presented, the number of words analyzed in each YouTube video varied from 0 to 8874 words. Hence, having a fixed threshold frequency across unrelated studies can be impractical.
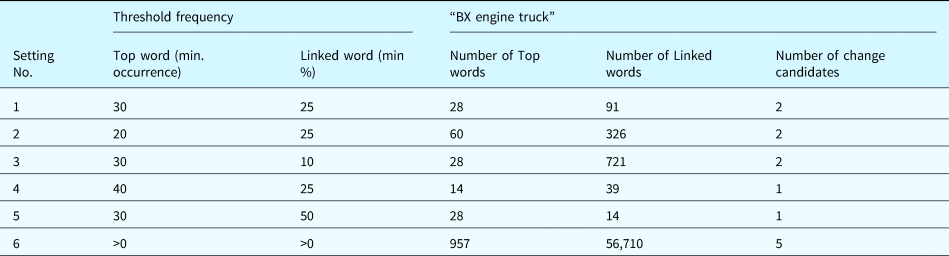
In this work, the minimum threshold frequency used for identifying top words was arbitrarily set as 30 occurrences and the threshold frequency for linked words was set as 25% of their top word occurrences. The setting is represented as Setting 1 in Table 11 and it identified two change candidates, namely the “fuel pump” and “injector”, for search words “BX engine truck”. Based on the proposed method, “fuel pump” was identified as a change candidate as both the words “fuel” and “pump” satisfied the minimum threshold frequency and their associated comments were negative. Indeed, the highest frequency for “fuel” was found to be 36 occurrences (i.e., more than 30) in Video 13 and “pump” was identified as a linked word for “fuel” as it appeared 14 times in the same comments where “fuel” was mentioned (i.e., 14 out of 36 occurrences = 39%, more than 25%). Hence, “fuel pump” would still be identified as a change candidate if the minimum threshold frequency for top words and linked words was set lower as shown in Setting 2 and 3, respectively. The number of change candidates found did not increase for both settings even though more top words and linked words were identified with the lowered threshold. In contrast, “fuel” would not be identified as a top word if the threshold frequency for top words was increased to 40 occurrences as shown in Setting 4. “pump” would also cease to be a linked word of “fuel” if the threshold frequency for linked words was increased from 25% to 50% in Setting 5. Hence, “fuel pump” would not be identified as a change candidate if Setting 4 and 5 were used. On the other hand, “injector” which has 47 occurrences in Video 13 would still be identified in Setting 4 and 5.
Influence of top word and linked word threshold frequency on case example results

While Setting 2 to 5 demonstrate how the case example results can differ if minor adjustments were made to the threshold frequency, Setting 6 represents the scenario where the threshold frequency was set as low as possible to include all words that were mentioned at least once (i.e., >0) with negative sentiment. Based on Setting 6, 957 top words and 56,710 linked words were found and five change candidates were eventually identified, namely the “fuel pump”, “injector”, “oil filter”, “oil pump”, and “timing gear”. This demonstrates that a maximum of five change candidates can be uncovered from the case example data and the threshold frequencies used in the case example could have been adjusted lower to identify more change candidates, if needed. Note that this work uses threshold frequencies instead of defining the maximum number of change candidates to be found so as to maintain a consistent frequency threshold within the same study (i.e., consistent threshold for data collected through search words “BX engine truck”, “BX engine M1”, and “BX engine M2”).
Generalizability of the proposed method
In this study, the proposed method was applied on three other products from different domains to explore the generalizability of this work. The three products were a vacuum cleaner (a small domestic appliance), a washing machine (a large domestic appliance), and a car (a complex machine). The search words used were “Dyson Vacuum Cleaner V10”, “Samsung Washing Machine QuickDrive”, and “Mercedes Benz E200”, respectively. As the official component lists of these products were not available in this study, the evaluation in this section was carried out by manually identifying top words and permutations of top and linked words (i.e., word collection entries) that resemble component names for each product. A summary of the findings is presented in Table 12.
Exploratory results on different products

It can be seen that the number of top words and linked words identified varies between the products analyzed. In addition, having more top words and linked words do not necessarily result in more word collection entries that resemble component names. In the case of the vacuum cleaner, the word collection entries that resemble component names were “battery”, “filter”, “bin”, “cleaning head”, and “roller brush”. For the washing machine, the word collection entry identified was “washer dryer”. For the car, the word collection entries identified were “steering wheel”, “fake exhaust”, “airbags”, “front”, “rear”, “interior”, and “exterior” (the latter four are valid component references in the body-in-white stage). The findings suggest that the proposed method can be applied beyond the design of diesel engines presented in the case example, although success can vary between products based on their online presence. Future work should further evaluate the proposed method by using a diverse pool of online data across different product domains.
Conclusion
This paper presents a method that builds on a RoBERTa-based language model to identify new ideas from large volume social media data and uses the CPM as a basis to uncover the change impact associated with the new ideas. The work is positioned in the context of incremental design and the goal of the method is to enable early prediction of change impact on the product architecture to aid decision quality in product planning. A case example involving a heavy-duty diesel engine was carried out to demonstrate the feasibility of the proposed method and the results produced were promising. Based on three sets of search words, the method retrieved and processed 3665 YouTube comments and identified two unique candidates for design change, with six other product components predicted as likely to be affected through change propagation.
From an academic perspective, the work contributes toward connecting two fields of study that are usually considered in isolation through the provision of a set of algorithms that integrate the use of natural language processing in customer sentiment analysis with the use of dependency modeling in change prediction. The work can be used as a starting point or a construct for other research in product planning and design change management to build upon.
From an industry perspective, the proposed method and the outcome of the analysis can empower practitioners such as the product planning function within a company to ask more advanced questions. For instance, instead of asking “Which part of the product should we change to address negative sentiment found on social media?” and “Which product components can be affected by the change?” the output of the method enables users to further query “Which teams are responsible in implementing the change?” and “What are the resources required to carry out the change?” The exploratory analysis to apply the method across different product domains such as domestic appliances and a complex machine also yielded favorable results, suggesting that the method can be applied beyond the design of diesel engines and serve companies in other product domains. Nevertheless, the author acknowledge that more work needs to be done to further evaluate the proposed method across a wider range of products.
Dr. Edwin C.Y. Koh is Senior Lecturer & Associate Program Head (Design and Artificial Intelligence) at the Singapore University of Technology and Design (SUTD). He serves on the review committee of the United States National Academy of Engineering (NAE) Grand Challenges Scholars Program (GCSP) and has held full-time and visiting positions at the National University of Singapore and New York University. Edwin received his B.Eng. in Mechanical Engineering and S.M. in Manufacturing from the Nanyang Technological University. He attended the Massachusetts Institute of Technology as part of his master's studies and holds a Ph.D. in Engineering Design from the University of Cambridge.