1 Introduction
Individuals and their families are increasingly taking on responsibility for securing their own financial well-being in retirement in the US and around the world. Prior to the 1980s, many US workers relied mainly on Social Security and employer-sponsored defined benefit (DB) pension plans. Today, by contrast, Baby Boomers are increasingly turning to defined contribution (DC) plans and Individual Retirement Accounts (IRAs) to help finance their golden years. Indeed, in 1980, about 40% of private-sector pension contributions went to DC plans; 20 years later, almost 90% of such contributions went to personal accounts (mostly 401(k) plans; Poterba et al., Reference Poterba, Venti, Wise and Lusardi2008). The transition to the DC retirement saving model has the advantage of permitting more worker flexibility and labor mobility than in the past, yet it also imposes on employees a greater responsibility to save, invest, and decumulate their retirement wealth sensibly. Furthermore, the spread of DC plans means that workers today are directly and immediately exposed to financial market risks, a reality that was less evident in the old DB system. And, as many DB plans have been frozen or terminated, the individually managed accounts will increasingly become the mainstay of retirement.
For this reason, individuals will increasingly be called to ‘roll their own’ retirement saving and decumulation plans, and their retirement security will depend ever more on their own decisions and behavior. This paper investigates the extent to which Americans are equipped to make decisions in this new pension and financial landscape and, in particular, whether they are sufficiently knowledgeable about economics and finance to plan for retirement. Our goal is to focus on financial literacy, by which we mean knowledge of fundamental financial concepts and the ability to do simple financial calculations. The analysis is facilitated by a new US dataset of 1,488 American adults collected as part of the National Financial Capability Study (described in more detail below).Footnote 1
We show that a large majority of Americans fail to understand critical financial concepts, including interest compounding, inflation, and risk diversification, and lack of knowledge is most acute for less-educated, female, and older individuals. Moreover, many people have failed to plan for retirement, even when this life event looms only 5–10 years off. This is critical since, as we have shown elsewhere, lack of retirement planning translates into low levels of retirement wealth accumulation (Lusardi and Mitchell, Reference Lusardi and Mitchell2007a, Reference Lusardi and Mitchell2008a, Reference Lusardi and Mitchell2009, Reference Lusardi, Mitchell, Lusardi and Mitchell2011). As the National Commission on Fiscal Responsibility and Reform (2010: p. 53) recently argued, it is key to provide ‘better information to the public on the full implications of various retirement decisions, with an eye toward encouraging delayed retirement and enhanced levels of retirement savings’. Yet if people are unable to make sense of this information when provided, the messages may fall on deaf ears.Footnote 2
In what follows, we first offer an overview of the new dataset used in the analysis. We then describe the key questions on financial literacy and retirement planning and provide a multivariate analysis linking these two variables. A final section concludes.
2 Data overview and summary statistics
In 2009, the Financial Industry Regulatory Authority (FINRA) Investor Education Foundation undertook a detailed survey known as the National Financial Capability Survey, intended to benchmark key indicators of financial capability and link these indicators to demographic, behavioral, attitudinal, and financial literacy characteristics. About 1,500 American adults were contacted by telephone; the primary sample of 1,200 respondents was constructed to be representative of the general adult US population.Footnote 3 Since financial capability is multidimensional, several indicators were collected. Consistent with surveys from other countries, the National Survey explored how people manage their resources and make financial decisions, what skill sets they use in making such decisions, and how they search for and glean information when making those decisions. In the present paper, we focus on two main areas of financial capability, namely, financial literacy and self-assessed skills, and retirement planning. We outline key findings next.
2.1 Findings regarding financial literacy
To evaluate Americans’ financial knowledge, respondents were asked three questions covering fundamental concepts of economics and finance, expressed as they would be in everyday transactions, such as simple calculations about interest rates and inflation and the workings of risk diversification.Footnote 4 The exact wording of questions is as follows:
1. Understanding of Interest Rate (Numeracy). Suppose you had $100 in a savings account and the interest rate was 2% per year. After 5 years, how much do you think you would have in the account if you left the money to grow?
(i) More than $102
(ii) Exactly $102
(iii) Less than $102
(iv) Do not know
(v) Refuse to answer
2. Understanding of Inflation. Imagine that the interest rate on your savings account was 1% per year and inflation was 2% per year. After 1 year, how much would you be able to buy with the money in this account?
(i) More than today
(ii) Exactly the same
(iii) Less than today
(iv) Do not know
(v) Refuse to answer
3. Understanding of Risk Diversification. Please tell me whether this statement is true or false. ‘Buying a single company's stock usually provides a safer return than a stock mutual fund’.
(i) True
(ii) False
(iii) Do not know
(iv) Refuse to answer
The first two questions indicate whether respondents have command of the economic concepts most fundamentally related to saving. The third question evaluates knowledge of risk diversification crucial to making informed investment decisions.Footnote 5
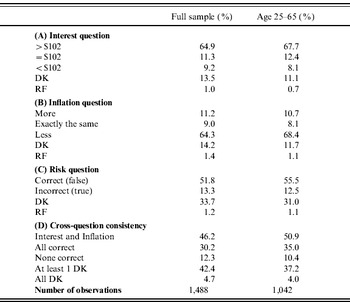
Summary statistics for responses to these questions appear in Table 1. Panel A shows that approximately 65% of respondents could correctly answer the question about interest rates. This is a discouragingly low number, given the question's simplicity and the fact that respondents did not have to make a calculation but could merely select from a list of answers. The proportion rises a bit for respondents aged 25–65, but not much. Only 64% of respondents correctly answered the inflation question. Approximately 20% of respondents got this question wrong, and another 14% could not answer the question (Panel B). While more of the 25–65 age bracket got the answers right, still more than one-fifth were incorrect, and 12% stated they do not know the answer. The third question, on risk diversification, appears to have given respondents the most difficulty: only about half of this representative sample of the US population got it right, while around a third could not answer (Panel C). Even among the prime age group (25–65), almost a third (31%) could not provide an answer.
Summary statistics on three financial literacy questions in the National Financial Capability Survey (%)

Note: Distributions of responses to financial literacy questions in full sample and for those aged 25–65 . All figures are weighted. DK indicates respondent does not know. RF indicates respondent refused to answer.
Responses to these three literacy questions are also positively correlated, meaning that those who answered one question correctly are also likely to have gotten the other two correct. Nevertheless, the correlation is not particularly high, which suggests that each question measures a different aspect of financial knowledge. Across all age groups, less than half (46%) could correctly answer both the interest rate and inflation questions, and fewer than one-third (30%) got all three questions correct, as seen in Table 1 (Panel D). Among those aged 25–65, half (51%) got the first two questions right, and one-third (35%) handled all three accurately. In view of the complex financial decisions that individuals confront in the current economic environment, these are discouragingly low success rates. Moreover, many respondents (40% in some cases) indicated they ‘do not know’ how to answer; this is important since such responses tend to be offered by those who know the least (Lusardi and Mitchell, Reference Lusardi, Mitchell, Lusardi and Mitchell2011).
Our findings using the National Capability Survey reinforce reports from past studies of the US population as a whole (Bernheim, Reference Bernheim and Douglas1995, Reference Bernheim, Douglas, Mitchell and Schieber1998; Hilgert et al., Reference Hilgert, Hogarth and Beverly2003; Moore, Reference Moore and Danna2003); surveys on the over-50 age group in the Health and Retirement Study (Lusardi and Mitchell, Reference Lusardi and Mitchell2007a); and recent work with all ages in the American Life Panel (Lusardi and Mitchell, Reference Lusardi and Mitchell2009) and evidence from other countries (OECD, 2005).
2.2 Who is financially illiterate?
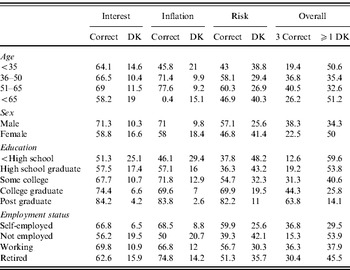
We also find that specific socio-demographic groups are particularly vulnerable, as indicated in Table 2. Here financial literacy is lowest among younger persons (under age 35) as well as the group older than age 65. While we cannot differentiate age from cohort effects in a cross-section, it is striking that so many of the young are poorly informed about risk diversification and inflation. Fewer than half (46%) of young respondents answer the inflation question correctly, and fewer still (43%) understand risk diversification. This confirms recent reports of low financial literacy among young adults (age 23–28) in the National Longitudinal Survey of Youth (Lusardi et al., Reference Lusardi, Mitchell and Curto2010) and high school students (NCEE, 2005; Mandell, Reference Mandell, Lewis and Lusardi2008). Shortfalls in financial literacy at older ages are also reported by Lusardi and Mitchell (Reference Lusardi, Mitchell, Lusardi and Mitchell2011) and Lusardi and Tufano (Reference Lusardi and Tufano2009a, Reference Lusardi and Tufanob).
Distribution of responses to financial literacy questions by age, sex, education, and employment status in the National Financial Capability Survey (%)

Note: All figures are weighted. DK indicates respondent does not know.
Table 2 also shows that women are less financially literate than men, and these differences are statistically significant, particularly for the interest rate and inflation questions. Women are also much more likely to state that they cannot answer a question, indicative of very low levels of knowledge; this is most pronounced for the risk diversification question, to which 41% of women cannot give an answer. Moreover, women are less likely to answer all questions correctly. These findings underscore sex differences in literacy detected among the young and the older population as reported in other studies (Lusardi and Mitchell, Reference Lusardi and Mitchell2008a; Lusardi et al., Reference Lusardi, Mitchell and Curto2010) and in the American Life Panel and TNS surveys (Lusardi and Mitchell, Reference Lusardi and Mitchell2009; Lusardi and Tufano, Reference Lusardi and Tufano2009a, Reference Lusardi and Tufanob). Table 2 also shows that financial literacy is positively correlated with educational attainment. The least financially literate are those who lack a high school degree; only about half of such respondents could answer the interest rate question correctly (and another quarter could not answer). The prevalence of correct answers to the interest rate question rises with education, while the proportion of both incorrect and ‘don't know’ (DK) answers falls. A similar pattern characterizes the inflation question: those without a high school degree are more often incorrect or unable to answer. The risk diversification question is clearly more difficult, since only those with at least a college degree could answer accurately; even here, however, about one-fifth could not provide an answer. Conversely, half of those lacking a high school degree indicated they could not answer the diversification question. And scores also differ by employment status, as indicated in Table 2: those not employed do much worse on the three questions than do workers or the self-employed (and differences are statistically significant). Non-workers are also much more likely to have responded with DK, with the proportion as high as 42%.Footnote 6 It is noteworthy that the retired are much more likely to have correctly answered the question about inflation, perhaps because they have experience with it.
2.3 Racial/Ethnic differences in financial literacy and actual versus self-assessed financial literacy
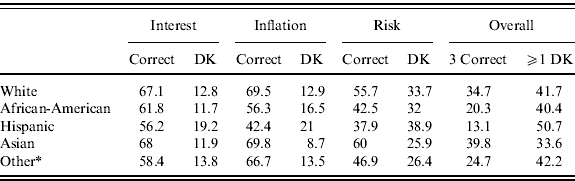
It is also instructive to compare financial literacy differences along racial/ethnic lines, and the National Survey oversampled these groups so as to be able to study them in more detail. Prior research has found quite different patterns of wealth and retirement saving for these population subgroups (Lusardi and Beeler, Reference Lusardi, Beeler, Madrian, Mitchell and Soldo2007; Lusardi and Mitchell, Reference Lusardi and Mitchell2007a, Reference Lusardi and Mitchell2008b; Ariel Investments,2009). Table 3a corroborates differential patterns for Whites, African-Americans, Hispanics, Asians, and others, and it shows that both African-American and Hispanic respondents display lower levels of financial knowledge than do White/Asian respondents.
Distribution of responses to financial literacy questions by race/ethnicity in the National Financial Capability Survey (%)
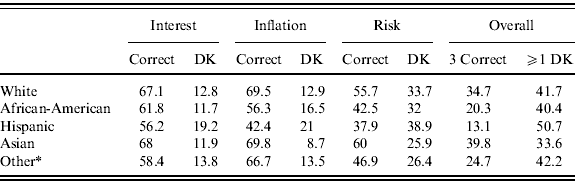
Note: All figures are weighted. DK indicates respondent does not know. *N=49.
Specifically, only 56% of Hispanics correctly answered the interest rate question, and a sizable fraction (19%) indicated that they did not know the answer. This is a potentially important result in view of the fact that many Hispanics tend to be unbanked and do not hold checking accounts (Hogarth et al., Reference Hogarth, Anguelov and Lee2004). A similar pattern emerges with regard to the inflation question: Hispanic respondents are least likely to have answered correctly (42%). African-American respondents also have a low fraction of correct responses to this question (56%). As far as knowledge of risk diversification, Hispanic and African-American respondents both have difficulty: only one-third (38%) of Hispanics and 42% of African-Americans responded correctly, and many could not answer the question at all. These figures confirm other reports of US racial/ethnic differences in financial literacy (Lusardi and Tufano, Reference Lusardi and Tufano2009a).
To complement the questions measuring actual financial literacy, the National Survey also asks respondents about how they assess their own financial knowledge. This is useful to identify any mismatch between perceived versus actual knowledge. To this end, survey respondents are asked:
On a scale from 1 to 7, where 1 means very low and 7 means very high, how would you assess your overall financial knowledge?
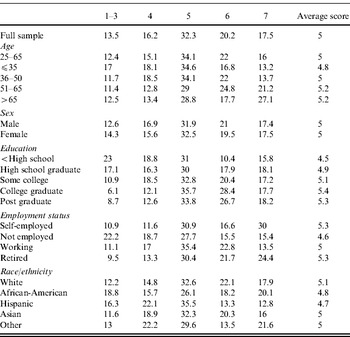
Although many respondents fare poorly in their responses to the three financial concepts, as just described, the results in Table 3b indicate that people believe they do rather well. Around two-fifths (38%) award themselves the top knowledge scores (6–7), and only 13% give themselves failing marks (1–3). Overall, almost 70% of respondents believe they are above-median with regard to financial knowledge, a figure that greatly exceeds what is revealed from our review of actual knowledge.
We can determine which sub-groups are aware of their lack of financial knowledge by comparing Tables 2 and 3b. The young seem aware of their lack of financial knowledge and give themselves relatively low scores (the lowest scores of any age subgroup), but the opposite is true among the older population for whom actual knowledge is low but self-rated scores are high. As many as 27% of older respondents grant themselves the highest self-rated score (7), and, on average, they give themselves a mark of 5.2, higher than other age groups. The extent of the mismatch between actual and self-assessed knowledge may explain why older people often are offered less financially attractive deals than other groups (Agarwal et al., Reference Agarwal, Gabaix and Laibson2009); this also corroborates Lusardi and Tufano (Reference Lusardi and Tufano2009a) who show that older individuals display the largest gaps between actual and self-assessed financial knowledge related to debt.
Distribution of responses to self-reported financial literacy questions by age, sex, education, employment status, and race/ethnicity in the National Financial Capability Survey (%)

Note: All figures are weighted.
Other patterns are also of interest. While women are less financially literate than men by actual metrics, they are aware of this and score themselves more conservatively. The less-educated know they are uninformed and grade themselves low; even among the least-educated, however, over half (57%) score themselves as fairly well-informed (5–7). Looking across racial/ethnic groups, Whites score themselves the highest, which correlates with their higher actual knowledge, whereas the relationship is weaker for other racial groups. Interestingly, some 40% of Whites bestow on themselves top assessment scores (6–7), though earlier we showed that many could not answer simple financial questions. Hispanics and African-Americans give themselves lower scores than Whites, but differences in self-assessed and actual knowledge are narrower than indicated by the patterns of correct responses to the three financial literacy questions. Overall, while self-assessed and actual knowledge are positively correlated, the relationship is only loose. Few respondents assess themselves as having low financial knowledge, even when they exhibit poor comprehension of basic financial concepts.
3 Planning for retirement
Another measure of financial capability we can investigate using the National Survey has to do with whether respondents look ahead and plan for the future. Our particular focus is on retirement planning, so we posed the following question (also asked in the 2004 HRS):
Have you ever tried to figure out how much you need to save for retirement?
This is important since prior research has established that planners accumulate far more retirement wealth than do non-planners (Lusardi, Reference Lusardi, Annamaria and Aaron1999; Lusardi and Beeler, Reference Lusardi, Beeler, Madrian, Mitchell and Soldo2007; Lusardi and Mitchell, Reference Lusardi and Mitchell2007a, Reference Lusardi and Mitchellb, Reference Lusardi, Mitchell, Lusardi and Mitchell2011). Unfortunately, and despite the need for self-reliance in retirement saving, the data show that most Americans do not engage in retirement planning. For instance, only about two-fifths of our respondents (43%) say they have ever even tried to figure out how much they should save for retirement, and this pattern is pervasive across all groups examined. Younger respondents are least likely to plan, but also worrisome is the fact that only 57% of all respondents aged 50–65 have attempted to figure out how much they need to save for retirement (and the proportion is only slightly higher for those who have not yet retired). While the prevalence of planning does rise with age, a sizable share of people near retirement has never attempted to figure out how much they need to save. These results underscore findings from the Health and Retirement Study and the Retirement Confidence Survey (Yakoboski and Dickemper, Reference Yakoboski and Dickemper1997; Lusardi, Reference Lusardi, Annamaria and Aaron1999, Reference Lusardi and Annamaria2005, Reference Lusardi, Annamaria, Foote, Goette and Meier2009; Lusardi and Mitchell, Reference Lusardi and Mitchell2007a).
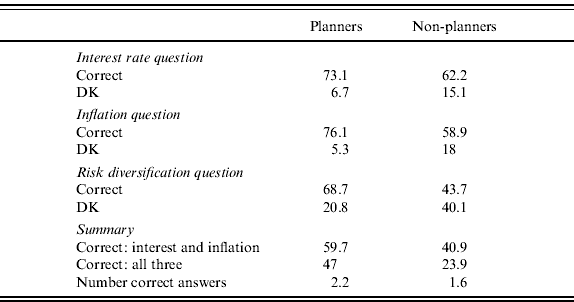
We also examine whether financial literacy and retirement planning are correlated, because lack of planning may be due to lack of financial knowledge. Table 4 confirms that retirement planning and financial literacy are, in fact, strongly positively associated in this dataset. For instance, those who answered all three financial literacy questions correctly are much more likely to have tried to figure out how much they need to save for retirement, and the positive relationship is particularly notable for those who understand the concept of risk diversification. To explore these topics in more detail, in the next section, we employ a multivariate model to examine the links between financial literacy and planning.
Financial literacy of planners and non-planners in the National Financial Capability Survey (%)

Note: Sample consists of 966 non-retired respondents aged 25–65 . DK indicates respondent does not know.
3.1 A multivariate model of planning and financial literacy
Previous work has demonstrated that financial literacy is an essential tool for informed consumer choice in a variety of settings. For example, those who are less financially literate are unlikely to participate in the stock market (van Rooij et al., Reference van Rooij, Lusardi and Alessie2011); they choose mutual funds with higher fees (Hastings and Tejeda-Ashton, Reference Hastings and Tejeda-Ashton2008); select higher-cost pension managers (Hastings and Mitchell, Reference Hastings and Mitchell2011); and amass less retirement wealth (Behrman et al., Reference Behrman, Olivia, Mitchell and Bravo2010). There is also evidence that financial literacy affects borrowing behavior; for instance, the less literate are more likely to have costly mortgages (Moore, Reference Moore and Danna2003) and more likely to engage in high-cost borrowing (Lusardi and Tufano, Reference Lusardi and Tufano2009a). Moreover, people with characteristics linked to low literacy, including low pay and low educational attainment, tend not to refinance their mortgages when interest rates are falling (Campbell, Reference Campbell and John2006). There is also research linking financial literacy and retirement planning for a range of population subgroups (Lusardi and Mitchell, Reference Lusardi and Mitchell2007a, Reference Lusardi and Mitchell2008a, Reference Lusardi and Mitchell2009, Reference Lusardi, Mitchell, Lusardi and Mitchell2011; Lusardi, Reference Lusardi and Annamaria2008).
Our new dataset is useful in determining whether this finding is robust and whether it holds true in the aftermath of the unusually severe financial crisis of 2008–09. We use multivariate regression analysis to relate the determinants of retirement planning to financial literacy, controlling for variables reflective of differences in preferences, lifetime income, and macroeconomic shocks. The sample is restricted to non-retired respondents younger than age 65, to exclude those in the decumulation phase of the life cycle. We also omit those younger than age 25, to eliminate those in school or not yet working. The list of controls includes age (and age squared to test for a hump-shaped profile), as well as sex and marital status; other controls include income levels, region of residence, and educational attainment. We also add an indicator for the self-employed, as they are very different from the rest of the population both in terms of lifetime income and wealth (Hurst et al., Reference Hurst, Lusardi, Kennickell and Torralba2010). To proxy for household shocks and liquidity constraints, we add an indicator for having a large and unexpected drop in income during the past year, for non-work (which includes the unemployed), and for the number of children financially dependent on the respondent. We include a dummy for homeownership as a proxy for wealth. Three different measures of financial literacy are used, one is an indicator equal to 1 if the respondent answers all three questions correctly (and 0 otherwise), a second indicator is the sum of each respondent's number of correct answers to the financial literacy questions (0–3), and a third indicator is a vector of three dummy variables indicating whether the respondent correctly answered each of the three financial literacy questions.
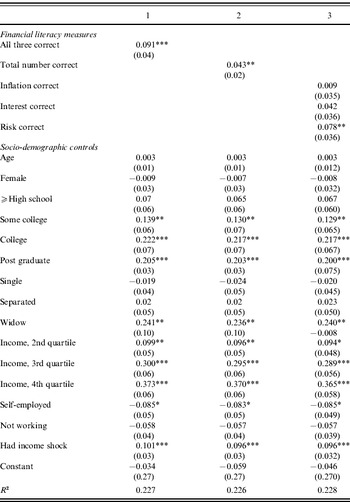
Table 5 reports results using ordinary least squares (OLS) regression with our different financial literacy measures. The coefficient on the first two literacy indicators is positive and statistically significant. In column 1, for instance, we see that those who answered all three questions correctly are 9 percentage points more likely to plan for retirement; column 2 shows that correctly answering an additional financial literacy question raises the chances of planning by 4 percentage points. When looking at which type of financial knowledge is most important for retirement planning (in column 3) we find that knowledge of risk diversification raises the chance of planning by 8 percentage points. This suggests that individuals need some financial sophistication to make retirement plans. We also note that the effect of financial literacy is smaller than but similar to the effect of having some college or a college degree; furthermore, financial literacy has an independent and statistically significant effect even after controlling for educational attainment. In other words, education alone does not account for the effect of having financial knowledge.Footnote 7 We also call attention to an interesting effect resulting from the financial crisis. Those who suffered a large decrease in income are more likely to plan for retirement afterwards, suggesting that negative shocks of the last few years have motivated people to think more about the future.Footnote 8 Other factors important to planning include income levels, race/ethnicity, and having many children.
OLS estimates of retirement planning on financial literacy in the National Financial Capability Survey

Note: Robust standard errors in parentheses;
*** P<0.01; **P<0.05; *P<0.1.
Other controls include number of children, age squared, region of residence, and homeowner. Sample consists of 966 non-retired respondents aged 25–65.
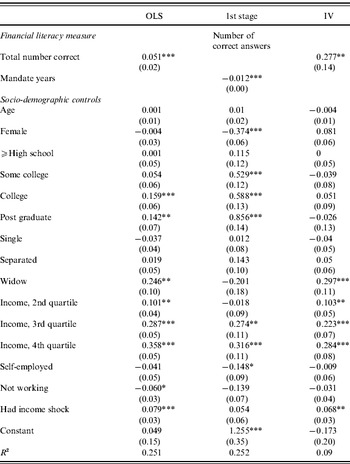
In Table 6, we take up the ancillary question of whether financial literacy may itself be endogenous. That is, financial literacy might be the result of choice, so, for example, some who will plan for retirement might invest in financial education that in turn would boost their financial literacy level. For this reason, a positive relationship between planning and financial literacy could be contaminated due to reverse causality. Additionally, financial literacy could be measured with error, which could also yield biased estimates. And finally, respondents might be sensitive to how questions are asked, and there is at least the possibility of some amount of guessing (van Rooij et al., Reference van Rooij, Lusardi and Alessie2011; Lusardi and Mitchell, Reference Lusardi and Mitchell2009).
OLS versus IV estimates of financial literacy impact in the National Financial Capability Survey
Columns (1 and 3) dependent variable=1 if planner (0 else); column (2) dependent variable is the total count of correct answers to three financial literacy questions.

Note: Robust standard errors in parentheses;
*** P<0.01; **P<0.05; *P<0.1.
Other controls include number of children, age squared, region of residence, and homeowner. Sample consists of 1,169 non-retired respondents under the age of 65.
To address these issues, it is useful to re-estimate the impact of financial literacy on planning, controlling for possible causality with an Instrumental Variables (IV) approach.Footnote 9 To do so in the US context, we take advantage of the fact that several states mandated high school financial education in the past (mostly for political reasons rather than to stimulate retirement planning; see Bernheim et al., Reference Bernheim, Garrett and Maki2001). Accordingly we can estimate a first-stage regression of financial literacy on exposure to the mandate, to account for exogenous variation in financial literacy. The National Survey asks respondents to indicate the state in which they lived in their senior year of high school, which permits us to compute the number of years the mandate was in effect relevant to the respondent. This approach accounts not only for whether a state implemented the mandate but also for the length of time that mandated benefits were in effect. For example, if a respondent was a high school senior in 1980 and his home state had implemented a mandate in 1970, the instrument would take the value of 10.Footnote 10 We then re-estimate the planning model given the instrumented financial literacy variable.
Results in Table 6 use an enlarged sample to increase the strength of our instrument; specifically we include respondents younger than age 25. Because the instrument only significantly predicts one measure of financial literacy (total number of correct answers), we focus mainly on that measure. Even after instrumenting, the impact of financial literacy on planning is positive and statistically significant. Moreover, the estimated financial literacy coefficient is larger than the OLS estimate. For this reason, it appears that financial literacy does drive retirement planning, even after accounting for endogeneity and possible error in the financial literacy measures. This finding underscores the importance of enhancing financial literacy for retirement well-being, particularly building on prior studies showing evidence of similar causality.
4 Discussion and conclusions
Our findings from the National Financial Capability Survey paint a troubling picture of the current state of financial knowledge in the US. Many respondents lack key knowledge of financial concepts and fail to plan for retirement, even when retirement is close at hand, only 5–10 years away. This is important, because being able to develop and implement a retirement plan is key to retirement security. Those who do not plan will reach retirement with only half the wealth of those who do. It is also worrisome that the lowest-paid and least-educated population knows less, as these groups are likely quite vulnerable to bad financial decisions.
Another result is that financial illiteracy may place great strain on families and personal finance, leading to suboptimal decisions regarding investment, retirement, and spending. Moreover, the cost of poor financial decisions may be passed on to others when the consequence is reliance on government safety nets (perhaps leading to tax increases). As a result, the cost of financial illiteracy is likely to devolve not only to the least capable individuals but also to society as a whole. As the President's Advisory Council on Financial Literacy recently stated (PACFL, 2008): ‘While the crisis has many causes, it is undeniable that financial illiteracy is one of the root causes … Sadly, far too many Americans do not have the basic financial skills necessary to develop and maintain a budget, to understand credit, to understand investment vehicles, or to take advantage of our banking system. It is essential to provide basic financial education that allows people to better navigate an economic crisis such as this one.’ Enhancing financial literacy is critical to successful retirement, particularly among the most financially vulnerable.