Since the 1980s there has been a rapid spread of non-cash payment instruments that compete with cash.Footnote 1 First and foremost, debit and credit cards have become an almost universal payment instrument in many countries. Second, in the 1990s, electronic pursesFootnote 2 were introduced, although with limited success. After a first wave of mobile paymentsFootnote 3 that emerged at the turn of the twenty-first century, we are now witnessing a second wave, which seems to be more successful (Krueger Reference Krueger and Górka2016). Third, technology is making cards more convenient, in particular through the implementation of contactless payments.Footnote 4 Finally, the rise of the internet has shifted an increasing share of retail sales onto the web and thus made it more likely that cashless means of payment would be used.Footnote 5
The current proliferation of new payment instruments sometimes masks the fact that the changes in the payment system that took place in the period from the 1950s to the 1970s have been much more profound than anything that happened afterwards. These innovations not only deeply affected the way payments were made but also the way people were saving.
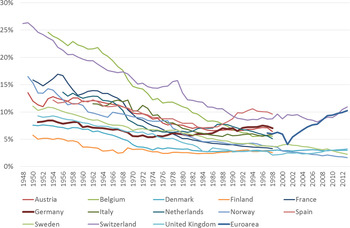
Unfortunately, there are hardly any retail payment statistics covering this period. The first BIS report on retail payments was published in 1980 and provided data for 1978 (BIS 1980). However, the evolution of cash-to-GDP ratios can be used as an indicator of the underlying changes in the payment system. As Figure 1 shows, there is a clear downward trend that comes to an end in the early 1980s – in some countries earlier, in others later.
Cash-to-GDP ratios

In West Germany, the decline of the cash-to-GDP ratio lasted until the early 1970s. This decline reflects the evolution from a system in which most people did not have a giro account and made little use of cashless payments to a situation in which almost any economically active person had a giro account and cashless payments were increasingly used.
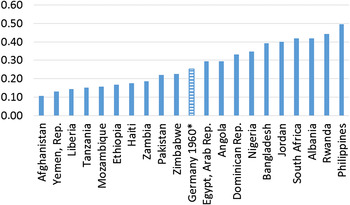
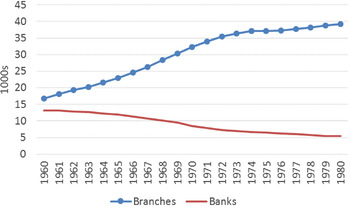
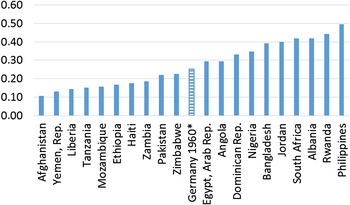
Thus, within a span of 20–25 years, the way German households made payments evolved from a level comparable to many developing countries today to an advanced level in which most regular payments are made cashless.Footnote 6 This process was driven by a shift from wage and salary payments in cash to cashless payments. This shift was made possible by a large expansion of the banks’ branch network and the number of giro accounts. The need to broaden the scope of the banking system distinguishes the German experience (and the experience of other European countries) from that of the US. According to Humphrey et al. (1996, p. 29), right from the start, US banks served the general public by means of chequing accounts and not just merchants and the wealthy. As a consequence, in the US the introduction of cashless payments did not require a substantial expansion of the branch network. Thus, the German example is more interesting for developing countries because in these countries the share of unbanked persons is usually large – as reflected in a low number of bank accounts per person (see Figure 2).
Number of bank accounts per person (2016)
This article provides an in-depth analysis of the introduction of cashless wage payments in West Germany (Section i)Footnote 7 and analyses the main drivers of change (Section ii). Section iii looks at the effects of payment innovations on the payment behaviour of non-banks. Section iv provides a summary of the results and draws some conclusions with special reference to developing countries.
I
The period from the late 1950s to the early 1970s was characterised by substantial change in the way ordinary people carried out payments and held their wealth. In this period, companies started paying wages by credit transfers and the number of current accounts or ‘giro accounts’ grew rapidly.Footnote 8 These developments are interesting for at least two reasons. First, just like today's innovations (card payments, mobile payments) these innovations promised to substitute non-cash payments for cash payments on a large scale. Second, they lowered the transaction costs of switching funds between money and interest-bearing assets. This opened access for lower- and middle-income households to a wide array of savings products and to consumer credit.
In the 1950s, West Germany was basically a cash society. Wages were mainly paid in cash and few households had a giro account with a bank. Even though many small savers held savings accounts with the savings banks, a large portion of the population used cash not only as a medium of payments but also as a store of wealth. If it was necessary to transfer cash to more distant recipients, households used the transfer system of the German postal service, in those days a government agency (Schubert and Schneider Reference Schubert and Schneider1980).
However, since the late 1950s there have been numerous and wide-ranging changes in the payments system:
-
• introduction of cashless wage payments
-
• extension of the bank branch network
-
• improvements in the use of cheques
-
• increased use of credit transfers and direct debits
-
• increased use of paperless methods in the payments system
-
• introduction of cheque and bank cards
Whereas in the late 1950s the possession of a giro account (chequing account) was largely confined to firms and wealthy individuals (Terrahe Reference Terrahe1983, p. 352), by 1977 there were 37 million private (i.e. non-business) giro accounts in a population of 61 million (of which 26 million were employed). This suggests that almost every economically active person had a giro account by this time. In this context Büschgen (Reference Büschgen and Gall1995, p. 697) speaks of a ‘revolution’ in retail banking. Footnote 9
The main driver behind this development was the shift from wage and salary payments in cash to cashless payments. This shift not only affected payment methods used in West Germany but also the savings behaviour of private households. Once they had giro accounts they were also prepared to invest more in savings products offered by the banks. The transition to cashless wage payments stretched out over a long period ranging from the late 1950s to the mid 1970s.
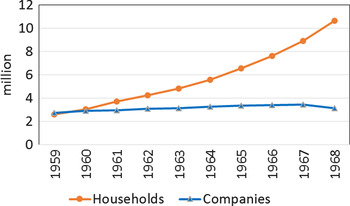
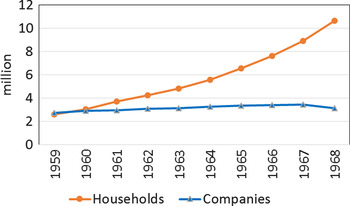
To a certain extent, cashless wage payments existed already in the 1950s – mainly for public-sector employees (Röthel Reference Röthel1960, p. 299). The share of ‘wage and salary accounts’ (also referred to as ‘private accounts’)Footnote 10 relative to total accounts was still small, however. In particular, wages were nearly exclusively paid out in cash. This changed in the late 1950s. Up to the mid 1970s the number of wage and salary accounts and bank branches increased strongly (see Figures 3 and 4).Footnote 11 Already in 1960 the number of wage and salary accounts surpassed the number of giro accounts of firms. Some 90 per cent of the following increase of giro accounts with savings banks was due to new wage and salary accounts. In nearly all cases, the switch to giro transfer of wages was immediately followed by a switch to monthly payments (Röthel Reference Röthel1960, p. 300).
The number of accounts at savings banks, 1959–68a
The number of banks and bank branches, 1960–80a Footnote 12
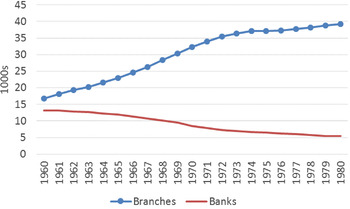
The switch to cashless payments required large-scale investments and technical and organisational improvements in payment processing.Footnote 13 The banks had to enlarge their branch network considerably. Up to the mid 1970s the number of bank branches steadily rose, while the number of banks declined (see Figure 4). At the same time, there were many technical and organisational improvements (Büschgen Reference Büschgen and Gall1995, p. 714; Terrahe Reference Terrahe1983, p. 353, Strohmayr Reference Strohmayr and Mura1995, p. 58).
The transformation of the payment system would not have been possible without co-operation – in particular with respect to new payment standards.Footnote 14 In 1960, the banks agreed on a standard form for giro transfers, in 1963 there was an agreement on ‘direct debits’ (giro transfers initiated by the payee) and in 1967 the banks started to emit cheque cards (Lipfert Reference Lipfert1970). The introduction of cheque cards enhanced the acceptance of cheques because the issuer of the card guaranteed that cheques would be honoured up to DM200 (later DM300). Finally, in early 1968, more flexible overdraft facilities were introduced (Ashauer Reference Ashauer1983, p. 327; Büschgen Reference Büschgen and Gall1995, p. 704).
In the 1970s the in-house processing of cashless payments as well as the clearing between different banks was improved. Optical-mechanical machines were introduced to read and process vouchers and also the first steps were taken on the way towards paperless payments (Terrahe Reference Terrahe1983, p. 353).Footnote 15 With the introduction of the ‘eurocheque’ in 1972 cheques were standardised and gained a larger significance for retail payments and for tourists travelling within Europe.Footnote 16 The eurocheque was introduced without charge – neither for households nor for retailers – a ‘blemish’ the banks were not able to remedy in subsequent years (Strohmayr Reference Strohmayr and Mura1995, p. 61).
II
What were the factors that drove payment innovation? In order to answer this question, the incentives of the various groups (banks, firms, wage earners) will be analysed. The focus will be on ‘regime change’ – not on incremental change.
For wage earners it was not a question of whether they wanted to hold slightly larger or smaller balances in their giro accounts. It was a question of whether they wanted an account at all. In order to decide this question they had to compare the expected costs and benefits of the new regime with the old cash regime. The old cash regime had the advantage for wage earners that they saved trips to the bank since wages were paid out at the firm. But the new regime promised a certain gain because some payments can be made more easily via transfers of deposits. Interest on deposits has rarely been paid in the past and is still not common in Germany. In this respect, deposits did not promise any gains over cash. Trips to the bank were likely to increase, especially for those households which had neither a giro account nor a savings account before. If wage payments took place during working hours, there were no fixed costs involved for households. In the case of a bank account, however, there might be periodic charges and set-up costs. Furthermore, it had to be taken into account that the shift was going hand in hand with a shift towards monthly wage payments, which basically meant that workers had to grant a loan equal to half a monthly salary to their employers instead of half a weekly salary. For families with tight budget and borrowing constraints this outcome may not have looked advantageous. Even when taking into account that the introduction of consumer credits for account holders made an account more attractive,Footnote 17 from the point of view of households, a regime switch from cash to deposits did not necessarily look promising.
On the whole, there does not seem to have been a strong demand for banking services by wage earners.Footnote 18 Rather, it took some effort to persuade them to change. To overcome the resistance of private households wage accounts were initially free of charge for employees.Footnote 19 Only in 1972 were account charges introduced by most of the banks (Büschgen Reference Büschgen and Gall1995, p. 710; Strohmayr Reference Strohmayr and Mura1995, p. 56).
Weekly cash payments of wages were quite costly for firms. With rising employment and rising wages the weekly cash payments became more and more of a burden for them. The costs of workers leaving their work places in order to receive cash were rising, especially for firms with a widely dispersed workforce (Juchter Reference Juchter1960, p. 90). Cashless wage payments held the promise to eliminate these costs. Moreover, since it was understood that cashless wages would be paid out on a monthly basis, there was another benefit for firms. Basically, under monthly payments, workers are granting a two-week credit to employers whereas under weekly payments it is only a half-week credit.
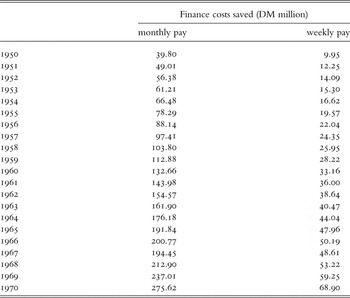
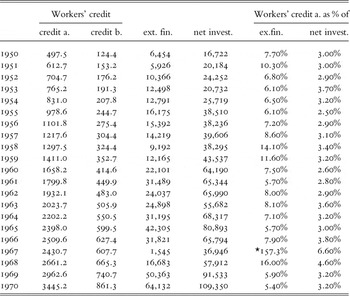
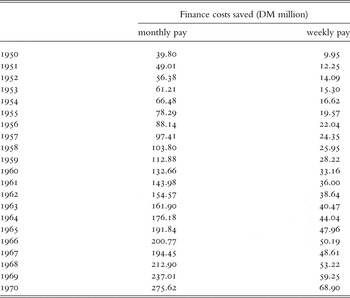
A back-of-the-envelope calculation shows the relative size of benefits. In 1970, the difference in costs between weekly cash payments and monthly non-cash payments would be equal to DM1,200 million, about 0.17 per cent of GDP.Footnote 20 Looked at from a different perspective, monthly wage payments imply an employee credit to firms in the range of 6 to 8 per cent of external finance. Thus, for companies the shift to monthly cashless wage payments definitely had benefits. However, most of these benefits could have been reaped even if cash payments had been maintained.
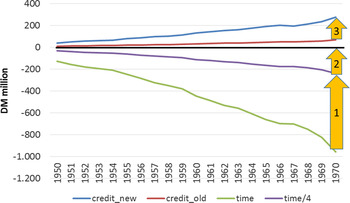
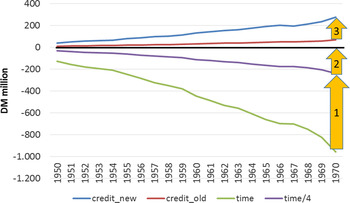
Interestingly, from the point of view of companies, most benefits of a shift towards cashless wage payments could also have been achieved by a shift towards monthly wage payments in cash. Such a shift would have affected the saving on the time lost when workers were collecting their cash payments (arrow 1 in Figure 5) and the increase of the implicit credit that came with monthly payments (arrow 3 in Figure 5). The only additional benefit that came with cashless payments consisted of the complete elimination of wage payment costs (arrow 2 in Figure 5).
Cost savings for firms
Banks have to consider large investments that will only pay off, if they correctly predict the demand for payments and their situation vis-à-vis their competitors. Following Baltensperger (Reference Baltensperger1980, p. 35), the decision problem of the banks can be analysed with the help of the following profit function:
 $$\Pi _B = r_c A{\rm -} r_d D{\rm -} r_e E{\rm -} AMC{\rm -} \lambda _I I{\rm -} \varepsilon P{\rm -} F{\rm -} L{\rm -} S $$
The banks are trying to maximise profits Π B that consist of
-
• the interest income on earning assets (r c A)
-
• interest payments on ‘deposits’ (non-equity liabilities) and equity (r d D and r e E)
-
• asset management costs (AMC)
-
• the costs of running the payment system which consist of the cost of capital (basically a leasing rate where λ I = interest + depreciation on the investment ‘I’) and variable costs (ε P) which can be either proportional to the amount of payments (P) or falling with P
-
• other costs (F) such as advertisingFootnote 21
-
• liquidity costs (L) and
-
• insolvency costs (S).
The question for the banks is not simply whether the customers are prepared to pay enough for the services of the payment system in order to finance large investments and pay for variable costs. They must also take into account that via the provision of payments services
-
• new customers can be acquired and
-
• other services can be sold to customers (‘cross-selling’).
Better services may also allow the interest rate spread to be kept wider. A larger customer base reduces the variability of net outflows and therefore liquidity costs (L).Footnote 22 Furthermore, other costs, like advertising, may be reduced. Thus, other costs (F), liquidity costs (L), the spread (r c -rd ) and the size of earning assets and deposits (A and D) are all functions of the investment in the payment system (I). Finally, each bank must have an idea as to the prospective size of the payments system because there are network externalities in the provision of payments services and the process of clearing. Thus, the banks need to form expectations about the growth of the market as a whole and about the development of individual market shares.
At first, German banks were hesitant. Given the huge necessary investments in a larger branch network and the high running costs, they feared that the additional earnings might be too low. The calculations made by some banks confirmed that the earnings stemming from interest-free deposits would not be enough to cover the costs of the payment system, even though gaining new customers with giro accounts opened the possibility of selling them other financial products (Röthel Reference Röthel1960, p. 300; Brune Reference Brune1968). Thus, from a static point of view, the outlook was mixed, at best.
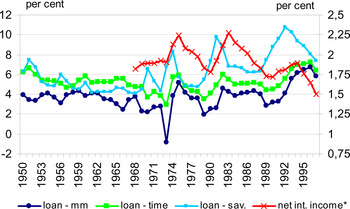
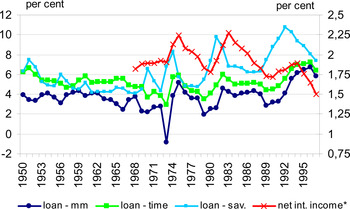
But there were two important factors that induced the banks to go ahead and expand. First, 1958 brought a kind of ‘big bang’ for branch banking in West Germany. Until 1956 the banks had successfully managed to dismantle all the restrictions of the allied powers which allowed banks only to operate on a provincial scale (Holtfrerich Reference Holtfrerich and Gall1995, pp. 439–86). However, the expansion of the branch network still required an official permit by German authorities (Bedürfnisprüfung). This requirement was scrapped by a federal court in 1958 (Deutsche Bundesbank 1961, p. 13). This was the end of the ‘truce’ which had prevailed between German banks earlier in the 1950s (Ashauer Reference Ashauer1983, p. 317). At the same time, interest rates remained regulated (until March 1967), as in other countries. As a consequence, competition via interest rate changes was not possible. The spread was fixed. Since the spread was relatively wide it was profitable for banks to look for other means to attract customers. Most banks were opposed to the abolition of interest rate regulation, which shows that the spread must have been ‘generous’ (Büschgen Reference Büschgen and Gall1995, p. 703). After the abolition of interest rate controls the spread between loan rates and time deposit rates declined, falling below 4 per cent in the early 1970s (see Figure 6). The subsequent rise of the spread can be explained by increased inflation and interest rate volatility.
The spread between debit and credit interest rates
Thus, in the late 1950s there was a mix of regulation and deregulation that intensified competition and channelled it mostly into non-price competition.
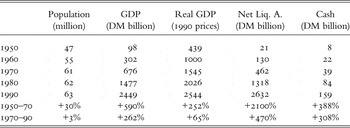
The second factor at work was the increase in real incomes. The 1950s and 1960s saw a spectacular rise in income and wealth of the broad population (see Table 1). Whereas bankers had previously looked down on the retail business, the rise in real incomes and wealth of the broad population promised a big new market (Büschgen Reference Büschgen1983, p. 402). This caused a change in attitudes even of those banks which had traditionally only catered for wealthy individuals.Footnote 23
Income and wealth: major trends in West Germany, 1950–90

Note: Net Liq. A.: net liquid assets of households.
Sources: Deutsche Bundesbank, Sachverständigenrat zur Begutachtung der gesamtwirtschaftlichen Entwicklung; own calculations.
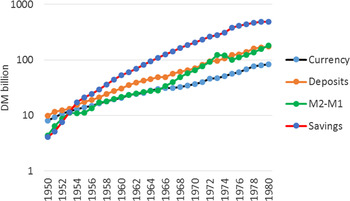
So, while in the late 1950s the costs of offering payment services to the population seemed to outstrip the short-term benefits, the long-run prospects looked quite different. Indeed, it was the prospect of attracting more savings from the small savers that led the banks to undertake the massive investments in the branch network. The subsequent evolution proved them right. The expansion of the branch network had the desired effect: savings and time deposits grew strongly (see Figure 7).
Liquid assets, 1950–75

As the market was expanding, competition became stiffer and the number of banks was considerably reduced. In 1960, there were still more than 13,000 banks in West Germany – many of which did not survive the ‘retail banking revolution’ – and by 1977 the number was reduced to 6,000 (see Figure 4). The number of co-operative banks fell from 12,000 (1948) to 4,600 (1978) and the number of private banks was reduced from 233 (1951) to 92 (1978) (Wolf Reference Wolf1980, pp. 122, 132). Since the market was vigorously expanding, there were not many banks that actually went out of business. Rather, competition and rationalisation led to take-overs and mergers. In particular, small co-operative banks in the countryside experienced a wave of mergers.
Competition in the banking sector received another boost when interest regulations were abolished in 1967.Footnote 24 At the same time, restrictions regarding the advertising activities of banks were abolished (see Büschgen Reference Krueger and Górka1983, pp. 401–2).Footnote 25 Stronger interest rate competition together with the success of the giro account, which had become the centre of the payment system (Ashauer Reference Ashauer1983, p. 326), were the two most important factors which led to the introduction of service charges for giro accounts in the early 1970s.Footnote 26
Thus, at the end of the 1950s, two of the three groups involved in the payment of wages had an incentive to consider a change in the method of payment. At the same time, three of the principal elements existed that may trigger innovation: regulation/deregulation, competition and growing markets. Regulation diverted competition away from price competition to non-price competition. Deregulation, competitive forces and the vigorously growing markets gave the incentive to make large-scale investments in the payments system (basically branches, people and processing technology). As a driving force, technology played a minor role at first. Yet, once the branch network and the payments system had been installed, there was a constant struggle to keep costs down and employ new technologies in order to make the processing of vouchers more efficient. So there was a kind of induced technological progress. As an independent force, technology became important only in the 1970s.Footnote 27
III
While the changes in the payment system, envisioned in the late 1950s, were clearly revolutionary, implementation was rather evolutionary – conforming with historical experience (see White Reference White and Dorn1997). Not only did the banks need time to expand the branch network,Footnote 28 also new customers needed time to adopt the opportunities provided by the new payments methods.
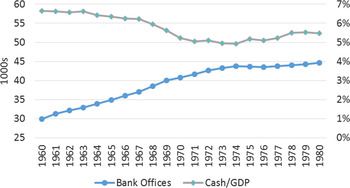
The transition was a continuous process of approximately 15 years. The expansion of the branch network went hand in hand with a slow decline of the cash-to-GDP ratio (see Figure 8). In this period the behaviour of people changed slowly. For instance, the change from weekly cash payments to monthly transfers of deposits had, at first, little impact on the demand for cash because in many cases blue-collar workers would go to the bank four times a month and take out cash – regarding the bank as something like a pay office (Ashauer Reference Ashauer1983, p. 326). This is documented by the statistics on transactions per account. In 1959 blue-collar workers would use the account on average four times per month whereas white-collar workers already made 6.42 transactions per account per month (Röthel Reference Röthel1960, p. 300). Only after a certain adjustment period were cashless payments used more often (giro transfers, standing orders, direct debits) and the giro account was supplemented by a savings account (Köster Reference Köster1967, p. 389). Thus, cashless wage payments only gradually led to further substitution of cash payments.Footnote 29 By 1965, only half of the accounts of white-collar workers and a third of the accounts of blue-collar workers at savings banks were used for standing orders (Pfisterer Reference Pfisterer1967, p. 385). The average number of transactions per account in this year was 61. This is equal to five per month. Such a figure shows that the overwhelming amount of transactions still must have been made in cash (see also Harmsen, Weiß and Georgieff Reference Harmsen, Weiss and Georgieff1991, pp. 231–3).
The number of bank offices and the cash to deposit ratio

The average amount of sight deposits on private accounts was DM432. Seventy per cent of transactions were debits and nearly half of the debits were cash withdrawals (Reyher Reference Reyher1967, p. 401). The average size of yearly ‘automatic debits’ (standing orders and direct debits) per account was DM824. This is equal to DM5.4 billion. Of this amount DM3.4 billion were credited to accounts of third parties and DM2.0 billion to own accounts or accounts of family members (Köster Reference Köster1967, p. 388). This compares to private consumption expenditures to the order of DM260 billion.
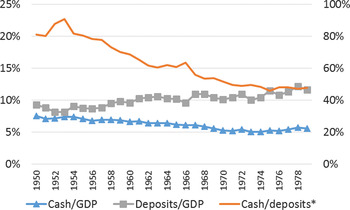
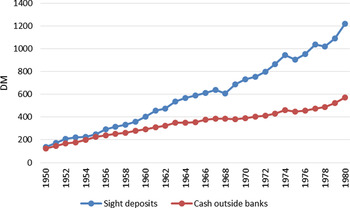
The increased use of cashless payments led to a gradual decline of the cash-to-GDP ratio and the cash-to-deposits ratio (Figure 10). Nevertheless, real per capita cash holdings continued to rise during almost the entire period under observation (Figure 9).
The cash to GDP and the deposits to GDP ratio

Real per capita balances of cash and deposits

Not surprisingly, per capita deposit balances rose faster than per capita cash balances. Still, the deposits-to-GDP ratio rose only very slowly. Thus, in spite of the increased use of cashless payments instruments, the volume of deposits increased only slightly faster than GDP – the commonly used scale variable.
The fact that the increased use of deposits as a means of payment did not lead to a stronger rise in the deposits to GDP ratio may be due to intensified deposit management. The spread of the branch network reduced the costs of transferring funds from sight deposits into interest-bearing accounts. As a consequence, the (sight) deposit to M3 ratio declined from 31 per cent (1955) to 23 per cent (1973).Footnote 30
IV
In spite of its profound impact, the change in the German payment system was evolutionary and steady rather than revolutionary and erratic. Money users changed their habits only slowly. Thus, throughout the period, the demand for cash was rising – in spite of the growing use of deposits as a means of payment.
The process of payment innovation did not lead to a complete replacement of the traditional means of payment (bank notes and coins). In terms of the number of transactions, cash remained the dominating means of payment. The new means of payment such as credit transfers, direct debits or standing orders were (and are) mainly used for larger payments and for recurring payments. Smaller payments in face-to-face transactions continued to be made mainly in cash.Footnote 31
The main findings regarding the process of innovation can be summarised as follows:
-
• Competition was a driving force – interacting with regulation and deregulation. Unlike today, non-banks were not active. The main drivers of the process were banks.
-
• Initially, non-price competition in the banking sector was important because regulation limited the extent of price competition.
-
• The introduction of the new payment system required some non-market co-ordination. Banks had to agree on standards regarding technology, design of forms and common procedures. These joint activities were tolerated or even welcomed by the authorities.
-
• Some of the gains produced by the shift towards cashless wage payments were caused by organisational changes rather than by new technologies.
-
• The change in the payment system opened access for low income households to new savings products and to consumer credit.
-
• To speed up the acceptance of new payment instruments, these instruments were usually under-priced (the price often being zero). This strategy helped to overcome initial resistance and quickly gain critical mass. But this approach also had its drawbacks. While in some cases user charges could be levied after the introductory period had passed (e.g. giro accounts), in other cases this was not the case (e.g. eurocheques).Footnote 32
Humphrey et al. (Reference Humphrey, Sato, Tsurumi and Vesala1996) have analysed the payment systems in the US, Japan and Europe and derived conclusions for developing markets as to which payments instruments should be used. The analysis of the German post-war experience does not lend itself to such an exercise. Rather, it helps to explain the drivers of change and some necessary preconditions for change.
As noted in the introduction, in the 1950s household use of cashless payments was little developed in West Germany and comparable to many developing countries. In the case of West Germany, the main driver of change was the switch to cashless wage and salary payments. The applicability of this model to developing countries depends on certain conditions. First, in the 1950s, most firms were already using banking services. Second, most employed people were working on a regular contractual basis. Third, growth prospects were bright. Under these circumstances a move towards cashless wage payments was interesting for companies and banks. In many developing countries, these conditions do not prevail (World Bank 2012, pp. 354–5). With a large proportion of people being self-employed or working in the informal sector, cashless wage payments are unlikely to find much support.
Yet during the past decades, conditions on the supply side have changed considerably. Whereas German banks needed to invest heavily in new branches and processing capacity, today potential customers can be reached via mobile phones. Moreover, prepaid phone accounts already resemble bank accounts in many ways. The success of new mobile payment systems like M-Pesa demonstrates that it is possible to offer new methods of payments at a price that is attractive for customers and, at the same time, allows payment service providers (PSPs) to make a profit. M-Pesa is a mobile payment system that originated in Kenya and that has spread to other African markets. It converts the prepaid mobile account to a kind of simple bank account allowing transfer of funds from mobile phone to mobile phone and cash in-payments and out-payments.Footnote 33
The example of M-Pesa shows that technological changes may have big effects on markets, including the payments market. However, technology is not everything. The German example shows that innovation needs not be triggered by new technologies. The changes initiated in the late 1950s were driven by market developments. In fact, no matter whether ‘new’ or ‘old’ technologies are used, new products have to meet market needs.
The German example also shows that payment innovations can trigger change in other areas. In fact, the additional services that came with a giro bank account, better access to savings instruments and consumer credit, were at least as important as the efficiency gains in payments. Therefore, regulators should not block attempts of market participants to go beyond payments.
In the case of West Germany, co-operation between the banks was one of the success factors. Co-operation allows banks and PSPs to agree on standards and implement interoperable solutions. While such co-operation always has the potential to be misused, it still is essential for network industries like payments to function. Anti-trust authorities should take this into account.
The evolution of the German payment system and its effect on the cash-to-GDP ratio are also interesting from another point of view. Often long-term trends in cash balances or cash-to-GDP ratios are used as indicators of activities in the black economy.Footnote 34 However, the analysis above suggests that such trends can be strongly influenced by institutional changes in the payment system. Therefore, results that do not take such changes into account should be interpreted with caution.
Appendix: The switch to monthly cashless wage payments: potential cost savings for firms
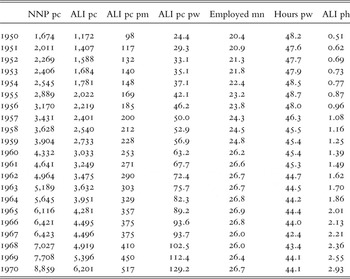
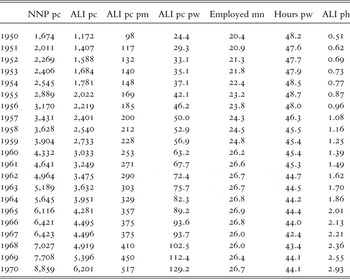
Estimate of the value of one hour of work time
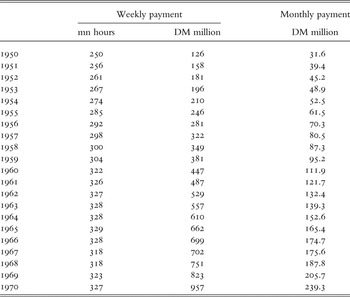
Value of working hours lost due to wage payments in cash
Assumptions: 15 minutes lost per worker per payment, 49 weeks per year
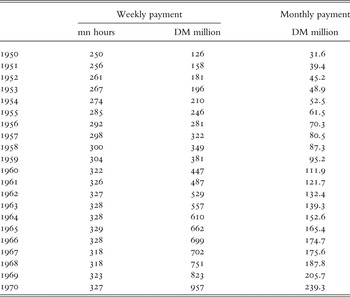
Value of implicit workers’ credit to firms

Finance costs saved due to implicit workers’ credit
Assumption: interest rate = 8%