Implications
Fetuin A is a major plasma protein in the newborn pig that is produced primarily in the liver. This study demonstrated that fetuin A gene expression by the liver is increased when a neonatal pig grows poorly, as in the runt pig or the pig which fails to thrive compared with its littermates, thus supporting further investigation for fetuin A as a marker for growth potential in young pigs. Second, this study showed that specific hormones, cytokines and antioxidants can regulate fetuin A gene expression in the liver either positively or negatively.
Introduction
Fetuin A, also known as α2-Heremans–Schmid glycoprotein, is a protein primarily expressed by the liver, although limited expression has been detected in other tissues (Robinson and Teran-Garcia, Reference Robinson and Teran-Garcia2016). In the pig, fetuin has been quantified by radial immunodiffusion to be a major plasma protein at day 50 of gestation ~3.5 mg/ml and gradually increases to ~5 mg/ml at birth where it comprises 18% of plasma proteins (Lampreave and Piñeiro, Reference Lampreave and Piñeiro1992). Martin et al. (Reference Martin, Tesouro, Gonz Am, Pi and Lampreave2005) demonstrated that fetuin A and α-1 acid glycoprotein account for the majority of plasma proteins in the neonatal pig. Plasma fetuin A concentrations were ~5.5 mg/ml in the neonatal pig and gradually declined to ~1.2 mg/ml at 6 months of age (Martin et al., Reference Martin, Tesouro, Gonz Am, Pi and Lampreave2005). The only study to examine the regulation of plasma fetuin A indicated that it does not respond to an inflammatory challenge in the pig (Lampreave et al., Reference Lampreave, González-Ramón, Martínez-Ayensa, Hernández, Lorenzo, García-Gil and Piñeiro1994). More recently, Caperna et al. (Reference Caperna, Shannon, Blomberg Le, Garrett and Ramsay2010) used proteomic/mass spectrophotometric analysis to demonstrate that fetuin A is elevated in the runt pig v. the normal sized littermate at birth. This raised the question of the potential regulation of the expression of fetuin A and its relationship to growth in the young pig. Research in other species has demonstrated that fetuin A may contribute to the regulation of osteogenesis through bone remodeling (Binkert et al., Reference Binkert, Demetriou, Sukhu, Szweras, Tenenbaum and Dennis1999; Szweras et al., Reference Szweras, Liu, Partridge, Pawling, Sukhu, Clokie, Jahnen-Dechent, Tenenbaum, Swallow, Grynpas and Dennis2002; Robinson and Teran-Garcia, Reference Robinson and Teran-Garcia2016), suggesting a role in the regulation of skeletal growth. In addition, fetuin A appears to inhibit insulin receptor autophosphorylation (Goustin et al., Reference Goustin, Derar and Abou-Samra2013), thus impairing insulin action on metabolism and mitogenesis supportive of growth.
The absence of a quantifiable assay for porcine fetuin A is due to lack of purified protein for a standard as fetuin A is not well conserved across species. Thus, evaluation of fetuin A mRNA abundance has value in helping to understand the regulation of fetuin A expression in the pig. The regulation of fetuin A gene expression by cytokines in other species has been documented (Daveau et al., Reference Daveau, Davrinche, Djelassi, Lemetayer, Julen, Hiron, Arnaud and Lebreton1988 and Reference Daveau, Davrinche, Julen, Hiron, Amaud and Lebreton1990; Ohnishi et al., Reference Ohnishi, Nakamura, Arakaki, Miyazaki and Daikuhara1994). However, hepatocellular expression of porcine fetuin A has not been previously reported. The present study was designed to examine the relationship of porcine fetuin A with growth rate in the pig and to elucidate the regulation of fetuin A expression by examining the hormonal and cytokine regulation of fetuin A mRNA abundance in hepatocytes prepared from neonatal piglets.
Methodology
Hepatocyte isolation
Care and treatment of all pigs in this study were approved by the Institutional Animal Care and Use Committee of the US Department of Agriculture. Four suckling crossbred female piglets from four different litters (5 to 22 days of age) were euthanized with a solution containing ketamine, telazol, xylazine and butorphanol. Laparotomy was performed, and livers were immediately excised; the left lateral lobe was removed, the portal vein was cannulated, and hepatocytes were isolated by a two-step collagenase digestion procedure as previously described (Caperna et al., Reference Caperna, Shannon, Garrett, Ramsay, Blomberg and Elsasser2013). Cell preparation was performed from 1 pig/week. Viability of hepatocyte preparations was 80.4±0.8% by trypan blue dye exclusion (n=4).
Hepatocyte culture
Hepatocytes (4.5×10⁶) were seeded into vented T-25 flasks (Corning Inc., Corning, NY, USA) precoated with bovine skin collagen (A10644-01; Life Technologies, Grand Island, NY, USA) and were maintained in William’s E medium as previously described (Caperna et al., Reference Caperna, Shannon, Garrett, Ramsay, Blomberg and Elsasser2013). Except where noted, all media, cell culture, and assay reagents were purchased from Sigma-Aldrich (St Louis, MO, USA). Recombinant cytokines used were tumor necrosis factor-α (TNFα) and porcine interleukin 6 (IL6) and interleukin 1β (IL1); R&D Systems, Minneapolis, MN, USA), quercetin (Calbiochem, San Diego, CA, USA), and porcine growth hormone (GH), a gift from the National Pituitary Agency. Basal Williams’ E medium was prepared with 0.1 mM β-mercaptoethanol, 10 mM 4-(2-hydroxyethyl)-1-piperazineethanesulfonic acid (HEPES), 10 nM Na2SeO3, 2 mM glutamine and antibiotics (gentamicin, penicillin, streptomycin and amphotericin B).
Cells were initially maintained in basal medium containing insulin-transferrin-selenium supplement and 10% fetal bovine serum (Atlanta Biologicals, Flowery Branch, GA, USA). After a 3-h attachment period, flasks were washed with warm HEPES-buffered saline (HBS) and replaced with the same basal medium containing 5% fetal bovine serum with insulin, transferrin and selenium. On the following day, flasks were washed twice with warm HBS, and serum-containing medium was replaced with 4.5 ml serum-free basal medium containing 1 mM carnitine, 0.01% dimethyl sulfoxide, 0.1% bovine serum albumin (BSA) 10 nM dexamethasone (DEX) and 1 ng/ml bovine insulin (control medium). The final incubation medium for all cultures contained 0.01% BSA. Experimental conditions were established in duplicate flasks, and all experiments were performed with cells from four different pigs; therefore, n=4 for each treatment. The concentrations of reagents used to establish experimental conditions were as follows: all cytokines (20 ng/ml); insulin, glucagon and GH (100 ng/ml); T3 (10−7 M) and DEX (10−6 M). In addition, we wished to evaluate several therapeutic reagents used to probe/modify redox and inflammatory processes in the induction and/or inhibition of fetuin A mRNA abundance including quercetin and resveratrol (100 mM); N-acetylcysteine (NAC, 1mM); and l-buthionine sulfoximine (BSO, 1 mM). Serum-free medium was added for 24 h and then experimental conditions were initiated to eliminate potential serum effects. All media were changed daily and all cultures were terminated ~72 h after the initiation of culture. Vitality of cells was still above 90% following 48 h of serum-free treatment. At termination, cell monolayers were washed twice with ice-cold glucose-free HBS. For the preparation of RNA, 2.0 ml TRIzol reagent (Invitrogen, Carlsbad, CA, USA) was added to each flask on ice, and the cell material was immediately scraped and stored at −80°C until RNA extraction.
Animal Procedures
Birth weights for pigs from eight litters (Large White×Poland China×Landrace) were obtained and subsequently weights were recorded every 2 days until day 21 of age when animals were weaned. Body weight changes were plotted and sex matched pairs of littermate pigs (six pairs of females, two pair of males) were identified based upon a divergence in growth rate ⩾50 g/day. These eight pairs of littermate pigs were obtained from eight different sows. Birth weights of selected pigs were within 1 SD of the mean litter birth weight to avoid using small for gestational age pigs. Pigs selected for this study were observed to be healthy, with no indications of less than optimal health.
In a separate study, runt and control littermates from four different sows of similar genetics (Large White×Poland China×Landrace) were collected at day 1 of age. Runt pigs were defined as born at <1 kg BW (Hegarty and Allen, Reference Hegarty and Allen1978), whereas sex-matched littermates were identified as those closest to the mean litter weight. In a third study, piglets (Large White×Poland China×Landrace) were weighed on day 1 and then were randomly assigned across litters for tissue collection at day 1, day 7 or day 21 of age or 6 months of age (n=6/group; three males and three females). For all experiments, castration was performed at 8 to 14 days of age.
All sampling was performed between 0900 and 1100 h and animals were only sampled in the fed state. Tissue sampling was performed following euthanasia induced with pentobarbital sodium (200 mg/kg) for piglets (21 days of age or less) or by electrical stunning and exsanguination for 6-month-old pigs. Care and treatment of all pigs were approved by the Institutional Animal Care and Use Committees of the US Department of Agriculture at Beltsville, MD. Liver samples were then collected from the middle lobe. Tissues were diced and frozen in liquid nitrogen immediately upon removal from the carcass and stored at −80°C for subsequent RNA extraction.
RNA isolation and real-time polymerase chain reaction analysis of gene expression
Cell samples harvested in TRIzol were thawed, and total RNA was isolated using Qiagen RNeasy spin columns (Qiagen, Valencia, CA, USA) according to the manufacturer’s protocol. Integrity of RNA was assessed via agarose gel electrophoresis, and RNA concentration was determined spectrophotometrically using UV absorbance (A) at A260. Further verification of RNA quality and quantity was performed using an Agilent 2100 Bioanalyzer (Agilent Technologies, Santa Clara, CA, USA).
Quantitative PCR for fetuin A in subcutaneous adipose tissue and liver of preweaning pigs
Quantitative PCR was used to determine the number of fetuin A mRNA molecules per molecule of cyclophilin present in liver or hepatocytes. Primers (Sense 5'-AGTGCACCGATCACACTACG-3'; Antisense 5'-CATCAGCAGCAGGAATGCTA-3') were aligned to the fetuin A sequence (Genbank accession no. X56021.1) published by Brown et al. (Reference Brown, Dziegielewska, Saunders, Christie, Nawratil and Müller-Esterl1992). The cyclophilin primers (Sense 5'-TAACCCCACCGTCTTCTT-3'; Antisense 5'-TGCCATCCAACCACTCAG-3') were published by (Salguero et al., Reference Salguero, Gil, Revilla, Gallardo, Arias and Martins2008) and were aligned to Genbank accession no. F14571. The PCR-derived fetuin A complementary DNA (cDNA) or cyclophilin cDNA were T/A cloned into the pGEM-T Easy plasmid (Promega, Madison, WI, USA) that was subsequently transformed into JM109 competent cells. The fetuin A/plasmid DNA and cyclophilin/plasmid DNA were purified with the Qiaprep® Spin Miniprep kit (Qiagen) according to the manufacturer’s instructions to establish a DNA stock for the standard curve of each respective gene. The plasmid DNA was linearized with Nco I or Nde I restriction enzymes (ThermoFisher Scientific, Waltham, MA, USA) based on insert orientation. Linearized plasmid was transcribed in vitro using MEGAscript kit (Life Technologies) utilizing T7 or Sp6 RNA polymerases for Nco I or Nde I linearized plasmids, respectively. Synthesized RNA was purified and concentration was evaluated on a NanoDrop 2000 Spectrophotometer (ThermoFisher Scientific). A copy number of specific RNA is sequence and length dependent and was calculated accordingly as described previously (Gilbert et al., Reference Gilbert, Wong, Vaughan and Webb2007). A dilution series of copy number 1011 to 102 molecules per microliter was performed in the presence of yeast tRNA at 66 µg/ml. The dilution series for the standard curves was reverse-transcribed in parallel with one microgram of total sample RNA using Superscript (Life Technologies, Carlsbad, CA, USA) as previously described (Blomberg et al., Reference Blomberg, Schreier, Guthrie, Sample, Vallet, Caperna and Ramsay2010).
For quantitative PCR, 7.5 ng RNA equivalents of cDNA were combined with fetuin A or cyclophilin specific-primers (100 pmol) in a 25 µl reaction volume and IQ™ SYBR® Green Supermix ( Bio-Rad, Hercules, CA, USA). Amplification was performed on the CFX96 thermocycler (Bio-Rad) with the following cycling conditions: denature; 30 seconds at 94 °C, annealing 30 s at 60 °C for fetuin A or 55 °C for cyclophilin, and extension for 60 s at 72 °C. The synthesis of a single PCR product was confirmed by melt curve and agarose gel analyses. Fetuin A and cyclophilin mRNA abundance in liver and hepatocyte cultures were quantified by this procedure. Data were expressed as molecules fetuin A per molecule cyclophilin.
Statistical analysis
Paired t test was used to perform comparisons between runt and control littermates and between fast and slow growing littermates. Ontogeny data and cell culture data were analyzed by ANOVA (SigmaPlot 12; SPSS Science, Chicago, IL, USA). Mean separation was analyzed using Student–Newman–Keuls test. Means were defined as different at P<0.05.
Results
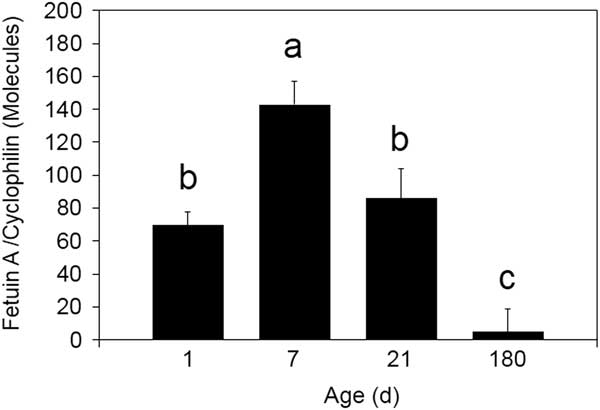
Fetuin A mRNA abundance increased between days 1 and 7 of age (P<0.05; Figure 1) and subsequently declined to day 21 (P<0.05). Pigs at 6 months of age expressed fetuin A mRNA at ~7% of the level at birth (P<0.001).
Ontogeny of fetuin A mRNA abundance in the liver of the young pig. Fetuin A mRNA abundance was measured by quantitative real-time PCR as described in the ‘Methodology’ section. Data are expressed as molecules fetuin A mRNA/molecule of cyclophilin. The standard curve for fetuin A had a slope of −3.112 and y intercept of 40.455 with an R 2=0.978. The standard curve for cyclophilin had a slope of −3.648 and y intercept of 39.071 with an R 2=0.998. a,b,c Means not sharing a common superscript letter are different (n=6; P<0.05).

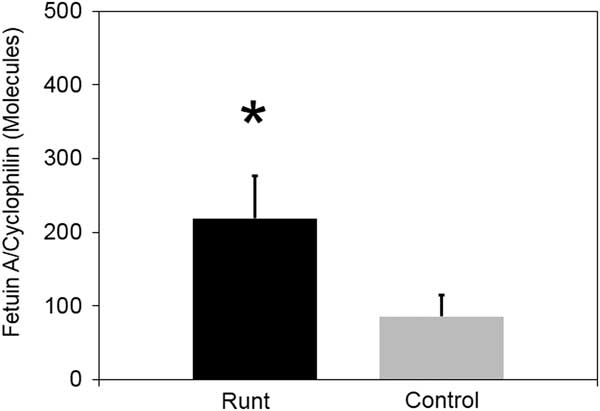
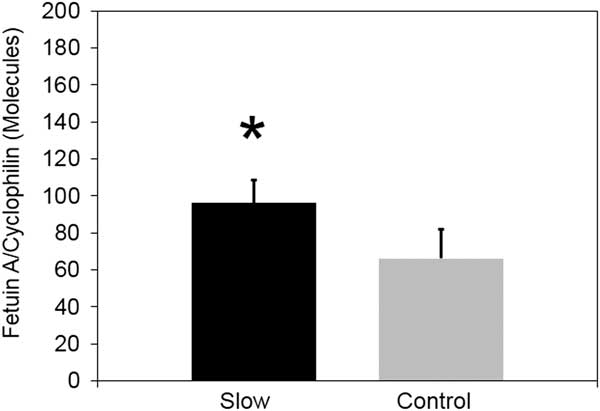
Runt pigs used in this study were born at a mean BW of 0.74±0.08 kg, whereas control littermates weighed 1.46±0.11 kg (P<0.01; n=4). Relative fetuin A mRNA abundance in the liver of runt pig was 154% greater than in normal sized littermates at birth (P<0.05; Figure 2). Similarly, fetuin A gene expression was higher in liver from the slow growing pig than its faster growing littermate (P<0.05; Figure 3). However the difference was only 31%, a much smaller difference than between runt and control piglets.
Comparison of fetuin A mRNA abundance in the liver of runt and control piglets at 1 day of age. Fetuin A mRNA abundance was measured by quantitative real-time PCR as described in the ‘Methodology’ section. Data are expressed as molecules fetuin A mRNA/molecule of cyclophilin. The standard curve for fetuin had a slope of −3.112 and y intercept of 40.455 with an R 2=0.978. The standard curve for cyclophilin had a slope of −3.648 and y intercept of 39.071 with an R 2=0.998. * Different from control by paired t test (n=4; P<0.05).

Comparison of fetuin A mRNA abundance in the liver of slow growing and control littermates at 21 days of age. Fetuin A mRNA abundance was measured by quantitative real-time PCR as described in the ‘Methodology’ section. Data are expressed as molecules fetuin A mRNA/molecule of cyclophilin. The standard curve for fetuin A had a slope of −3.112 and y intercept of 40.455 with an R 2=0.978. The standard curve for cyclophilin had a slope of −3.453 and y intercept of 37.685 with an R 2=0.996. * Different from control by paired t test (n=8; P<0.05).

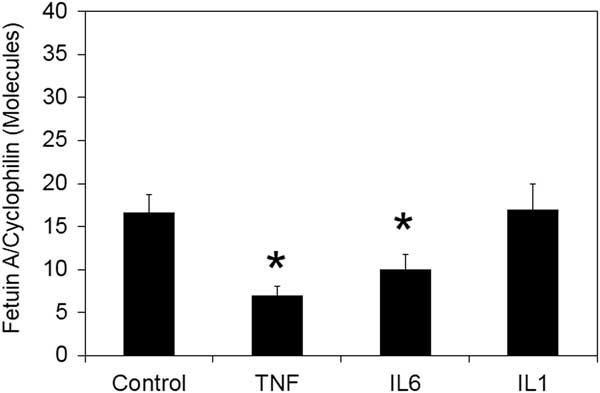
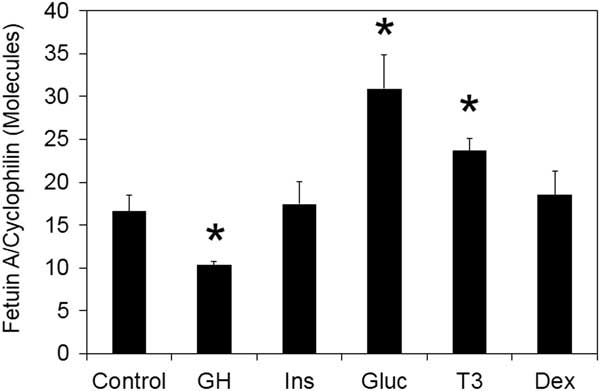
Isolated hepatocytes derived from another group of piglets of similar genetics were used to examine the regulation of fetuin A by various cytokines (Figure 4) and hormones (Figure 5). The cytokine TNFα reduced fetuin A mRNA abundance by 58% (P<0.01). Incubation for 24 h with the cytokine IL6 resulted in a 40% decrease in the fetuin mRNA abundance (P<0.05), whereas IL1β had no effect (P>0.05). Growth hormone reduced fetuin A mRNA abundance by 38%. Insulin had no effect (P>0.05), as did the combination of insulin and GH (data not presented). Glucagon produced a 86% increase in fetuin A gene expression. Triiodothyronine also increased fetuin A mRNA abundance (P<0.05), whereas no effect of dexamethasone was detected (P>0.05).
Fetuin A mRNA abundance in porcine hepatocytes in response to cytokines. Isolated porcine hepatocytes in culture were incubated with test medium for 24 h before collection of cells for RNA extraction. Fetuin A mRNA abundance was measured by quantitative real-time PCR as described in the ‘Methodology’ section. Data are expressed as molecules fetuin A mRNA/molecule of cyclophilin. The standard curve for fetuin A had a slope of −2.917 and y intercept of 39.294 with an R 2=0.966. The standard curve for cyclophilin had a slope of -3.404 and y intercept of 37.940 with an R 2=0.993. TNF=tumor necrosis factor; IL-interleukin. * Different from control by ANOVA (n=4; P<0.05).

Fetuin A mRNA abundance in porcine hepatocytes in response to hormones. Isolated porcine hepatocytes in culture were incubated with test medium for 24 h before collection of cells for RNA extraction. Fetuin A mRNA abundance was measured by quantitative real-time PCR as described in the ‘Methodology’ section. Data are expressed as molecules fetuin A mRNA/molecule of cyclophilin. The standard curve for fetuin A had a slope of −2.933 and y intercept of 39.509 with an R 2=0.974. The standard curve for cyclophilin had a slope of −3.492 and y intercept of 38.360 with an R 2=0.991. GH=growth hormone. * Different from control by ANOVA (n=4; P<0.05).

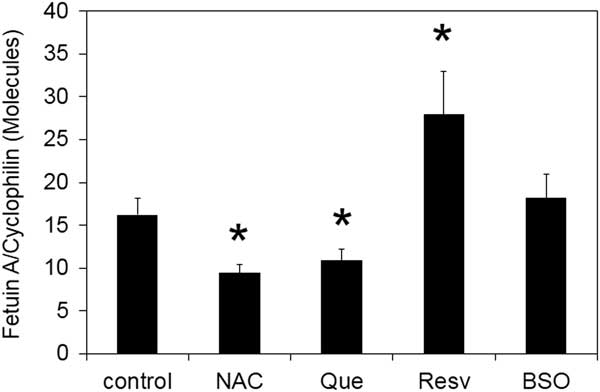
Use of antioxidants and other metabolic modifiers also had an effect on fetuin A gene expression (Figure 6). The antioxidant N-acetylcysteine reduced fetuin A mRNA abundance by 42% (P<0.05). Quercertin also reduced fetuin A gene expression (P<0.05). In contrast, resveratrol induced a 72% increase in the fetuin A expression relative to cyclophilin (P<0.01), whereas BSO had no effect (P>0.05).
Fetuin A mRNA abundance in porcine hepatocytes in response to metabolic modifiers. Isolated porcine hepatocytes in culture were incubated with test medium for 24 h before collection of cells for RNA extraction. Fetuin A mRNA abundance was measured by quantitative real-time PCR as described in the ‘Methodology’ section. Data are expressed as molecules fetuin A mRNA/molecule of cyclophilin. The standard curve for cyclophilin had a slope of −3.492 and y intercept of 38.360 with an R 2=0.991. * Different from control by ANOVA (n=4; P<0.05).

Discussion
The interest in fetuin A originated when Caperna et al. (Reference Caperna, Shannon, Blomberg Le, Garrett and Ramsay2010) reported that runt pigs have higher plasma levels of fetuin A at birth than normal sized littermates, based upon proteomic analysis. This raised the question of the potential for fetuin A to be a marker for growth in the fetal and newborn pig. As previously mentioned, the lack of purified pig fetuin A prevents the development of an ELISA or RIA to quantify the protein and therefore we must rely on gene expression. The present study corroborates the data of Caperna et al. (Reference Caperna, Shannon, Blomberg Le, Garrett and Ramsay2010) as the fetuin A mRNA abundance is higher in the runt pig liver than in the control pig. Similarly, the slow growing pig which reaches a weaning weight of ~1.5 kg less than its normal growth littermate (Caperna et al., Reference Caperna, Shannon, Garrett, Ramsay, Blomberg and Elsasser2013) also has a higher fetuin A mRNA abundance. Therefore, these models of impaired growth in the pig suggest elevated hepatic fetuin A mRNA abundance is associated with poor potential for postnatal growth in the pig.
The effect of sex steroids can be excluded in these first two studies as litter pairs comprising the groups were sex matched. Previous research has indicated that both estrogen and testosterone can increase the mRNA abundance for fetuin A (Qiu et al., Reference Qiu, Liu, Wang, Zhao and Fu2014; Voelkl et al., Reference Voelkl, Pakladok, Lin, Viereck, Lebedeva, Kukuk, Pichler, Alesutan and Lang2014). However, the data from the ontogeny study may suggest a role for sex steroids as the males were castrated between 8 and 14 days of age. Therefore, the reduction in testosterone with castration may contribute to the decline in fetuin A mRNA abundance between days 7 and 14.
Fetuin A is expressed by several tissues in the fetus, but postnatally is primarily expressed by liver (Yang et al., Reference Yang, Chen, Bergeron, Cupples and Friedrichs1992). Expression in the liver undergoes some transitory changes during the early neonatal period followed by a decline as the pig ages through 6 months of age. This parallels the change in plasma fetuin A with age in the pig (Martin et al., Reference Martin, Tesouro, Gonz Am, Pi and Lampreave2005). A similar change has been observed in fetuin A mRNA abundance in the mouse liver (Yang et al., Reference Yang, Chen, Bergeron, Cupples and Friedrichs1992; Salier et al., Reference Salier, Chan, Raguenez, Zwingman and Erickson1993). This suggests that fetuin A’s usefulness as a predictor of growth potential may be limited to preweaning growth, but this requires further investigation.
The potential factors that contribute to the regulation of hepatic fetuin A expression in the pig may be quite numerous. The present study limited itself to cytokines reported to affect fetuin A mRNA abundance or plasma fetuin A concentrations. The hormones that were evaluated are all known to significantly impact liver metabolism and/or growth in the pig.
The decrease in fetuin A mRNA abundance in response to the inflammatory cytokines TNFα and IL6 would suggest that fetuin A is a negative acute phase protein in swine as in the human (Daveau et al., 1988; Akhoundi et al., Reference Akhoundi, Amiot, Auberger, Le Cam and Rossi1994; Memoli et al., Reference Memoli, De Bartolo, Favia, Morelli, Lopez, Procino, Barbieri, Curcio, Giorno, Esposito, Cozzolino, Brancaccio, Andreucci, d’Agostino and Drioli2007) and rodent (Daveau et al., Reference Daveau, Davrinche, Julen, Hiron, Amaud and Lebreton1990), despite the absence of response to a turpentine challenge in an early study (Lampreave et al., Reference Lampreave, González-Ramón, Martínez-Ayensa, Hernández, Lorenzo, García-Gil and Piñeiro1994). This is aligned with its function as a serine protease inhibitor during the inflammatory response (Yamamoto and Sinohara, Reference Yamamoto and Sinohara1993; Yoshida et al., Reference Yoshida, Suzuki, Yamamoto and Sinohara1996). A reduction in fetuin A expression would be expected with inflammation as elevated protease activity is necessary during phagocytosis by macrophages during the inflammatory response. Resveratrol is an anti-inflammatory polyphenol that stimulated fetuin A expression in pig hepatocytes. Resveratrol functions in part by inactivation of nuclear factor-κB (Muriel, Reference Muriel2009), a key inflammatory pathway regulator. Tumor necrosis factor-α activates nuclear factor-κB in piglet hepatocytes (Caperna et al., Reference Caperna, Shannon, Garrett, Ramsay, Blomberg and Elsasser2013) and inhibited fetuin expression in the present study, suggesting resveratrol may be inhibiting nuclear factor-κB in piglet hepatocytes. The absence of response to IL1β was unexpected, as an inhibition of fetuin A expression in the rodent has been previously reported (Daveau et al., Reference Daveau, Davrinche, Julen, Hiron, Amaud and Lebreton1990; Akhoundi et al., Reference Akhoundi, Amiot, Auberger, Le Cam and Rossi1994), suggesting a difference in response between species or perhaps due to differences in culture conditions.
Brylka and Jahnen-Dechent (Reference Brylka and Jahnen-Dechent2013) have proposed that fetuin A regulates endochondral ossification through mineralization inhibition and thus promoting bone growth. This was based on the observation that fetuin A knockout mice show impaired growth of their long bones and premature growth plate closure (Seto et al., Reference Seto, Busse, Gupta, Schäfer, Krauss, Dunlop, Masic, Kerschnitzki, Zaslansky, Boesecke, Catalá-Lehnen, Schinke, Fratzl and Jahnen-Dechent2012). Thus fetuin A promotes bone growth and an inhibition in fetuin A gene expression in pig hepatocytes by GH appears counterintuitive to fetuin’s involvement in bone formation and growth. Without plasma GH concentrations available for comparison between runt and control pigs or slow growing v. normal pigs, it can only be speculation for a role for plasma GH in the regulation of fetuin A expression in these swine with impaired growth. Many of GH’s actions at the liver are through inducing the paracrine secretion of IGF1 and/or IGF2 and the IGF binding proteins. The IGF axis was not examined in the present study, but GH may be functioning through paracrine IGFs or their binding proteins to alter fetuin A expression. This certainly requires further investigation as the role of the IGF axis in regulation of fetuin A is unknown.
Elevated plasma fetuin A concentrations have been reported in hyperthyroidism and fetuin A levels decrease with euthyroidism (Pamuk et al., Reference Pamuk, Yilmaz, Topcuoglu, Bilgir, Çalan, Pamuk and Ertugrul2013). In contrast, plasma fetuin A concentrations are lower in hypothyroid subjects but return to normal levels with thyroxine treatment (Bakiner et al., Reference Bakiner, Bozkirli, Ertugrul, Sezgin and Ertorer2014). Those studies suggest that thyroid hormones play an important role in regulating fetuin A homeostasis. The present study supports those observations by demonstrating that T3 stimulates an increase in the relative abundance of fetuin A mRNA.
Akhoundi et al. (Reference Akhoundi, Amiot, Auberger, Le Cam and Rossi1994) reported that insulin did not affect fetuin A protein synthesis. The present data are in agreement as no change in fetuin A mRNA abundance was observed in swine hepatocytes. In contrast, glucagon stimulated fetuin A gene expression. Elevated glucose concentrations have been shown to stimulate fetuin A protein expression in HepG2 cells and enhance promoter activity through the ERK 1/2 signaling pathway (Takata et al., Reference Takata, Ikeda, Suehiro, Ishibashi, Inoue, Kumon and Tereda2009). Whether glucose produced by glycogenolysis and gluconeogenesis through the action of glucagon in the localized environment of the isolated pig hepatocyte in vitro is sufficient to promote fetuin expression is not known, but the present data suggest further investigation is necessary.
Hyperglycemia induces endoplasmic reticulum (ER) stress (Ozcan et al., Reference Ozcan, Yilmaz, Ozcan, Furuhashi, Vaillancourt, Smith, Görgün and Hotamisligil2006; Werstuck et al., Reference Werstuck, Khan, Femia, Kim, Tedesco, Trigatti and Shi2006; Boden et al., Reference Boden, Song, Duan, Cheung, Kresge, Barrero and Merali2011). Ou et al. (Reference Ou, Wu, Hung, Yang, Wu and Chang2012) demonstrated that the ER stress activator thapsigargin can increase fetuin A mRNA abundance and protein concentration in HepG2 cells, whereas the ER stress inhibitor 4-phenylbutyrate could reduce hyperglycemic-induced ER stress and reduce fetuin A mRNA abundance and protein concentration in these cells. N-acetylcysteine is the precursor to glutathione, a key antioxidant in the hepatocyte, and has been used to increase intracellular glutathione concentrations to thereby reduce oxidative stress (Rushworth and Megson, Reference Rushworth and Megson2014). Quercetin is a polyphenol antioxidant that has been shown to also block nuclear factor-κB activation in rat hepatocytes (Martínez-Flórez et al., Reference Martínez-Flórez, Gutiérrez-Fernández, Sánchez-Campos, González-Gallego and Tuñón2005). Both of these antioxidants reduced fetuin A mRNA abundance in pig hepatocytes, indicating that oxidative stress may regulate fetuin A gene expression in the pig. Elevated hepatic oxidative stress has been observed in the liver of the runt pig (Wang et al., Reference Wang, Wu, Li, Li, Dindot, Satterfield, Bazer and Wu2012; Che et al., Reference Che, Xuan, Hu, Liu, Xu, Fang, Lin, Xu, Wu, Zhang and Chen2015) and in the liver of the slow growing pig (Ramsay et al., Reference Ramsay, Stoll, Blomberg and Caperna2016), implying that increasing antioxidant levels in young pigs may contribute to improved growth rate while reducing fetuin A expression.
In summary, this is the first study to examine the regulation of fetuin A in porcine hepatocytes where glucagon, T3 and resveratrol were demonstrated to be positive regulators of fetuin A mRNA abundance. GH, cytokines (IL6, TNFα) and antioxidants (NAC, quercertin) had negative effects on fetuin A gene expression. A role for fetuin A in postnatal development is suggested by the differences in fetuin A mRNA abundance between runt piglets, slow growing piglets and their normal growing and sized littermates. The mechanisms responsible for this relationship between growth and fetuin A are currently under investigation.
Acknowledgments
The authors thank Amy Shannon for assistance in performing the cell culture procedures. The authors also thank Jenile Tapscott, James Woods and Russ Lange for assistance in maintaining and handling experimental animals. This research did not receive any specific grant from funding agencies in the public, commercial, or not-for-profit sectors.