INTRODUCTION
Given the effect of greenhouse gas (GHG) emissions on climate change, mitigation of methane (CH4) and nitrous oxide (N2O) emissions from dairy systems has gained importance in recent years. Bell et al. (Reference Bell, Eckard, Haile-Mariam and Pryce2013a ) adapted and developed an existing dairy Breeding Objectives Model, a dynamic model used to calculate economic values for breeding objectives, to include nutrient partitioning to allow investigation of GHG abatement options over a cow's lifetime. Tools such as this are needed by the dairy industry to make informed changes that are economically viable and environmentally sustainable. The losses of dietary energy in the form of CH4, as well as nitrogen (N) in manure, are significant inefficiencies associated with dairy production and sources of pollution (FAO 2010).
In the UK, the traditional dairy system is for cows to graze pasture during the summer months, with conserved forage and concentrate feed as supplements in summer and sole ration components in winter, to achieve the genetic potential of the cow for milk production. Although GHG emissions from dairy systems account for <0·02 of the UK's total annual GHG emissions (Brown et al. Reference Brown, Cardenas, MacCarthy, Murrells, Pang, Passant, Thistlethwaite, Thomson and Webb2010), improvements in efficiency of milk production, which can be made immediately through feeding and management changes or in the medium to long-term by breeding, are considered an effective means of minimizing the environmental impact and increasing profitability of dairy systems (Bell et al. Reference Bell, Eckard, Pryce and Javed2012). Breeding is a cost-effective means of abating emissions in the medium to long-term (Moran et al. Reference Moran, Barnes and McVittie2007).
Although heritabilities of fitness (health and fertility) traits can be low compared to production traits, the large coefficient of genetic variation for traits such as mastitis (0·33) and lameness (0·45) suggests there is considerable potential for genetic improvement (Pritchard et al. Reference Pritchard, Coffey, Mrode and Wall2013). Pritchard et al. (Reference Pritchard, Coffey, Mrode and Wall2013) found the coefficient of genetic variation in the recorded UK dairy population to range from 0·11 to 0·13 for moderately heritable milk production traits, but to be as low as 0·03 for somatic cell count (SCC) and calving interval. Bell et al. (Reference Bell, Eckard, Haile-Mariam and Pryce2013a ) showed that improved efficiencies of production associated with health and fertility (and overall survival), as well as feed efficiency, could reduce GHG emissions from Australian dairy herds. In the UK, Bell et al. (Reference Bell, Wall, Russell, Simm and Stott2011) modelled an experimental herd to assess the effect of changing a range of biological traits but the experimental design limited full expression of survival, and possibly health and fertility incidences as well. The present study used a more comprehensive modelling approach to assess variation in biological traits, including fitness and feed efficiency traits, in the UK national dairy population.
The objectives of the present study were: (1) to model changes in profit and GHG emissions in response to changes in biological traits for the average milk-recorded dairy herd in the UK, (2) to assess the effect of a unit change in a range of production and fitness traits on profit per cow, GHG emissions per cow and per kg milk solids (MS) for the average dairy herd and (3) to assess the annual economic responses to selection and reduction in emissions per cow and per kg MS from selection on multiple traits.
MATERIALS AND METHODS
Data
A model used in Australia to calculate economic values for dairy breeding objectives (Visscher et al. Reference Visscher, Bowman and Goddard1994; Pryce et al. Reference Pryce, van der Werf, Haile-Mariam, Malcolm and Goddard2009) was adapted and developed by Bell et al. (Reference Bell, Eckard, Haile-Mariam and Pryce2013a ) to model GHG emissions from a dairy herd. For a full description of the Breeding Objectives Model see Bell et al. (Reference Bell, Eckard, Haile-Mariam and Pryce2013a ). Briefly, the model was constructed in Microsoft Excel to calculate changes in profit per cow in response to changes in biological traits. For the present study, the model was extended to include changes in GHG emissions per cow and per kg MS due to a management or genetic change. Responses were quantified by calculating differences between the current state (baseline situation) and a positive or negative change in a biological trait (adjusted situation). The extended model was used in the present study to dynamically represent the average milk-recorded UK dairy herd (referred to as the average herd) and to assess effects of changes in biological traits.
Herd structure
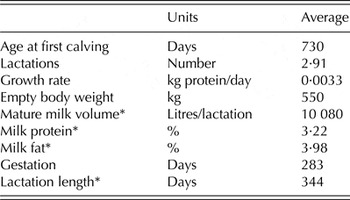
A total of 13 age groups were modelled, which included the period between birth and first calving for herd replacements, and 12 lactations. Replacement animals were assumed to calve at 2 years of age, with cows surviving for an average of 2·9 lactations which is in accordance with recent UK estimates (Table 1). It was assumed that all births resulted in a single live calf, and that 0·50 of calves were male and 0·50 female. The only animals to leave the system were cull cows, male calves and surplus female calves. All calves sold were assumed to leave the system immediately after birth (and contribute no GHG emissions to the system). This assumption ignores the effect of calf mortality, which was assumed to be the same in both the baseline and altered situations.
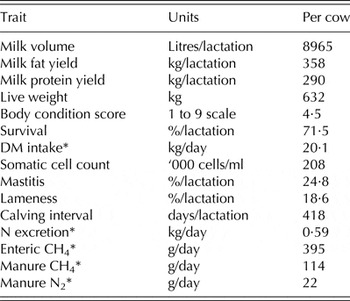
Production values included in the model for an average cow in the UK

* From CDI (http://ukcows.com/thecdi, accessed 21 February 2013).
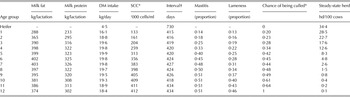
Herd structure was derived using a Markov chain approach. A Markov chain can be used to describe the herd as a vector of states (s) that cows occupy at a given point in time (Stott et al. Reference Stott, Veerkamp and Wassell1999), which in the present study was each age group. The vector of states at time t is multiplied by a matrix of transition probabilities (s×s) to give the vector of states at time t+1. The probability of a cow progressing to the next lactation (from lactation n to n+1 and from lactation 1 to n) was dependent on the chance of a cow being culled during the current lactation (Table 2). If the transition matrix is constant for all stages; that is, the model is stationary, then repeated matrix multiplication will produce a fixed long-run vector (steady-state), which is independent of the initial state vector. This long-run steady-state vector provides a useful basis for comparative assessment of alternative herd structures, i.e. a change in the number of cows in each age group, as shown in Table 2. The number of replacements required to maintain the average herd structure was 34·4 animals per lactation in a 100 cow herd. For simplicity individual cow values were multiplied by 100 to represent a herd of 100 cows.
Modelled average milk fat yield, milk protein yield, DM intake, SCC, calving interval, mastitis incidence, lameness incidence, survival and long-run steady state for a 100 cow herd from the Markov chain for an average herd in the baseline situation for a heifer replacement and lactations 1–12

* From CDI (http://ukcows.com/thecdi, accessed 21 February 2013).
† Heifers assumed to enter the milking herd at 730 days of age, with calving intervals obtained from CDI (http://ukcows.com/thecdi, accessed 21 February 2013).
Energy requirements, feed intake and live weight
It was assumed that energy requirements (of milking cows and herd replacements) for maintenance, growth, pregnancy, activity and lactation were achieved and that feed intake was always sufficient to achieve energy requirements in the baseline situation.
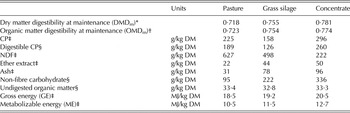
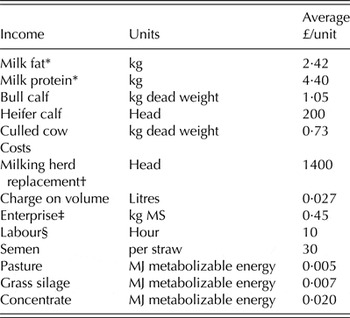
The diet composition of a lactating cow was calculated based on the average animal (Table 1) using the FeedByte® rationing model version 3.78 (available at http://www.sruc.ac.uk/info/120110/dairy/354/dairy_services-key_features), which calculates a least-cost ration that meets the energy, protein and mineral requirements of the animal. The ration was formulated from pasture, grass silage and dairy concentrate based on their nutrient composition (Table 3) and cost (Table 4). The diet was constrained to a maximum of 500 g pasture per kilogram of fresh feed. The lactating cow diet consisted of 340 g pasture, 320 grass silage and 340 g dairy concentrate per kilogram dry matter (DM) intake per lactation (Table 3), at an estimated cost of £0·086 per litre of milk. This diet was considered representative of a typical UK feeding system (Wilkinson & Audsley Reference Wilkinson and Audsley2013). A milking herd replacement (growing heifer) was assumed to be fed a diet of 500 g pasture and 500 g grass silage per kilogram of fresh feed. The cost of feed consumed by each age group was estimated by multiplying total DM intake by metabolizable energy (ME) content and cost per unit ME of the diet (Table 4). A unit reduction in DM intake assumed that ME requirement of the animal remained constant in the baseline and adjusted situations, but ME intake and associated cost of consumed feed were lower to represent an improvement in residual feed intake.
Assumed nutrient composition of pasture, grass silage and dairy concentrate

* Using equation of Minson & McDonald (Reference Minson and McDonald1987).
† Estimated from Rowett Feedingstuffs Evaluation Unit Third Report data (Wainman et al. Reference Wainman, Dewy and Boyne1981) as: OMDm=0·1436+1·0183×(ME/GE).
‡ From Bell et al. (Reference Bell, Wall, Russell, Simm and Stott2011), except for ether extract from FeedByte® model.
§ Digestible CP (g/kg DM)=CP−(((0·3×(1−(DMDm+0·1)))×CP)+(0·105×ME×0·008)+0·0152); Non-fibre carbohydrate=1000−(NDF+ash+crude protein+ether extract); undigested organic matter=reciprocal of undigested organic matter plus ash content (g/kg DM) of feed at maintenance intake level.
Assumed income and costs associated with production for an average herd obtained from Redman (Reference Redman2012)

* Based on milk compositions for milk fat and protein in Table 1 and an average price of 24 pence per litre of milk.
† Feed costs were deducted to give a non-feed cost associated with a milking herd replacement in the model.
‡ Herd test, animal health, housing and dairy supplies.
§ Assumed cost of 30 min per artificial insemination, 50 min per case of severe and fatal clinical mastitis (P. Down, The University of Nottingham, Sutton Bonington, UK, personal communication) and 15 min for digital lameness, 12 min for interdigital lameness and 20 min per case of sole ulcer lameness (Kossaibati & Esslemont Reference Kossaibati and Esslemont1997).
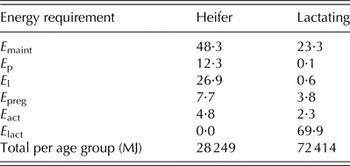
Metabolizable energy (ME, MJ/day) required for maintenance (E maint), gain or loss of body protein (E p) and lipid (E l), pregnancy (E preg), activity (E act) and lactation (E lact) for the average cow are presented in Table 5. The effective energy system proposed by Emmans (Reference Emmans1994) was used to estimate feed intake. Feed intake of an animal was calculated from total ME requirement and the net energy supplied by the food consumed:
 $$\eqalign{& {\rm Feed\, intake\, (kg\, DM/day)} =\cr &\quad E_{{\rm total}} \times 1/({\rm ME} - 0 {\cdot} 616\times (E_{{\rm CH4}} \times {\rm GE}) \cr &\quad - (3 {\cdot} 8/20 \times ({\rm FE} \times GE)) - 29 {\cdot} 2\times ({\rm DCP}/6 {\cdot} 25))} $$
where ME, GE, FE and E CH4 is the metabolizable, gross, faecal and enteric CH4 energy (all MJ/kg DM). The values of 0·616 and 3·8 are the heat increments associated with fermentation and faeces production, and energy lost in faeces was assumed to be 20 MJ/kg faeces DM. Excretion of urine leads to a loss of digestible crude protein (DCP) (Emmans Reference Emmans1994). Residual feed intake (RFI) is defined as the difference between actual and predicted feed intake. Residual feed intake represents variation in efficiency of metabolic processes, which is independent of the animal's body size and production level; which for example, can be estimated from regression of DM intake against mean body weight and growth rate in heifers (Williams et al. Reference Williams, Pryce, Grainger, Wales, Linden, Porker and Hayes2011). The economic value for RFI is the cost of increasing marginal feed costs by one unit whereas all other traits are held constant. So, even if feed intake is sufficient, an animal that eats less will be more profitable at the same level of milk production and fitness.
Percentage of total energy (% of ME) for a heifer replacement and the average lactating dairy cow for maintenance (Emaint), protein growth (Ep), lipid growth (El), pregnancy (Epreg), activity (Eact) and milk production (Elact) over a lifetime

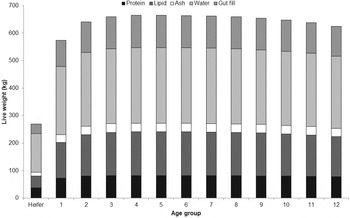
The animal's live weight was assumed to be its empty body weight (kg of protein, lipid, water and ash) plus gut fill. Figure 1 shows the live weight and body composition of the average cow assumed in this study with a mature empty body weight of 550 kg. The body condition score of the cow was estimated from body lipid using the equation of Wright (Reference Wright1982) and converted to a 1 to 9 point scale (NRC 2001) for the present study using the following formula:
 $$\eqalign{& {\rm Body\, condition\, score}\, (1\,{\rm to}\, 9\,{\rm scale}) = \cr & \quad(({\rm Body\,lipid}\,\% \times 0 {\cdot} 12 + 0 {\cdot} 36) - 1) \times 2 + 1}$$
Average mass of protein, lipid, ash, water and gut fill in the live weight of an average heifer replacement and a dairy cow from lactations 1–12 with a mature empty body weight of 550 kg.

The average live weight of a cow was estimated to be 632 kg, with a body condition score of 4·5 on a 9-point scale (Table 6). Gut fill was assumed to equate to the water held by dietary fibre content and estimated as 13·2 times the intake of neutral-detergent fibre (NDF) (kg/day) (Takeda & Kiriyama Reference Takeda and Kiriyama1979).
Average values per cow for production and fitness traits, and N excretion, enteric and manure CH4 and N2O emissions for a long-run steady state herd

* Includes contribution from herd replacements.
Calculation of yields per cow lactation
Data for average number of days for each lactation, milk production at maturity and milk composition were obtained for the year 2011/12 from the Centre for Dairy Information (http://ukcows.com/thecdi, accessed 21 February 2013), which collates data from recorded dairy cows in all regions of the UK (Table 1).
The total amount of milk produced during each lactation was estimated by multiplying the milk production at maturity from the CDI data by the proportion of mature productivity for each lactation. The proportion of mature productivity was calculated to be E maint−(E p+E l)/maximum of E maint−(E p+E l) across lactations (Bell et al. Reference Bell, Eckard, Haile-Mariam and Pryce2013a ). Mature productivity of milk was reached at four lactations for the average cow (information obtained from CDI, http://ukcows.com/thecdi, accessed 21 February 2013). Amounts of milk protein, fat and lactose produced were calculated based on milk fat and protein content (Table 1) and an assumed milk content of 0·05 lactose. Average yields per lactation were 8965 litres of milk, 358 kg of fat and 290 kg of protein (Table 6).
Greenhouse gas emissions
Sources of GHG emissions were from enteric and manure CH4, and direct (from stored manure and application of dung, urine and manure) and indirect N2O from storage and application of manure to land (from leaching and atmospheric deposition of nitrogen from nitrogen oxides (NOx) and ammonia (NH3)) as attributed in the UK National GHG Inventory for agricultural production (Brown et al. Reference Brown, Cardenas, MacCarthy, Murrells, Pang, Passant, Thistlethwaite, Thomson and Webb2010). Emissions were expressed as carbon dioxide equivalent (CO2-eq.) emissions per cow, and per kilogram of MS; the functional units as defined by Guinée et al. (Reference Guinée, Gorree, Heijungs, Huppes, Kleijn, de Koning, van Oers, Wegener Sleeswijk, Suh, Udo de Haes, de Bruijn, van Duin, Huijbregts, Lindeijer, Roorda, van der Ven and Weidema2002). Kilograms of CO2-eq. emissions for a 100-years time horizon were calculated using conversion factors from CH4 to CO2-eq of 25 and from N2O to CO2-eq of 298 (Forster et al. Reference Forster, Ramaswamy, Artaxo, Berntsen, Betts, Fahey, Haywood, Lean, Lowe, Myhre, Nganga, Prinn, Raga, Schulz, Van Dorland, Solomon, Qin, Manning, Chen, Marquis, Averyt, Tignor and Miller2007).
Enteric CH4 emissions were estimated per kg DM intake by the equation (Bell et al. Reference Bell, Eckard, Moate, Craigon and Garnsworthy2013b ) based on the composition of the diet (Table 3) as:
 $$\eqalign{& {\rm CH}_ 4 \, ({\rm g/kg\,DM\, intake}) = \cr &\quad0 {\cdot} 05642 \times {\rm DOMD}_{\rm p} - 0 {\cdot} 1986 \times {\rm EE} - 0 {\cdot} 009214 \cr &\quad\times {\rm NFC} - 2 {\cdot} 698\times (1000/[1000 - {\rm DOMD}_{\rm m}])} $$
where DOMDp and DOMDm are digestible organic matter at the production and maintenance intake levels, EE is ether extract, and NFC non-fibre carbohydrate (all g/kg DM). The DOMDp and DOMDm contents were estimated from the organic matter concentration of the diet (g/kg DM) multiplied by digestibility of organic matter at the production (OMDp) and maintenance intake level (OMDm). The OMDp was estimated by the equation of Huhtanen et al. (Reference Huhtanen, Rinne and Nousiainen2009) as:
 $${\rm OMD}_{\rm p} = (257 + 685 \times {\rm OMD}_{\rm m} - 2 {\cdot} 6 \times {\rm DM\, intake\, (kg/day}))/1000$$
where OMDm is the digestibility of organic matter at the maintenance intake level. The CH4 emissions per kg DM intake were converted to emissions as a proportion of feed GE in the model, which meant CH4 emissions were c. 0·068 of GE for the pasture/silage diet fed to a herd replacement and 0·056 of GE for the pasture/silage/concentrate diet of a lactating cow. This corresponds well with the loss of CH4 per % of feed GE of 6·5±1% proposed by IPCC (Reference Eggleston, Buendia, Miwa, Ngara and Tanabe2006) for high to low forage diets for dairy cows and UK GHG inventory values (Brown et al. Reference Brown, Cardenas, MacCarthy, Murrells, Pang, Passant, Thistlethwaite, Thomson and Webb2010). Estimated annual emissions (from Table 6) for CH4 (144 kg/year for enteric and 42 kg/year for manure) and N2O (8 kg/year) were higher than in the UK GHG inventory. Data in the present study were from recorded cows, which are typically selected for improved production. Losses of CH4 and N2O emissions were estimated using linear relationships for all biological traits except survival (a curvilinear relationship with survival is generated by the Markov chain).
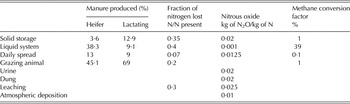
The IPCC (Reference Eggleston, Buendia, Miwa, Ngara and Tanabe2006) Tier II methodology was used to predict manure CH4 and N2O emissions (from N excretion) for manure handling systems, as well as manure deposited on pasture. The N excreted by the animal was partitioned into dung (N intake−digested N intake) and urine (N intake−(N retained+N in dung)). Emission factors for manure CH4 and N2O are shown in Table 7. Based on UK GHG inventory values the following were fixed in the calculations: CH4 conversion factor of 0·662 m3/kg CH4 and CH4 producing capacity of manure of 0·24 m3/kg volatile solids (Brown et al. Reference Brown, Cardenas, MacCarthy, Murrells, Pang, Passant, Thistlethwaite, Thomson and Webb2010). Volatile solids in manure were calculated from the undigested organic matter (1−digestible organic matter kg/kg).
Assumed percentage of manure produced by management system for a herd replacement and lactating cow for an average system, and emission factors used to calculate the GHG emissions (Brown et al. Reference Brown, Cardenas, MacCarthy, Murrells, Pang, Passant, Thistlethwaite, Thomson and Webb2010)

Fertility
All cows were assumed to be artificially inseminated. The average number of inseminations per cow was calculated as:
 $$\eqalign{& {\rm No. \;of\; inseminations} = \cr & \quad 1\! +\! (({\rm calving\; interval\; (days)} \! -\! ({\rm gestationlength\; (days)}\cr & \quad + {\rm start\; of\; oestrus\; (days)))/21)}}$$
where the start of an oestrous cycle was assumed to be 426 days after birth for a replacement heifer and 82 days after calving for a lactating cow. Gestation length was assumed to be constant at 283 days (Table 1). This allows for a replacement to enter the herd at 730 days of age and a milking cow to have a 365 day calving interval. Calving interval was determined from the average lactation length plus the drying off period (Table 2). The cost of poor fertility was calculated from the cost of each insemination (labour cost per h/2+semen straw cost; Table 4), the additional feed consumed by a milking cow and the cost of a milking herd replacement per extra day required.
Mastitis and lameness
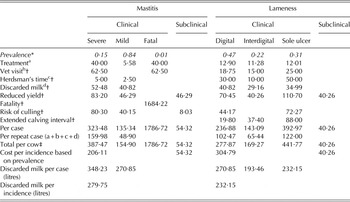
Along with poor fertility, mastitis and lameness are considered to be two of the most costly health problems in dairy cattle and are therefore included in the model. The proportion of cows in each lactation that had mastitis (Table 2) was calculated using a cumulative normal distribution with a mean log transformed SCC of 400 000 somatic cells/ml (de Haas et al. Reference de Haas, Veerkamp, Barkema, Gröhn and Schukken2004). A linear extrapolation of the data of Rutherford et al. (Reference Rutherford, Langford, Jack, Sherwood, Lawrence and Haskell2009) provided the increase in incidence of lameness with parity (Table 2). A cow with mastitis and lameness had an associated cost for treatment and loss of milk (Appendix). For mastitis, 0·3 incidences were assumed to be clinical cases; for lameness, 0·25 were assumed to be clinical cases; the remainder were assumed to be subclinical cases. A case of clinical mastitis was assumed to cost £206 per incidence and subclinical £54, which is consistent with costs reported by Heikkilä et al. (Reference Heikkilä, Nousiainen and Pyörälä2012). A case of clinical lameness was assumed to cost £305 per incidence and subclinical £40, which is consistent with costs reported by Willshire & Bell (Reference Willshire and Bell2009). The costs of mastitis and lameness are shown in the Appendix (Table A).
Change in profit
The model included a partial budget calculation to determine the change in profit (e.g. income−variable costs=profit or loss) per cow for each age group in the herd for a change in a trait; this is often referred to as the economic value of the trait. The change in income corresponds to the maximum amount of money that could be made by a change of one unit in each trait (e.g. 1 kg milk or 1% mastitis incidence). Economic value of a trait is over a lifetime, but breeding values are expressed in lactating cows, so feed costs of growing heifers and lactating cows are shared among lactating cows. Variable costs and income that correspond to the traits of interest were included in the analysis in pounds sterling (Table 4). The average values for milk, feed and livestock prices were obtained from Redman (Reference Redman2012).
Improved efficiencies of production
The change in profit, CO2-eq. emissions per cow and per kg MS by a single unit change in each of 11 biological traits was assessed. The 11 traits represent a range of production traits and fitness traits. An increment of one unit increase in each trait was investigated while keeping all other traits constant. The traits assessed were: production traits of milk volume (litres/lactation), fat and protein yield (both kg/lactation), live weight (kg), body condition score (1 to 9 point scale), survival (%/lactation), and feed efficiency and fitness traits of residual feed intake (kg/day), SCC (‘000 cells/ml), mastitis and lameness incidence (both %/lactation) and calving interval (days/lactation). The average value and unit for each trait per cow assumed in the modelled average herd is shown in Table 6.
A multi-trait selection index, as described by Pryce et al. (Reference Pryce, van der Werf, Haile-Mariam, Malcolm and Goddard2009) and Hayes et al. (Reference Hayes, van der Werf and Pryce2011), was used to estimate the annual change in the 11 traits and the economic change, with an estimate of annual change in profit per cow from selection on multiple traits. A multi-trait selection index takes into account the economic values of the traits included, their heritabilities, and genetic and phenotypic correlations between traits in order to calculate optimal index weights for each trait (Pryce et al. Reference Pryce, van der Werf, Haile-Mariam, Malcolm and Goddard2009). Phenotypic and genetic correlations between traits were mostly obtained from Pritchard et al. (Reference Pritchard, Coffey, Mrode and Wall2013), except for live weight, condition score (both Pryce et al. Reference Pryce, van der Werf, Haile-Mariam, Malcolm and Goddard2009), and DM intake and residual feed intake (Veerkamp et al. Reference Veerkamp, Emmans, Cromie and Simm1995; Vallimont et al. Reference Vallimont, Dechow, Daubert, Dekleva, Blum, Barlieb, Liu, Varga, Heinrichs and Baumrucker2010, Reference Vallimont, Dechow, Daubert, Dekleva, Blum, Liu, Varga, Heinrichs and Baumrucker2013). Economic values were derived using the Breeding Objectives Model described earlier.
RESULTS
Change in profit
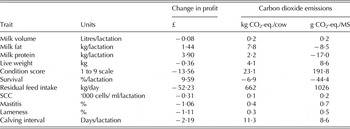
A 1 kg increase in residual feed intake resulted in the largest change in profit compared to the baseline situation of –£52·23 per cow (Table 8). Other notable changes in profit were an increase of £9·59 per cow for a 1% increase in survival and an increase of £3·90 per cow for an increase of 1 kg per lactation in milk protein yield.
Change in profit and carbon dioxide (CO2-eq.) emissions per cow and per kilogram MS associated with a 1 unit increase in milk volume, fat yield, protein yield, live weight, body condition score, survival, residual feed intake, SCC, mastitis incidence, lameness incidence and calving interval for an average herd over the lifetime of a cow

Efficiencies of production and greenhouse gas emissions
The largest contribution to total CO2-eq. emissions came from enteric fermentation (0·51), followed by N2O (0·34) and CH4 from manure (0·15) (Table 6).
Of the 11 traits studied, a 1 kg increase in residual feed intake produced the largest change in CO2-eq. emissions of 662 kg per cow and 1026 g per kg MS over the lifetime of a cow (Table 8). A 1 unit increase in most traits resulted in an increase in emissions per cow and per kg MS, but an increase in survival reduced emissions per cow and per kg MS, and an increase in milk fat and protein yield reduced emissions per kg MS. Traits where a single unit change (increase or reduction) would result in both a desirable increase in profit and a reduction in emissions intensity per cow and per kg MS were an increase in survival and decreases in milk volume, live weight, residual feed intake, SCC, mastitis incidence, lameness incidence and calving interval.
Responses to selection
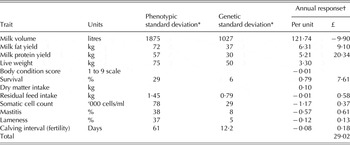
In practical situations, selection is often on several traits simultaneously, rather than single-trait selection. Selection on multiple traits using a multi-trait selection index where each trait is weighted by its respective optimal index weight (Table 9) showed that profit is expected to increase by £29·02 per cow per year, largely through increased milk fat and protein yields, and survival. Inserting the predicted annual response of each trait in Table 9 into the Breeding Objectives Model showed that CO2-eq. emissions are estimated to increase by 1·0% per cow and to decrease by 0·94% per kg MS per year based on the estimated annual response.
Expected annual response per cow based on the biological variation in breeding objective traits and their economic values in Table 8 using a multi-trait selection index*

* The phenotypic standard deviation (σp) and heritability (h 2) were used to calculate the genetic standard deviation (σa) using the formula σa=σp×h, where h is the square root of the heritability. For most traits the phenotypic standard deviation (σp) and heritability (h 2) was obtained from Pritchard et al. (Reference Pritchard, Coffey, Mrode and Wall2013), except for live weight (σp from Bell et al. (Reference Bell, Wall, Russell, Simm and Stott2011) and h 2 from Veerkamp & Brotherstone (Reference Veerkamp and Brotherstone1997)), condition score (σp from Banos et al. (Reference Banos, Coffey, Wall and Brotherstone2006) and h 2 from Veerkamp & Brotherstone (Reference Veerkamp and Brotherstone1997)), and DM intake and residual feed intake (σp and h 2 for DM intake from de Haas et al. (Reference de Haas, Calus, Veerkamp, Wall, Coffey, Daetwyler, Hayes and Pryce2012) and residual feed intake from Veerkamp et al. (Reference Veerkamp, Emmans, Cromie and Simm1995)).
† It was assumed that residual feed intake was only available as a genomic breeding value, whereas breeding values for the other traits were available from progeny-testing, with bulls having 80 daughters for production trait estimates and 40 daughters for health and fertility traits estimates. Annual response calculated based on a 0·22 standard deviation change in the aggregate index value (Robertson & Rendel Reference Robertson and Rendel1950).
DISCUSSION
Production efficiency can be defined as milk or MS output per unit of total feed input over an animal's lifetime, including the rearing phase. Production efficiency is directly related to profit because milk revenue and feed costs are the major economic drivers in dairying. Of the production traits studied, increases in milk fat and protein yields were associated with increased profit, whereas increases in live weight and body condition score were associated with reduced profit. These responses are expected because milk fat and protein yields represent direct income; live weight and body condition score represent indirect costs through energy requirements and feed intake. Increased milk volume yield might also be expected to increase profit, but the model assumed a charge on milk volume (e.g. penalty for exceeding milk production quota or supply contract), so an increase in milk volume, while keeping all other traits studied constant, was associated with reduced profit. Residual feed intake is a trait derived from production traits and feed intake, so is directly related to profit; the relationship is negative; however, because animals with lower RFI are more efficient (Williams et al. Reference Williams, Pryce, Grainger, Wales, Linden, Porker and Hayes2011).
Increases in all of the health and fertility traits (SCC, mastitis and lameness incidence, and calving interval) were associated with reduced profit because these traits represent direct costs through veterinary treatment, and indirect costs through lower milk production and higher culling rates. Culling rate inversely determines survival, which was positively associated with profit because cows that survive longer in the herd have higher average annual milk yield and have fewer associated heifer replacements (Garnsworthy Reference Garnsworthy2004).
In general, production traits were positively related to GHG emissions per cow because of the positive relationships of milk yield and live weight with feed intake, which is the main driver of GHG emissions. Increased MS yield reduced GHG emissions per kg MS as expected from the calculation. Similarly, fitter cows produce more milk, so improvements in fitness traits reduced GHG emissions per cow and per kg MS. For survival, however, the relationship was negative because cows that survive longer spread GHG emissions accumulated during the rearing phase over more total output of MS (Garnsworthy Reference Garnsworthy2004).
Economic values of traits
Generally, the economic values calculated in the present study (Table 9) were similar to those currently implemented in UK genetic evaluations (Wall et al. Reference Wall, Ludemann, Jones, Audsley, Moran, Roughsedge and Amer2010a ) for the health and fertility traits (allowing for the difference in how lifespan and survival traits are derived), but values for milk fat and protein yields were higher in the present study. Higher economic values will increase the estimated annual economic response for each trait. Economic values for live weight, condition score and feed efficiency are not included in the UK selection index, so economic values for these traits are new. Although assumptions are used (along with actual national records) to model a cow over its lifetime to derive economic values, Pryce et al. (Reference Pryce, van der Werf, Haile-Mariam, Malcolm and Goddard2009) showed that economic values derived using the Breeding Objectives Model are generally robust to these assumptions. The annual response to selection was more sensitive to the price of milk compared to other assumed production values. A 20% change in milk fat and protein price would change estimated profit per year by 28%; a 20% change in cost of feed (£/MJ; Table 4) by 8%; and a 20% change in milk production (Table 1) by 1%. Ultimately, the best assumptions available have to be used to complement actual records in order to calculate economic values and responses to selection.
The fertility trait evaluated was calving interval. The only information required to calculate calving interval are calving dates, which makes it an easy measure of fertility to evaluate, although calving interval is censored as it requires a subsequent calving, so cows culled for infertility are not present. In the UK, the current genetic evaluation of fertility is an index that includes calving interval and non-return rate 56 days after insemination (Pritchard et al. Reference Pritchard, Coffey, Mrode and Wall2013). The cost of each day over the optimal calving interval length, which is easily estimated, is associated with poor fertility. Poor fertility also increases the number of herd replacements required and can contribute up to 20% of GHG emissions by a herd (Garnsworthy Reference Garnsworthy2004).
Selection on efficiency traits and greenhouse gas emissions
Some improvement in gross efficiency of dairy systems has been achieved already though selection on production (Veerkamp Reference Veerkamp1998) and greater improvement could potentially be made through selection on metabolic efficiency, e.g. residual feed intake (Veerkamp et al. Reference Veerkamp, Emmans, Cromie and Simm1995). In the present study selection for residual feed intake was profitable and as a single trait was found to reduce GHG emissions per cow and per unit product more than other traits studied. In contrast to a study by Bell et al. (Reference Bell, Wall, Russell, Simm and Stott2011) on dairy cows in the UK, the present study found that a unit decrease in calving interval, SCC, mastitis incidence and lameness incidence would also bring profitable net reductions in GHG emissions per cow and per kg MS.
The main benefits of selection to improve production efficiencies are through increased productivity and gross efficiency (i.e. the ratio of yield of milk to resource input) by firstly, diluting the maintenance cost of animals in the system and secondly, fewer animals are required to produce the same amount of product (Garnsworthy Reference Garnsworthy2004; Capper et al. Reference Capper, Cady and Bauman2009; Wall et al. Reference Wall, Simm and Moran2010b ). Studies have found that more energy-efficient animals produce less waste in the form of CH4 and nitrogen excretion per unit product (van de Haar & St Pierre Reference van de Haar and St Pierre2006; Chagunda et al. Reference Chagunda, Römer and Roberts2009). Jones et al. (Reference Jones, Warkup, Williams and Audsley2008) calculated that in the last 20 years genetic improvement in dairy cows in the UK from selecting on economic and production efficiency had reduced GHG emissions per unit product by 0·8% per year and would continue to reduce emissions at a rate of 0·5% per year over the next 15 years. A reduction of 0·6% per year in GHG emissions per unit product was found in the US over a 63-year period (Capper et al. Reference Capper, Cady and Bauman2009). In a UK experimental herd, Bell et al. (Reference Barker2010) calculated that enteric CH4 emissions per unit product had decreased by 1·1% per year for cows selected for many generations on increased milk fat and protein production and had decreased at 1·4% per year for cows selected to represent the UK average for milk fat and protein production. Based on the annual genetic response in each trait, the present study predicted a reduction in GHG emissions per unit product of 0·9% per year, but GHG emissions per cow were estimated to increase by 1·0%. Increasing the genetic potential of a cow to produce milk increased GHG emissions per cow due to a higher feed intake, but selection on body maintenance requirements (e.g. live weight as an approximation for maintenance) or feed efficiency could help reduce emissions per cow and per unit product.
In the medium to long-term, selection will make permanent and cumulative gains in fitness traits such as survival and fertility, but management effects can be implemented in the short to medium term. The reduction in emissions per cow and per unit product associated with mastitis and lameness incidence are partially accounted for by phenotypic and genetic variations in survival (for both health traits) and calving interval (assumed to be longer for lame cows). The contribution of improving survival, feed utilization and fertility to reducing GHG emissions intensity of dairy systems in the UK is similar to that seen in Australia (Bell et al. Reference Bell, Eckard, Haile-Mariam and Pryce2013a ).
Given the low heritability of fitness traits such as fertility, survival, mastitis and lameness, reductions in emissions intensity of dairy systems may be harder to achieve than selection for a production trait such as feed intake or residual feed intake (i.e. feed efficiency). Customized selection indices, where producers create index weights specific to their farm circumstances, would be possible using the Breeding Objectives Model. As suggested by others (Cottle & Coffey Reference Cottle and Coffey2013), customized selection indices are appropriate for fitness traits with low heritability and, given their association, with reductions in GHG emissions intensity. Using a multi-trait selection index with the economic values derived in the present study (Table 9), the annual increase in profit from selection would be £29·02 per cow. This is higher than previously reported (£7·11, Wall et al. Reference Wall, Ludemann, Jones, Audsley, Moran, Roughsedge and Amer2010a ), but derives from use of higher economic values for milk production traits due to an increase in average price of milk from £0·17 per litre in previous calculations (Stott et al. Reference Stott, Coffey and Brotherstone2005) to £0·24 per litre in the present study, and the use of recently published phenotypic and genetic parameters for the UK (Pritchard et al. Reference Pritchard, Coffey, Mrode and Wall2013).
Selection on feed efficiency or CH4 output is not yet available in the UK, but using DNA information is especially promising for difficult or expensive to measure traits such as these (de Haas et al. Reference de Haas, Windig, Calus, Dijkstra, de Haan, Bannink and Veerkamp2011). Routine measurement of feed intake is costly, but genomic selection on feed intake and feed efficiency is possible (Hayes et al. Reference Hayes, van der Werf and Pryce2011; de Haas et al. Reference de Haas, Calus, Veerkamp, Wall, Coffey, Daetwyler, Hayes and Pryce2012). It may also be found that residual feed intake explains sufficient variation to be a proxy for enteric CH4. However, although proxies for CH4 emissions and nitrogen efficiency, such as measures of feed efficiency, can explain a large proportion of phenotypic variation (de Haas et al. Reference de Haas, Windig, Calus, Dijkstra, de Haan, Bannink and Veerkamp2011), in the case of enteric CH4, direct measurement is cheaper, quicker and simpler, and revealed considerable genetic variation among animals (Garnsworthy et al. Reference Garnsworthy, Craigon, Hernandez-Medrano and Saunders2012). It was assumed that the biological traits assessed explained the majority of variation in enteric CH4 emissions and nitrogen efficiency.
CONCLUSIONS
The present study showed that increased production efficiencies associated with an increase in survival, and decreases in milk volume (increasing fat and protein content), live weight, feed efficiency, SCC, mastitis incidence, lameness incidence and calving interval, would increase profit and reduce emissions per cow and per kg MS of dairy systems. The GHG emissions per cow are estimated to increase by 1% per year and reduce by 0·9% per unit product based on current breeding objectives and the inclusion of residual feed intake. Predicted improvements in health and fertility (and overall survival), and residual feed intake will increase farm annual profitability and reduce GHG emissions.
The authors thank Pete Down and Nick Bell for assistance with calculating the cost of mastitis and lameness. We also wish to thank Henry Richardson at The Centre for Dairy Information for providing data for this study. This work was funded by Defra, the Scottish Government, DARD, and the Welsh Government as part of the UK's Agricultural GHG Research Platform project (www.ghgplatform.org.uk).
Appendix
The methodology for costs associated with an incidence of mastitis and lameness (Table A) were based on Kossaibati & Esslemont (Reference Kossaibati and Esslemont1997). The costs of treatment for mastitis (P. Down, The University of Nottingham, Sutton Bonington, UK, personal communication) and lameness (Willshire & Bell Reference Willshire and Bell2009) were revised, as well as the costs of production (Table 4). The average amount of milk lost (discarded and reduced) over a cow's lifetime were about 5 and 2·3% for clinical and subclinical mastitis and 5·6 and 2% for clinical and subclinical lameness, respectively.
Costs (£ unless otherwise shown) of a mastitis and lameness case