Implications
The described in vitro experiment showed that fermentation end products within the range of realized intake in the in vivo study, affect metabolism of intestinal cells. Measurements point at an initial damaging effect followed by repair. The described in vivo experiment did not show effects on intestinal physiology on day 5 and 14 after weaning. It seems that the provision of fermented cereals has several effects of which the net outcome is not always beneficial for the animal. The in vitro results of initial damage and repair warrant further research on the time-related changes in intestinal physiology measured in vivo.
Introduction
Several studies show that the provision of a liquid diet containing prefermented cereals (Scholten, Reference Scholten2001) or completely prefermented liquid diets (Mikkelsen and Jensen, Reference Mikkelsen and Jensen1997; Canibe and Jensen, Reference Canibe and Jensen2003) positively affect performance as well as the mucosal architecture and function of the gastrointestinal (GI) tract, despite the inevitable loss of dietary energy due to the fermentation process (Scholten et al., Reference Scholten, Rijnen, Schrama, Boer, Van der Peet-Schwering, Vesseur, Den Hartog and Verstegen2001a). Spontaneous fermented cereals and completely fermented diets have relatively high concentrations of lactic and acetic acid; butyric acid, propionic acid and ethanol are also present (Scholten et al., Reference Scholten, Rijnen, Schrama, Boer, Van der Peet-Schwering, Den Hartog, Vesseur and Verstegen2001b). It is not known to what extent the positive effects of prefermented diets are related to the presence of these fermentation end products. Moreover, the underlying mechanisms need to be unraveled.
In cultures of enterocyte-like Caco-2 cells, it is possible to investigate both short- and long-term interactions of nutrients or dietary additives with small intestinal cells (Koninkx et al., Reference Koninkx, Brown, Kok, Hendriks, Pusztai and Bardocz1996; Mariadson et al., Reference Mariadson, Barkla and Gibson1997). Such studies already showed that growth characteristics, cellular metabolism and transepithelial electrical resistance (TEER) are differentially modulated by individual short-chain fatty acids. Concentrations up to 5 mM of propionate and 2 mM of butyrate stimulated cellular metabolism, whereas higher concentrations were inhibitory (Malago et al., Reference Malago, Koninkx, Douma, Dirkzwager, Veldman, Hendriks and Van Dijk2003, Reference Malago, Koninkx, Tooten, Van Liere and Van Dijk2005). In addition, both acids increased TEER and brush-border enzyme activities as markers of cell differentiation. Also, acetate induces an increase in TEER (Mariadason et al., Reference Mariadson, Barkla and Gibson1997). On the other hand, ethanol has been demonstrated to disrupt barrier function (Banan et al., Reference Banan, Choudharry, Zhang, Fields and Keshavarzian1999). However, the effects of these products combined as in fermented cereals or diets on these characteristics of intestinal cells are not known and might explain the mentioned positive effects on performance and intestinal function.
Therefore, the objective of the present experiment was to assess the effects of prefermented cereals on cell growth, cell metabolism, cell differentiation and the mucosal integrity of enterocyte-like Caco-2 cells. In addition, effects were also tested in vivo, by providing liquid diets containing prefermented cereals or their end products to weanling pigs.
Material and methods
Design
To study the mechanistic effects of fermentation end products on small intestinal cells, Caco-2 cells were incubated with the supernatants of complete weanling pigs’ diets containing prefermented cereals (F-diet) or non-fermented cereals in combination with fermentation end products (FP-diet). Moreover, to assure that physiologically relevant concentrations of the products were studied, a range of dilutions (0% to 10%) of these diets were applied. The ethanol, lactic, acetic, propionic, butyric and formic acid concentrations were 25.6, 63.2, 24.3, 1.5, 3.4, 3.4 and 28.8, 92.8, 24.7, 1.3, 4.7, 4.5 mM in the supernatants of the F- and FP-diets, respectively. Because lactic acid is the major fermentation end product, a dilution range of 2 to 50 mM Na-lactate was tested as well. In addition, effects were also tested in vivo by providing weanling pigs the same three liquid diets of which the supernatants were tested in vitro.
Preparation of fermented cereals and complete diets
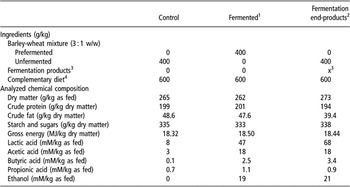
Three experimental liquid diets were used, which contained, in addition to a protein rich basal diet (60%), (1) a liquid control diet (C) containing 40% of a mixture of barley and wheat (ratio 3 : 1); or (2) a liquid diet containing 40% of a mixture of prefermented barley and wheat (ratio 3 : 1); or (3) as in C, with fermentation end products (acetic acid, butyric acid, acid, lactic acid and ethanol) added in concentrations similar to those in the F treatment. All diets (Table 1) were prepared manually by mixing pre-weighed portions of basal diet with unfermented cereals (C and FP), fermented cereals (F), fermentation end products (FP) and complementary water to achieve a water : feed ratio of 2.5 : 1.0 (all treatments). Prefermentation of the cereals was performed in two lockable 50 l plastic barrels that were filled with a mixture of barley and wheat (ratio 3 : 1; ground to pass a 2.75 mm sieve) and warm water (35°C) in a 1.0 : 2.2 ratio. After homogenization, both barrels were incubated for 48 h at 35°C. Every 3 h the contents were stirred automatically for 2 min. During the incubation period, a spontaneous fermentation occurred (as described by Scholten et al., Reference Scholten, Rijnen, Schrama, Boer, Van der Peet-Schwering, Vesseur, Den Hartog and Verstegen2001a and Reference Scholten, Rijnen, Schrama, Boer, Van der Peet-Schwering, Den Hartog, Vesseur and Verstegen2001b). After 48 h, the contents of both barrels were mixed, homogenized and stored in small portions (one for each feeding) in lockable plastic 3 l containers at 3°C. The fermentation procedure was tested in a separate experiment (unpublished data) in which the fermentation characteristics of this liquid barley-wheat mixture were monitored during a 48 h fermentation period followed by a 14-day storage period at 3°C. Results of this experiment showed that concentrations of the fermentation end products remained constant during storage.
Composition of the experimental diets

1To compensate for losses of gross energy of the barley and wheat mixture during prefermentation compared with the Control diet, an extra amount of unfermented cereals was added. This is not included in this table. For explanation, see text.
2To correct for the extra gross energy by adding the fermentation products compared with the Control diet, intake of unfermented cereals was reduced. This is not included in this table. For explanation see text.
3A watery solution containing about 600 mM dl-lactic acid, 140 mM acetic acid, 15 mM butyric acid and 300 mM ethanol was added to the complete diet, immediately prior to feeding; precise concentration and dosage of these fermentation end-products was based on analysis of batches of prefermented cereals fed to pigs of treatment F in the two most recent trials.
4The complementary diet supplied the following amounts of feed stuffs per kg of complete diet: barley, 75.0; wheat, 25.0; heat treated corn, 98.6; soybean meal, 40.0; herring meal, 75.0; skim milk powder, 50.0; delactosed whey powder, 40.0, sweet whey powder, 75.0; sugar beet pulp, 30.0; dextrose, 20.0; soybean oil, 30.0; limestone, 8.5; monocalcium phosphate, 4.0; salt, 1.5; l-lysin HCl, 2.4; dl-Methionine, 1.2; l-Threonine, 0.8; l-Tryptophan, 0.4; diatomaceous shell powders (source of acid insoluble ash), 20; vitamin and mineral premix, 2.6. The vitamin and mineral premix provided the following nutrients per kg of the complete diet: retinol, 12 000 IU; cholecalciferol, 1800 IU; folic acid, 0.3 mg; cyanocobalamin, 17.5 μg; pantothenic acid, 10 mg; α-tocopherol, 30 IU; biotin, 0.05 mg; menadione dimethyl-pyrimidinol, 0.5 mg; niacin, 20 mg; riboflavin, 3.5 mg; choline, 0.5 g; pyridoxine, 1.5 mg; thiamine, 1 mg; cobalt, 0.15 mg (as CoSO4·7H2O); copper, 50 mg (as CuSO4·5H2O); manganese, 25 mg (as MnO2); iron, 100 mg (as FeSO4·7H2O); zinc, 100 mg (as ZnSO4); iodine, 0.45 mg (as KI); selenium, 0.25 mg (as Na2SeO3·5H2O).
Changes in growth curve characteristics, cell metabolism, cell differentiation and TEER of enterocyte-like Caco-2 cells after exposure to the experimental diets
Enterocyte-like Caco-2 cells routinely grown in supplemented Dulbecco’s modified Eagle’s medium (DMEM) were seeded at 40 000 cells/cm2 (Ovelgönne et al., Reference Ovelgönne, Koninkx, Pusztai, Bardocz, Kok, Ewen, Hendriks and Van Dijk2000; Malago et al., Reference Malago, Koninkx, Douma, Dirkzwager, Veldman, Hendriks and Van Dijk2003; Malago et al., Reference Malago, Koninkx, Tooten, Van Liere and Van Dijk2005). In the case of the TEER experiments, using Transwell polycarbonate filter inserts (Costar Europe, Badhoevedorp, The Netherlands), 60 000 cells/cm2 were seeded. To determine effects on growth, the apical compartment was exposed from day 3 to day 19 to the supernatants of the liquid diets containing either fermented cereals or their end products. Before incubation, the supernatants of both the F- and FP-diets were centrifuged for 15 min (12 000 × g at 4°C) and sterilized using a 0.22 μm filter. On day 0 and day 19, cells were quantified using a rapid tetrazolium-based colorimetric assay (Alley et al., Reference Alley, Scudiero, Monks, Hursey, Czerwinski, Fine, Abbott, Mayo, Shoemaker and Boyd1988). The changes in cell metabolism, cell differentiation and TEER of 19-day-old enterocyte-like differentiated Caco-2 cells were determined as described by Malago et al. (Reference Malago, Koninkx, Douma, Dirkzwager, Veldman, Hendriks and Van Dijk2003). Briefly, Caco-2 cells were incubated in quadruplicate cultures with 0.5, 1.0, 2.5, 5.0 and 10.0% of the supernatant of the F-diet, or 0.5, 1.0, 2.5, 5.0 and 10.0% of the supernatant of the FP-diet, respectively, for a period of 48 h. In addition, for control purposes, an extra group of 48-h incubations were performed with 0 (negative control), 2, 5, 10, 20 and 50 mM Na-lactate. Incubation of the cells was performed in 0.5 ml plain DMEM containing gentamycin in the absence of fetal calf serum (Malago et al., Reference Malago, Koninkx, Douma, Dirkzwager, Veldman, Hendriks and Van Dijk2003). Incorporation of precursors for DNA, RNA, protein and glycoprotein synthesis were measured using the radioactive labels 14C-thymidine, 14C-uridine, 3H-methionine and 3H-glucosamine, respectively, that were added during the last 4 h of incubation. The incorporated radioactivity was determined by liquid scintillation counting (Beckman LS 1701, Beckman Instruments B.V., Mijdrecht, The Netherlands). The incorporated radioactivity was calculated as disintegration/min per μg protein, and expressed as the relative incorporation (the factor by which the incorporation was increased or decreased compared with cell cultures that were not incubated with the supernatants). The integrity of the cell monolayer was verified by measuring the TEER using a Millicell-ERS Volt/Ohm meter (Millipore Corporation, Bedford, MA, USA).
Animals and housing
Eighteen groups of weanling pigs (n = 8 per group) were assigned to one of the three dietary treatments. The in vivo experiment consisted of nine trials. Within each trial, two of the three experimental diets were provided, resulting in six replicates per treatment. The pigs originated from a commercial sow herd (Great Yorkshire × Finnish Landrace) and Pietrain terminal boars and were weaned at 28 days of age. During nursing, all piglets had free access to water, but to reduce variation in post-weaning performance, creep feed was not provided (Bruininx et al., Reference Bruininx, Binnnendijk, Van der Peet-Schwering, Schrama, Den Hartog, Everts and Beynen2002). In each trial, 17 pigs were transported 40 km to the research facility. One pig (per trial, nine in total) was anesthetized and sampled for reference purposes, following the procedure described later. The remaining 16 pigs were used to compose two similar groups of eight piglets each, based on sex and BW. Each group was allotted to one of two dietary treatments in such way that within the nine trials, six replicates were obtained for each of the three dietary treatments in this study.
Pigs were housed in climate respiration chambers under thermoneutral conditions (Verstegen et al., Reference Verstegen, Van der Hel, Brandsma, Henken and Bransen1987) in order to study energy metabolism characteristics by indirect calorimetry (data not presented). The experimental protocol was approved by the Institutional Animal Care and Use Committee of Wageningen University.
Tissue and digesta sampling
During each trial, one, three and five pigs per group were sacrificed on days 0, 5 and 14, respectively. Pigs were weighed, premedicated with ketamine (1.5 ml/kg BW) and anesthetized by inhalation of a mixture of N2/O2 and isoflurane. The time between feeding and anesthesia was standardized to 140 min. During anesthesia, the abdomen was opened and about 50 cm of the proximal jejunum, beginning at 50 cm distal from the ligament of Treitz, was removed, cleaned and rinsed with 100 ml of phosphate-buffered saline (PBS), pH 7.3 (0.01 M NaH2PO4, 0.01 M Na2HPO4, 0.9% (w/v) NaCl; 4°C). Afterwards, the piglets were killed by an intracardiac injection of 1 ml of T61 (a watery solution containing a combination of embutramide, mebezodiumiodide and tetracainehydrochloride; Hoechst Holland, Amsterdam, The Netherlands). Jejunal segments, 10 cm in length, were cut open longitudinally at the mesenteric attachment and Swiss rolls were made. After fixation of the tissue in 0.1 M phosphate-buffered 4% formaline (pH 7.3) for 48 h, dehydration and embedding in paraffin, 5-μm sections were cut. To determine the specific activity of the brush-border membrane-associated enzymes sucrase–isomaltase and aminopeptidase, a jejunal segment (15 cm) was taken, 65 cm distal from the ligament of Treitz, and rinsed with 20 ml of PBS (pH 7.3). The mucosal layer facing upwards was carefully scraped from the muscle layer and stored immediately at −20°C until further analysis.
Morphological characterization of the jejunal mucosa and brush-border membrane-associated enzyme activities
Morphological measurements on the jejunal mucosa were performed in sections (one section per animal) oriented along the longitudinal axis of the intestine and cut at right angles to the surface of the mucosa. Using haematoxylin eosinstained sections (Stevens, Reference Stevens1982), the villous height and crypt depth were measured in 10 well-oriented villi and crypts by quantitative morphometry. The villous/crypt ratio was calculated to indicate the extent of morphological abnormality. In addition, the same crypts columns were used to determine the number of mitoses per crypt. Per section, the mean of all 10 values was calculated and used for further analyses.
Before measuring the brush-border membrane-associated enzyme activities in the jejunal scrapings, these scrapings were treated as described by Pusztai et al. (Reference Pusztai, Koninkx, Hendriks, Kok, Hulscher, Van Damme, Peumans, Grant and Bardocz1996). The activities of sucrase–isomaltase (EC 3.2.1.48) and aminopeptidase (EC 3.4.11.2) were determined according to Messer and Dahlqvist (Reference Messer and Dahlqvist1966) and Maroux et al. (Reference Maroux, Louvard and Barratti1973), respectively, and expressed as enzyme units/g of mucosal protein. The brush-border membrane-associated enzyme activity in Caco-2 cells was determined in the partly purified brush-border membrane fraction (Pinto et al., Reference Pinto, Robine-Leon, Appay, Kedinger, Triadou, Dussaulx, Lacroix, Simon-Assmann, Haffan, Fogh and Zweibaum1983).
Statistical analyses
For the in vitro measurements, statistical significance between the mean values of control and cells exposed to liquid diets containing either fermented cereals or their end products was assessed by one-way analysis of variance (ANOVA) plus comparison of means. Differences were considered significant at 95% confidence interval using the Student’s t-test.
Differences between experimental diets and sampling days in in vivo traits that were determined on both day 5 and 14, were tested with the GLM procedure of SAS (version 6.12, SAS Institute, Cary, NC) by means of F-tests using a split-plot model, with sampling days within groups taken as repeated measurements:

where Yijkl = trait; μ = overall mean; EDi = fixed effect of experimental diet (i = 1,2,3); e 1,ijk = error term 1, which represent the random effect of group j (j = 1,…, 18) within experimental diet i; SDk = fixed effect of sampling day (k = 5, 14); DMIl = the estimated dry matter intake of pig l (l = 1,…, 137) minus the group mean intake during the preceding; e 2,ijklm = error term 2. The effects of experimental diets were tested for significance against error term 1; other effects against error term 2. For traits that were only determined on day 5, the model was limited to the fixed effect experimental diet and error term 1.
Results
Growth characteristics of Caco-2 cells
Cell proliferation expressed as number of cells at day 19 of the growth curve did not change after the exposure to 50 mM Na-lactate, but decreased (P < 0.05) after exposure to 2 or 20 mM Na-lactate (Figure 1). The higher concentrations (5% and 10%) of F- and FP-supernatants reduced the number of cells at day 19 by about 15% (P < 0.05).
The effect of various concentrations of Na-lactate, supernatant of fermented cereals or the supernatant of a combination of unfermented cereals with end products of fermentation added, on Caco-2 cell numbers at day 19, compared with the Control. Cell growth is expressed as the relative absorbance of MTT formazan ± s.d. An asterisk at the top of a column indicates a significant difference between the number of cells after exposure to the additives and the number of unexposed cells.

TEER of differentiated Caco-2 cells
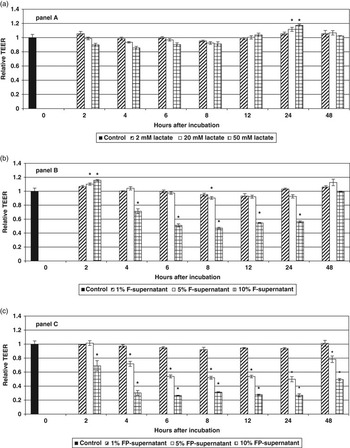
As a measure of mucosal integrity of filter-grown 19-day-old, differentiated Caco-2 cells, the TEER was measured at 2, 4, 6, 8, 12, 24 and 48 h after exposure to Na-lactate, F- and FP-supernatants (Figure 2a, b and c). The TEER of 19-day old Caco-2 cells is 467 ± 21 Ohm.cm2 after subtracting the resistance of the blank filter (123 ± 16 Ohm.cm2).
The effect of various concentrations of Na-lactate (a), the supernatant of fermented cereals (b), or the supernatant of a combination of unfermented cereals with added end products of fermentation (c) upon the transepithelial electrical resistance (TEER) of filter-grown differentiated Caco-2 cells exposed to the additives for 48 h continuously. The results are expressed as the relative TEER ± s.d. An asterisk at the top of a column indicates a significant decrease or increase in the TEER in comparison with control Caco-2 cells.

There was a time by concentration interaction within the three tested products Na-lactate, F- and FP-supernatants (P < 0.0001). Incubation with 20 and 50 mM Na-lactate increased (P < 0.05) TEER only at 24 h (Figure 2a). TEER was not affected by Na-lactate at any other moment or concentration (P > 0.1). Incubation with 1% F-supernatant did not affect (P > 0.1) TEER (Figure 2b), whereas generally incubation with 10% F-supernatant initially increased (2 h; P < 0.05) and subsequently decreased (P < 0.05) TEER (4 to 24 h). After 48 h of incubation, the differences disappeared. The changes in TEER after exposure to 5% F-supernatant were intermediate and followed the same pattern in time. A significant (P < 0.05) increase in TEER was also observed after 2 h of exposure, but a significantly decreased TEER was only observed after 8 h of incubation. The effects of FP-supernatants on TEER were even more pronounced than those of the F-supernatants (Figure 2c). As with the F-supernatant, the 1% dose of FP-supernatant did not significantly (P > 0.1) affect the TEER. However, both the 5% and 10% doses of FP-supernatant caused a decrease (P < 0.05) in TEER in a concentration dependent manner (r = −0.981 (P < 0.05) and r = −0.994 (P < 0.01) after 24 and 48 h of incubation with 0% to 10% dosages of the FP-supernatants, respectively. The lowest TEER levels were observed after 8 h of incubation, after which they started to rise again. However, the levels after 48 h did not reach the levels of unexposed cells.
Changes in the cellular metabolism of 19-day-old, differentiated Caco-2 cells
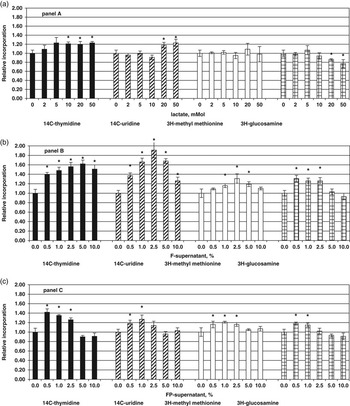
Compared with control cells, incubation of differentiated Caco-2 cells with 20 and 50 mM Na-lactate stimulated the DNA- and RNA-synthesis as indicated by the higher (P < 0.05) relative incorporation of 14C-thymidine and 14C-uridine in Figure 3a. However, the lower (P < 0.05) relative incorporation of 3H-glucosamin (Figure 3a) for these high concentrations of Na-lactate indicated an inhibitory effect on protein glycosylation. Low concentrations of Na-lactate had no effect (P > 0.1) on DNA- and RNA-synthesis. Protein synthesis was not affected by any Na-lactate concentration, as indicated by similar relative incorporation rates of 3H-methyl methionine compared with the control cells (Figure 3a). All tested concentrations of the supernatants of the F-diet stimulated the DNA- and RNA-synthesis as indicated by higher (P < 0.05) relative incorporation rates of 14C-thymidine and 14C-uridine (Figure 3b). Especially the lower concentrations of the supernatants of the F-diet stimulated (P < 0.05) protein synthesis (1.0%, 2.5% and 5.0% of the F-supernatant) and protein glycosylation (0.5%, 1.0% and 2.5% of the F-supernatant). Higher concentrations of the F-supernatant did not affect (P > 0.1) protein synthesis and glycosylation, as compared to the control cells. Exposure of differentiated Caco-2 cells to the lower concentrations (0.5%, 1.0% and 2.5%) of the supernatant of the FP-diet stimulated the relative incorporation of 14C-thymidine, 14C-uridine, 3H-glucosamin and 3H-methyl methionine as compared to the control cells, whereas the higher concentrations did not affect (P > 0.1) these indicators of cellular metabolism (Figure 3c).
Relative incorporation of 14C-thymidine, 14C-uridine, 3H-methyl methionine and 3H-glucosamine into differentiated Caco-2 cells after exposure to various concentrations of Na-lactate (a), the supernatant of fermented cereals (b), or the supernatant of a combination of unfermented cereals with added end products of fermentation (c). The results are expressed as the mean relative incorporation ± s.d. An asterisk at the top of a column indicates a significant difference between the relative incorporation of cell cultures exposed to the additives and control cell cultures.

Sucrase–isomaltase and aminopeptidase activities of 19-day-old, differentiated Caco-2 cells
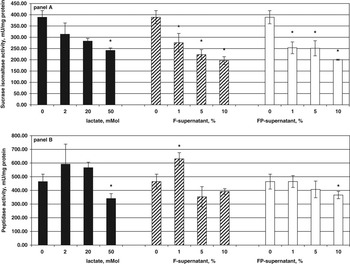
Incubation of differentiated Caco-2 cells with Na-lactate, F-supernatant and FP-supernatant for a 48-h period decreased the specific sucrase–isomaltase activity in a dose-dependent manner (Figure 4a). Conversely, the effects on the specific aminopeptidase activities are less clear. In general, changes in aminopeptidase activities were not significant (Figure 4b). Only the highest doses of Na-lactate (50 mM) and FP-supernatant (10 mM) caused a significant (P < 0.05) decrease in specific aminopeptidase activity, whereas the lowest tested dose of F-supernatant (1 mM) caused a significant increase (P < 0.05) compared to the control cells. Moreover, the highest doses of F-supernatant (5 and 10 mM) showed a lower, but non-significant, aminopeptidase activity than the control cells (Figure 4b).
Specific enzyme activity of sucrase–isomaltase (a), and aminopeptidase (b), of differentiated Caco-2 cells after incubation with various concentrations of Na-lactate, the supernatant of fermented cereals or the supernatant of a combination of unfermented cereals with added end products of fermentation. The results are expressed as the mean specific enzyme activities ± s.d. (munits/mg protein). An asterisk at the top of a column indicates a significant difference between the specific enzyme activity of cells exposed to the additives and unexposed cells.

Performance
Effects of dietary treatments on piglet performance and energy metabolism are not presented in detail. Briefly, treatment averages of average daily dry matter intake varied between 80 and 94 g/day and between 223 and 233 g/day during days 0 to 5 and days 5 to 14, respectively, but were not statistically different (P > 0.1) between dietary treatments. Treatment averages of average daily gain varied between −18 and −35 g/day and between 208 and 224 g/day during days 0 to 5 and days 5 to 14, respectively, but were not affected (P > 0.1) by dietary treatments. Five piglets were discarded because of health problems (two, two and one animal in the C-, F- and FP-groups, respectively). Despite the strategy of restricted feeding, feed residuals occurred during every trial.
Histological characteristics and enzyme activities
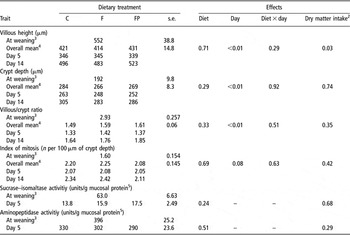
Histological characteristics at weaning, day 5 and day 14 are shown in Table 2. As expected, there was a clear sampling day related effect (day 5 v. day 14) on villous height, crypt depth, villous/crypt ratio, index of mitosis and weight of the small intestine. At 5 days after weaning, villous height was approximately 38% (≈210 μm) lower than at weaning. At day 14, villi were longer than at day 5, but still about 10% shorter than at weaning. Average crypt depth was lowest (192 μm) at weaning, whereas at day 14, crypt depth was highest (283 μm). Though at day 5, crypts were less deep than at day 14, the villous/crypt ratios at weaning (2.93) were higher than those of day 5 (1.37) and 14 (1.75), respectively. The index of mitosis and also the relative weight of the small intestine were lowest at weaning but highest at day 14 with the average values at day 5 being intermediate. The average sucrase–isomaltase activity at 5 days after weaning was about 75% lower than at weaning (15.7 v. 63 units/g protein), whereas the average aminopeptidase activity at day 5 was only about 23% lower than at weaning (307 v. 396 units/g protein). The dietary treatments did not interfere with the histological characteristics or weights of the emptied stomach, small intestine, large intestine, cecum (data not shown), or brush-border membrane-associated enzyme activities.
The effects of the provision of an unfermented control diet (C), a diet containing 40% fermented cereals (F) or an unfermented diet containing unfermented cereals with end products of fermentation added (FP) on morphology, mitotic activity, and specific brush border membrane-associated enzyme activity in the small intestine of weanling pigs

1Values are least-square means (n = 6) and s.e. for the effects of the dietary treatments.
2Effect of dry matter intake included as a covariate in the model.
3Traits at weaning are presented as reference values but not included in statistics (n = 9).
4Averaged over days 5 and 14.
5Traits were only measured at weaning and at day 5.
Discussion
The results of the in vitro experiment clearly showed effects of Na-lactate, F- and FP-supernatants on the development and metabolism of Caco-2 cells. The growth curves of Caco-2 cells, grown for 19 days in the presence of Na-lactate, F- and FP-supernatants, all showed a similar development in time. Exposure to higher concentrations of F- and FP-supernatants, but not Na-lactate, resulted in lower number of cells at the end of the growth curve. This decrease in cell number may be due to a reduced mitotic activity or an increase in cell damage after exposure to high doses of F- and FP-supernatants. At day 19, Caco-2 cells are fully differentiated and display characteristics of small intestinal enterocytes both structurally and functionally (Malago et al., Reference Malago, Koninkx, Douma, Dirkzwager, Veldman, Hendriks and Van Dijk2003). Therefore, these findings should correspond with a reduction in villous height in vivo. The morphology measurements in the present in vivo experiment showed the typical pattern of villous shortening and recovery in pigs during the first two weeks after weaning (Hampson, Reference Hampson1986; Verdonk et al., Reference Verdonk, Spreeuwenberg, Bakker and Verstegen2000) but, in contrast with the positive effects reported by Scholten et al. (Reference Scholten, Van der Peet-Schwering, Den Hartog, Balk, Schrama and Verstegen2002) and with our in vitro findings, were not affected by the dietary treatments.
The incorporation studies in the in vitro experiment showed that DNA, RNA, protein and glycoprotein synthesis were stimulated by incubation with low concentrations (0.5% to 2.5%) of F- and FP-supernatants, whereas the higher concentrations (5% to 10%) had no effect at all. The effects of incubation with just Na-lactate were much less clear. The highest concentrations of Na-lactate stimulated DNA- and RNA-synthesis but decreased glycoprotein synthesis. The increased cellular metabolism after incubations with the F- and FP-supernatants was observed at concentrations that did not affect the number of cells at day 19 suggesting that it is a reflection of cellular repair rather than cell number increase.
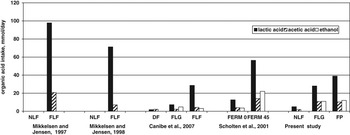
The effects of incubation of differentiated Caco-2 cells with the F- and FP- supernatants on sucrase–isomaltase activities were inconsistent with the results of the in vivo measurements of these enzyme activities. In vitro sucrase–isomaltase activities were lower, whereas in vivo values were unaffected and numerically even higher in both the F- and FP-pigs. Regarding aminopeptidase measurements, the in vivo and in vitro values corresponded better. As indicated by the TEER measurements in the in vitro study, mucosal integrity initially decreased after incubation with highest concentrations of F- and FP-supernatant and started to recover between 24 and 48 h. The in vitro experiment clearly demonstrates that fermentation end products affect cellular metabolism and differentiation. Most characteristics point at an initial damaging effect followed by repair. Although a continuous exposure to the F- and FP-supernatants as in the in vitro experiment does not occur in weanling pigs fed twice daily, it seems reasonable to assume that the in vivo concentrations of fermentation end products at the actual tissue sampling spots in the small intestine are between those in the stomach (16 to 22 mM, 10 to 11 mM and 0.18 to 0.47 mM for lactic, acetic and butyric acid, respectively; data not shown) and total small intestine (15 to 17 mM, 8 to 9 mM and 0.04 to 0.07 mM for lactic, acetic and butyric acid, respectively; data not shown). Because these fermentation products are in the liquid phase, actual concentrations to which intestinal cells were exposed could even be higher. The concentrations of ethanol, lactic, acetic, butyric, propionic and formic acid in the F- and FP supernatants were 26, 69, 24, 3, 2, 3 mM and 29, 121, 25, 5, 1, 5 mM, respectively. Consequently, in terms of exposure concentrations, the in vivo results probably correspond best with the in vitro results of the 10% solutions. Malago et al. (Reference Malago, Koninkx, Douma, Dirkzwager, Veldman, Hendriks and Van Dijk2003) found a higher sucrase–isomaltase activity at a concentration of 2 mM butyrate, whereas with 2 mM propionate it was only slightly increased. Both acids separately caused a significant increase in mucosal integrity after 48 h indicated by TEER measurements. These results are in line with those of Mariadason et al. (Reference Mariadson, Barkla and Gibson1997), who observed increased mucosal integrity after incubation with butyrate and propionate, and also with acetic acid. However, these findings are inconsistent with our data that are based on incubation of Caco-2 cells with a mix of small-chain fatty acids (SCFAs) and ethanol. Ethanol however, might be responsible for the observed decrease in mucosal integrity as demonstrated in Caco-2 cells by Banan et al. (Reference Banan, Choudharry, Zhang, Fields and Keshavarzian1999) at relatively high ethanol levels compared to our study. Nevertheless, the average daily intake of ethanol found by Scholten (Reference Scholten2001; Figure 5) was higher than in the present study but, as stated above, they reported beneficial effects on the gut morphology measured in vivo.
Variation among studies in (estimated) average daily intake of lactic acid, acetic acid and ethanol during 14 days after weaning by pigs receiving dry control diets (DF), liquid control diets (NLF or FERM 0), completely fermented diets (FLF), partly fermented diets (FERM45 or FLG) or liquid control diets containing fermentation end products (FP). Because of missing ethanol concentrations it was not possible to estimate the average daily ethanol intake for both studies of Mikkelsen and Jensen (Reference Mikkelsen and Jensen1997).

The absence of any dietary effect on intestinal characteristics in the in vivo experiment, which is in contrast with earlier findings (Scholten et al., Reference Scholten, Van der Peet-Schwering, Den Hartog, Balk, Schrama and Verstegen2002), may be due to the differences in exposure of the intestinal cells to fermentation end products that relate to differences in intake level and/or differences in concentrations of fermentation end products in the GI tract. The average daily intake levels of lactic acid and acetic acid in the present study were about 50% and 75%, respectively, of the intake levels achieved by Scholten (Reference Scholten2001; Figure 5). Indeed, Scholten et al. (Reference Scholten, Van der Peet-Schwering, Den Hartog, Balk, Schrama and Verstegen2002) found higher concentrations of lactic acid in the stomach of pigs receiving 45% fermented cereals in comparison with the F- and FP-pigs in the present study (67 v. 22 and 22 mM; data not shown). In addition, they also found higher levels of propionic acid in the stomach of these pigs than in the stomachs of the control pigs receiving a liquid diet without fermented cereals. In contrast, Canibe et al. (Reference Canibe, HØjberg, Badsberg and Jensen2007) did not find differences in the concentrations in lactic acid in the stomach of pigs fed either a dry diet, a partly fermented diet or a completely fermented liquid diet (FLF). Although their general concentrations of lactic acid (60 to 78 mM) and other SCFAs in the stomach were higher, their intake was lower than in the present study (Figure 5). The latter suggests that the microbial activity in the stomach of their pigs fed the dry control diets was considerably higher. Nevertheless, concentrations of fermentation end products are the net result of intake, passage, in vivo production and absorption.
In conclusion, the in vitro experiment clearly showed that both F- and FP- supernatants within the range of realized intake in the in vivo study, clearly modulate cellular growth, metabolism, differentiation and mucosal integrity. The contribution of lactic acid to these effects seems limited. These findings were not supported by the in vivo results. This inconsistency might be accounted for by species differences (human v. pig), but may also be caused by differences in exposure of intestinal cells (continuous v. intermittent, respectively) or by small differences in SCFA intake between the experimental groups in the in vivo experiment.
Because the supernatants of fermented cereals and their fermentation end products similarly modulate cellular growth, metabolism, differentiation and mucosal integrity in the in vitro model, a distinction between effects of fermented cereals and fermentation end products is not necessary. It seems that the provision of fermented cereals has several effects, of which the net outcome is not always beneficial for the animal. Time (hours) seems to be an important determinant as indicated by the TEER-measurements.
Acknowledgements
The financial contributions of the Dutch Ministry of Agriculture, Nature and Food Quality and the Dutch Product Board for Animal Feed and the assistance of the personnel of experimental farm ‘De Haar’ is gratefully acknowledged.