I. INTRODUCTION
In recent years, a great research interest has been witnessed in the wireless body area communications for biomedical and healthcare services. The ever-advancing miniaturization of electronic devices is leading to the making of various personal information and communication appliances which can be attached to or implanted inside the bodies of patients. coplanar waveguide (CPW) solution has emerged for wireless body area communication interface with high data rate in the future telemedicine systems [Reference Ashok Kumar and Shanmuganantham1], such as the medical wireless capsule endoscopy for real-time video imaging of the digestive tract in gastrointestinal diagnosis [Reference Kiourti, Christopoulou and Nikita2, Reference Crumley, Evans, Burns and Trouton3]. The authors have proposed CPW-fed monopole antenna design for implanted communication in the industrial, scientific, and medical (ISM) band at 2.4 GHz [Reference Ashok Kumar and Shanmuganantham4], which acts as a transmitting antenna in the proposed one-way communication link. To establish effective and efficient wireless links with the implanted antenna, the corresponding on-body wearable receiver antenna should be designed with unidirectional radiation characteristics, high gain, small size and low profile [Reference Ashok Kumar and Shanmuganantham5].
Implantable antennas must be biocompatible in order to safeguard patient safety and to prevent rejection of the implant. Furthermore, conducts human tissues and would short circuit the implantable antenna if they were allowed to be in direct contact with its metallization [Reference Chen, Liu and See6, Reference Karacolak, Hood and Topsakal7]. Biocompatibility and prevention of undesirable short-circuits are particularly crucial in the case of antennas that are intended for long-term implantation [Reference Ashok Kumar and Shanmuganantham8]. A CPW-fed Z-monopole antenna design is proposed as the in-body antenna in this paper. To characterize the human body as a medium for radio frequency wave propagation, the electrical properties of the body tissues should be known for the frequency of interest.
In this paper, the design of an implantable Z-monopole antenna operating at the frequency of 2.45 GHz ISM band, recommended by the European Radio Communications Committee (ERC) for ultra-low-power active medical implants [Reference Karacolak and Topsakal9, 10]. To make an antenna suitable for implantation, it is embedded in Al2O3 ceramic substrate. The results were performed to be ensuring that the antenna is working properly in all type of body surroundings.
II. GEOMETRY OF THE PROPOSED ANTENNA
A) Antenna design
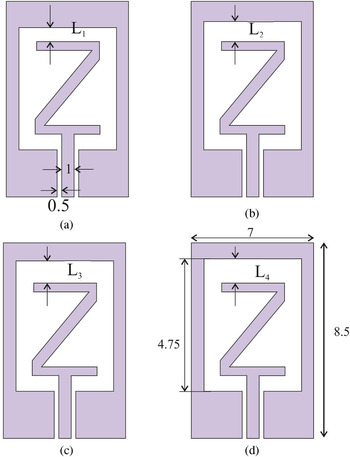
The antenna consists of five models with embedded biocompatible ceramic substrate (ε r = 9.8 and thick = 0.65 mm), for the proposed antenna contains 8.5 × 7 × 0.65 mm3 square having Z-shaped patch ((a) L 1 = 1.1 mm (b) L 2 = 1.2 mm (c) L 3 = 1.3 mm, and (d) L 4 = 1.4 mm) with different distances as shown in Fig. 1. For feeding, the width of CPW feed-line is given by “strip width” (1 mm), the spacing is given by “gap width” (0.5 mm), and the impedance matching of the antenna can be improved by adjusting “gap width” and “strip width”.
Proposed Z-shaped monopole antennas (a) L 1 = 1.1 mm (b) L 2 = 1.2 mm (c) L 3 = 1.3 mm (d) L 4 = 1.4 mm (all dimensions are in mm).

The feeding structure of the monopole antenna consists of a CPW with matching the mode impedance of 50 Ω is obtained by tuning the distance between the tracks and as well as the width of the tracks. The proposed antenna design model setup is presented in [Reference Ashok Kumar and Shanmuganantham11, Reference Huang, Lee, Chang, Chen, Yo and Luo12]. The values for each couple of dielectric values reported in [Reference Xia, Saito, Takahashi and Ito13, Reference Abadia, Merli, Zürcher, Mosig and Skrivervik14] valid at the specified frequency.
III. RESULTS AND DISCUSSION
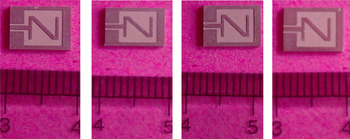
Experimental investigations are necessary in order to validity the numerical simulations for implantable CPW-fed antennas. Since it is not possible to carry out measurements inside the human body, investigations are performed by measuring laboratory-fabricated prototypes [Fig. 2] inside either tissue-equivalent mediums (phantoms). Prototype fabrication of implantable antennas meets all classical difficulties of miniature antennas. The proposed antenna is fabricated with biocompatible alumina ceramic substrate (ε r = 9.8, h = 0.65 mm) as shown in Fig. 2.
Photograph of fabricated proposed antennas.

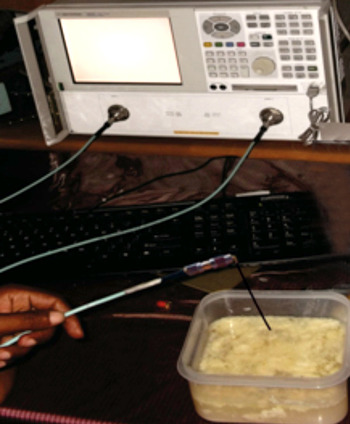
In this case, the main challenge lies in the formulation and characterization of tissue-emulating materials. Example phantoms and tissue recipes reported in the literature are given in [Reference Ashok Kumar and Shanmuganantham5]. In real-life scenario, the antenna is intended to be implanted into the human body, subcutaneously, particularly implanted inside the muscle fat skin tissue. Hence the measurement setup, using a human tissue is as follows. The antenna with human tissue is placed at the center of a plastic container of dimensions 200 mm × 200 mm × 80 mm filled with 1 liter of human body phantom liquid. This liquid mimics the dielectric characteristics of human muscle, fat and skin tissue at 2.45 GHz.
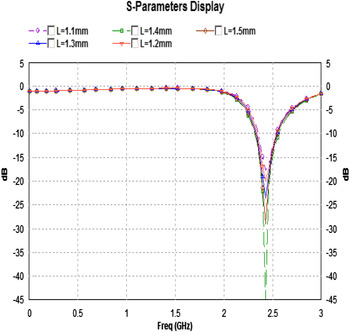
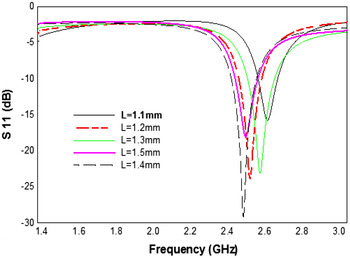
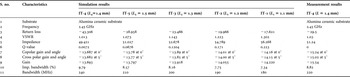
The fabricated antenna embedded into the human phantom fluid [Fig. 3] and the simulated and measured return loss of proposed antenna is shown in Figs 4 and 5, respectively. Antenna (L 4 = 1.4 mm) shows that the maximum value of return loss of −45 dB (simulated) and −29 dB (measured) compared to other antennas as shown in Table 1.
Photograph for experimental setup.

Simulated return loss versus frequency.

Experimental return loss versus frequency.

Comparison of simulated and measurement results.

Gain in dBi, return loss in dB and impedance in ohm.
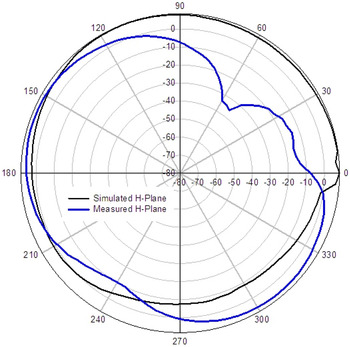
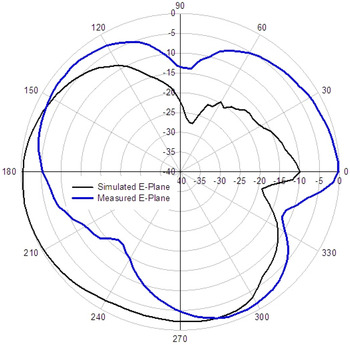
The radiation patterns of the antenna at the frequency of 2.45 GHz in the E- and H -planes are shown in Figs 6 and 7. It could be seen that the measured and simulated radiation patterns were in good agreement. At the ISM band, the radiation pattern of antenna (L 4 = 1.4 mm) is obtained in the E-Plane and a nearly unidirectional radiation pattern in the H-plane. Hence, the comparison of simulation and measurement analysis of proposed antenna characteristics are reported in Table 1. This is sufficient for the ISM band biomedical application.
Simulation versus measured radiation pattern for H-Plane.

Simulation versus measured radiation pattern for E-Plane.

IV. CONCLUSION
An implantable CPW-fed Z-monopole antenna for biomedical applications is presented with a compact size of 8.5 × 7 × 0.65 mm3. The proposed antennas were studied by computer simulation and their performance verified by measurement. Measured results of the implantable antenna in an anechoic chamber showed that the system could achieve a reading range of at least 30 cm, much longer than the distance of 10 cm reported for a similar system. Due to highest dielectric constant of the biocompatible alumina ceramic substrate, implantable antenna (L 4 = 1.4 mm) exhibit miniaturization, lower return loss, good voltage standing wave ratio (VSWR), better impedance matching and high gain compared to over the other implanted antennas. Therefore, the proposed antenna with L 4 = 1.4 mm is the suitable candidate for ISM band frequency of 2.45 GHz in the field of Biomedical Engineering.
 S. Ashok Kumar received his B.E. degree in Electronics and Communication Engineering from Anna University, Chennai, India, in 2006 and M.E. degree in Applied Electronics from Thanthai Periyar Government Institute of Technology, Anna University, Chennai, India, in 2009. He has 2 years of teaching experience in Adhiparasakthi Engineering College, Melmaruvathur. He is currently working toward the Ph.D. at Department of Electronics Engineering, School of Engineering and Technology, Pondicherry University (Central University), Pondicherry, India. He has authored for one book chapter and 25 journals and conference papers. His current research interest includes antenna theory, biomedical telemetry, and implantable antennas.
 T. Shanmuganantham received his B.E. degree in Electronics and Communication Engineering from University of Madras in the year 1996, M.E. degree in Communication Systems from Madurai Kamaraj University in the year 2000 and Ph.D. (Gold Medal) in the area of antennas from National Institute of Technology, Tiruchirappalli, India in the year 2010 under the guidance of Dr. S. Raghavan. He has 15 years of teaching experience in various reputed Engineering colleges such as SSN College of Engineering, National Institute of Technology and Science. Presently he is working as Assistant Professor in Department of Electronics Engineering, School of Engineering and Technology, Pondicherry University, Pondicherry. His research interest includes Antennas, Microwave/Millimeter-Wave Circuits and Devices, Microwave Integrated Circuits, EMI/EMC, Computational Electromagnetics, MEMS/NEMS, Metamaterials. He has published 125 research papers in various national and International level Journals and Conferences. He has completed one sponsored project and two projects are in the pipeline. He is a coordinator for MEMS Design Center, NPMASS. His biography was included in Marquis Who is Who in the World, USA in the year 2010. He is a member in IEEE, Life Member in IETE, Institution of Engineers, CSI, Society of EMC, ISSS, OSI, ISI, ILA, and ISTE.