

The history of the Great Chinese Famine of 1958–62 is being re-written. The conventional wisdom contends that famine caused about 30 million “excess” deaths across China and emphasizes the proximate causes of mortality: output decline, excessive procurements and over-consumption.Footnote 1 However, this interpretation has been challenged in recent years on two counts. First, the revisionists (as I shall call them) claim the death toll was much higher. Second, they focus less on the question of proximate causes (“famine accounting”) and more on the issue of agency.Footnote 2 In particular, they criticize what they call the official Party explanation – that poor weather, withdrawn Soviet aid and local cadres caused famine – and argue instead that responsibility for the famine lies primarily with Mao Zedong himself.
In this article, I evaluate the revisionist view by considering the experience of Sichuan province. The first section reviews the conventional wisdom and the revisionist literature, and outlines my methodology. I then outline the scale and geography of mortality in Sichuan, and the extent of the food availability decline. The article then addresses the agency issues: what were the respective roles of bad weather, central government and local cadres in the Sichuan famine?
Famine Perspectives, Old and New
Much of the traditional literature has been pre-occupied with what is best described as famine accounting: measuring the respective roles played by output decline, distributional failure and increased food demand. This explanation of the famine goes as follows. First, the Great Leap Forward (1958–60) reduced grain production from its 1958 peak of 198 million tonnes to a trough of 137 million tonnes in 1961. The fall reflected reduced sown area, ill-advised changes in cropping patterns (dense planting, double rice-cropping and attempts to grow wheat on land previously used to store water during the winter), the diversion of labour from farming to steel production, and poor weather. Although China became a net grain importer, importing 4.5 million tonnes in 1961 compared with net exports of 2.7 million tonnes in 1958, grain availability still declined from 296 kgs to 215 kgs per capita.Footnote 3
However, and second, food availability decline (FAD) cannot explain the mortality rise in 1958, when grain output per capita was actually higher than in 1957. The 1958 crisis was precipitated instead by an unequal distribution of food supplies.Footnote 4 Unequal distribution, caused by excessive state grain procurements and output over-reporting, also contributed to starvation during 1959–61, when food was abundant in some areas yet desperately scarce elsewhere.Footnote 5 The third factor which contributed to the famine was a rise in per capita demand. This reflected “over-consumption” in the communal canteens (where food was freely available in 1958), and an increased demand caused by the frenzied mobilization of the population to work on irrigation expansion and steel production.Footnote 6 These three causal factors together explain the scale of mortality during the Great Famine, although the precise contribution of each remains indeterminate.Footnote 7
The revisionist approach
The new revisionist literature focuses on more fundamental issues than famine accounting. First, the revisionists aver that mortality was higher than the 30 million conventionally claimed. According to Cao, the famine claimed 32.5 million lives; Yang put the total at 36 million; Chang and Halliday computed 38 million deaths, and Dikötter claims over 45 million.Footnote 8 Some of these estimates are not very plausible.Footnote 9 However, a settled mortality toll will never be agreed. This is because of data problems (such as under-reporting of infant mortality, widely revealed in the 1982 retrospective fertility survey), and because there is no unambiguous way to calculate either “normal” deaths or the (hypothetical) number of “normal” births: without the famine, there would have been more births and therefore more infant deaths.Footnote 10
The more significant contribution of the revisionists is to shift scholarly attention to the question of agency. The conventional wisdom did not ignore this question, and Mao-centred explanations of the famine are present in the older literature.Footnote 11 However, most scholars – especially economists – have been pre-occupied with famine accounting, and done little to probe the underlying causes of the famine. The revisionists have been less reticent and their conclusions are striking. For one thing, they reject the official verdict of the Maoist era according to which the famine was seven-tenths natural and three-tenths man-made (qifen tianzai sanfen renhuo 七分天灾三分人祸).Footnote 12 In particular, they argue that the 1958 famine cannot be explained by drought because there was no output decline, the only channel through which weather has an influence. And although revisionists agree that poor weather was a factor during 1959–61, its impact was not severe enough to explain the scale of starvation. The main cause of famine was therefore entitlement failure, not weather-induced FAD.
However, the most striking revisionist claim is that the Party “centre” (central and provincial governments) was primarily responsible for the catastrophe.Footnote 13 The famine, they argue, was no “tragedy of good intentions.” Rather, it was engineered by a malevolent party-state and in particular by “China's ultra-leftist emperor, Mao Zedong, who was mainly responsible for relentlessly pushing leftism.”Footnote 14 The radicalism of some provincial officials – such as Li Jingquan 李井泉 in Sichuan, Wu Zhipu 吴芝圃 in Henan and Zeng Xisheng 曾希圣 in Anhui – also contributed to the scale of mortality.Footnote 15 This coalition of Mao and radical provincial leaders precipitated the famine by imposing collective farming during 1955–56. This deprived farmers of their land-based entitlement to food, and enabled state-controlled rationing within communal canteens. Simultaneously, collective farms allowed the party-state to guarantee urban food entitlements by facilitating rural grain extraction. The Party centre was thus able to impose its will on both local cadres and farmers. According to Thaxton: “Da Fo's [the village he studied] political history … re-affirms that Mao was the major causal agent of the Great Leap calamity – not the local party cadres who were blamed and scapegoated by Mao and allies at the center of the party.”Footnote 16
The revisionists acknowledge that the Party centre was no Leviathan. Where county and village leaders resisted procurement burdens by under-reporting output, by pre-emptive consumption (eating unripe crops) or by planting famine crops (such as potatoes), the mortality toll was lower. Local resistance was not always futile: it could and sometimes did vitiate central government policy.Footnote 17 However, and this is a key revisionist point, such instances were rare. Almost invariably the will of central and provincial governments prevailed over the resistance of local cadres and farmers – who were nevertheless blamed in the early 1960s for the widespread starvation.
These revisionist claims are coherent and powerful. However, they raise methodological issues. For one thing, the claims derive from a small number of village surveys, which makes generalization difficult.Footnote 18 For another, reliance on the memory of village informants is problematic. The passage of time inevitably adds colour to memories and, more importantly, memory is socially constructed: villagers are telling what they believe to be true, but their revelations are conditioned by a desire to preserve social “harmony” rather than to assign responsibility.Footnote 19 Accordingly, we must subject the revisionist claims to careful scrutiny before accepting them. Such is the purpose of this article.
Methodology
In order to evaluate the revisionist claims, I start from the premise that bad weather should not be dismissed a priori. It is true that weather-based explanations were discounted even in the conventional wisdom. Kueh, whose work provides the most detailed assessment of the impact of poor weather, concluded that it explained barely 20 per cent of output decline in 1960 and 1961; the main culprit was a policy-driven reduction in sown area.Footnote 20 However, this analysis was based upon provincial weather data. This is methodologically very dangerous. It has, for example, been claimed that Sichuan experienced normal conditions during the famine years. Although this is accurate if one considers average provincial rainfall, the average is deeply misleading: in Sichuan's case, the combination of flooding in the west and drought in the east simply cancelled out to produce apparent normality.Footnote 21 To avoid this problem we need a more disaggregated approach. I therefore utilize previously unused data on rainfall and temperature collected by county weather stations to assess the true impact of drought and flooding on mortality.
Second, the revisionist claim that local cadres were largely powerless to resist central and provincial government demands can be tested. If the claim is correct, there should be a pattern to the geography of mortality, reflecting the unequal – but not random – treatment of localities in terms of procurement quotas. In particular, we would expect low mortality in localities where transport links were poor and growing conditions were unfavourable because these counties were not procurement targets: even the radicals did not expect big increases in output in mountainous areas with poor soil and water shortages, Conversely, we would expect to observe high mortality rates where transport links were good and agricultural productivity high because a powerful provincial and central government would have been able to impose high procurements on such counties, increasing death rates. However, if mortality rates were often driven by local cadre behaviour, we would expect a random pattern of mortality. Any counties dominated by “radical” cadres would have experienced very high mortality rates, while some prosperous and well-located counties would have emerged from the Leap with low numbers of famine deaths as “moderate” local cadres evaded and ignored the centre's policies.
Accordingly, we can evaluate the revisionist claims using county-level data on mortality, grain output and weather to identify whether the geography of mortality was random, or followed a pattern.Footnote 22 A national analysis of county data would be ideal, but it is impracticable because of the volume of data required. In any case, spatial variations in famine mortality within Chinese provinces were typically so large that the province serves as an adequate test of the hypothesis that central government policy was decisive. Sichuan is an obvious choice here because it was the Chinese province with the highest absolute death toll.Footnote 23 I therefore address these issues using county-level data drawn from the various County Records (Xianzhi 县志) and weather data collected at more than 20 Sichuan weather stations. I begin by outlining the scale and pattern of mortality.
The Sichuan Famine, 1958–1962Footnote 24
The famine in Sichuan started earlier (in 1958) than elsewhere: the all-China crude death rate (CDR) in 1958 was marginally higher than in 1957, but in Sichuan it rose from 12 to 25 per thousand. The Sichuan famine was also more severe than almost anywhere else in China.Footnote 25 Not only was the average CDR for 1958–61 (39 per thousand) well above the national average of 17 per thousand but also the peak rate in Sichuan (54 per thousand in 1960) was higher than in every Chinese province except Anhui (69 per thousand).Footnote 26 Moreover, although the rate was higher in Anhui, the overall death toll was greater in Sichuan.Footnote 27
The proximate determinants of mortalityFootnote 28
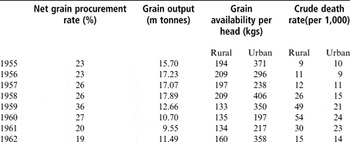
The fall in per capita grain availability in the early 1960s played a key role in Sichuan's famine. The decline was sharp: rural availability fell from around 197 kgs per head in 1957 to a low of 133 kgs in 1959 (Table 1).Footnote 29 Some of this 64 kg decline reflected higher procurements. The net rate peaked at 38 per cent in 1959, driven by “exports” to other provinces and in-kind debt repayments to the USSR. Extraction was facilitated by the completion of the railway between Baoji 宝鸡 in Shaanxi province and Chengdu, which linked Sichuan to the national network in September 1956. However, even if procurements had remained at their 1957 rate, rural grain availability in 1959 would still have been no higher than 155 kgs per head. As subsistence required about 200 kgs of processed grain, an allowance of only 155 kgs would have meant starvation.Footnote 30 We can therefore state unequivocally that the decline in per capita grain output – which contributed 42 kgs of the 64 kgs fall between 1957 and 1959 – was the main proximate cause of FAD.Footnote 31
Grain Output, Procurements and Mortality in Sichuan

Notes: “Availability” means grain which could be used directly and indirectly (feed, food processing etc.). It is net of husking, resales, and exports to the USSR and other provinces but excludes stock changes.
Sources: Zhonggong Sichuan sheng wei yanjiushi (Research Unit of the Sichuan Committee of the CCP), Sichuan sheng qing(Conditions in Sichuan) (Chengdu: Sichuan renmin chubanshe, 1984) pp. 559, 571; Sichuan tongjiju (Sichuan Statistical Bureau), Sichuan tongji nianjian 1990 (Sichuan Statistical Yearbook 1990) (Beijing: Zhongguo tongji chubanshe, 1990) (SCTJNJ 1990), pp. 57–58.
This calculation of the FAD, and the contribution of procurements to that decline, is crude. It exaggerates the decline in food supplies because it neglects stock depletion and higher husking rates during the famine years.Footnote 32 Moreover, it underestimates the impact of procurements by ignoring the indirect effects on output: villagers could often meet quotas only by selling seed grain, thus compromising the harvest in the following year. Yet despite this imprecision, it is certain that Sichuan experienced FAD and that this decline made a significant contribution to the famine. This suggests that Sichuan's experience differed from Thaxton's Da Fo village (Henan), where there was seemingly no decline in per capita output.
Spatial variations in mortality
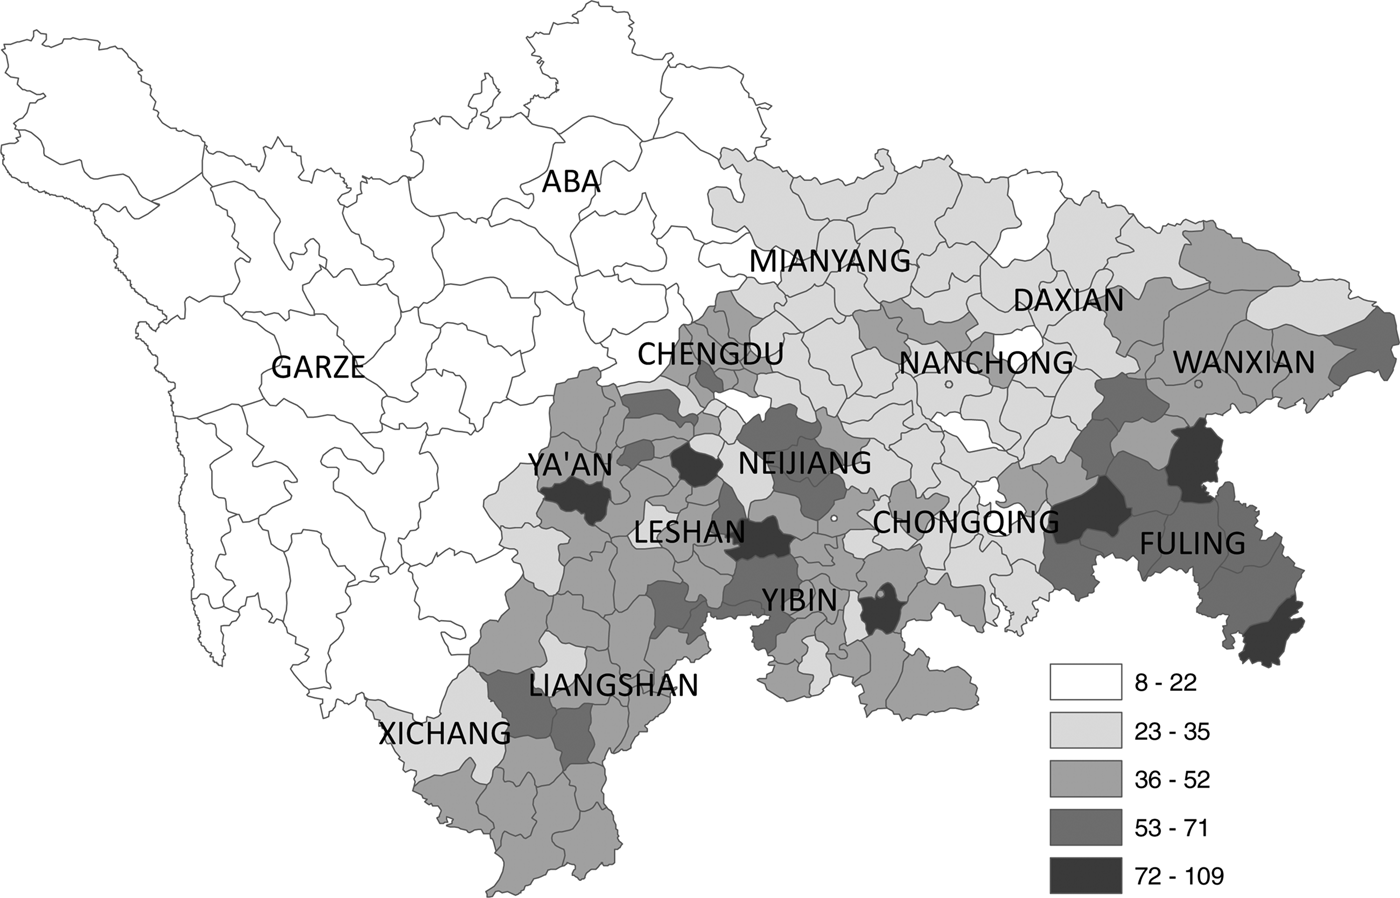
Although most Sichuan counties experienced higher mortality during 1959–61, there were massive variations in crude death rates (Figure 1).Footnote 33 Mortality rates were low in three places. The first was in Sichuan's cities. The urban CDR averaged a (comparatively) modest 21 per thousand during 1958–61: in both Chengdu and Chongqing districts, the mortality rate in the urban core was well below that in the outlying counties.Footnote 34 Second, mortality was low in Himalayan Aba 阿坝 and Ganzi 甘孜 districts, suggesting that Sichuan's Tibetan minority suffered less than the Han majority; official estimates of the CDR for the Tibetan minority show that it peaked at 18 per thousand in 1961, well below the provincial peak of 54 per thousand in 1960.Footnote 35 Third, mortality was generally lower in northern Sichuan and the central Sichuan basin.
Crude Death Rates by County in Sichuan, 1958–1961 (annual average, per 1,000)
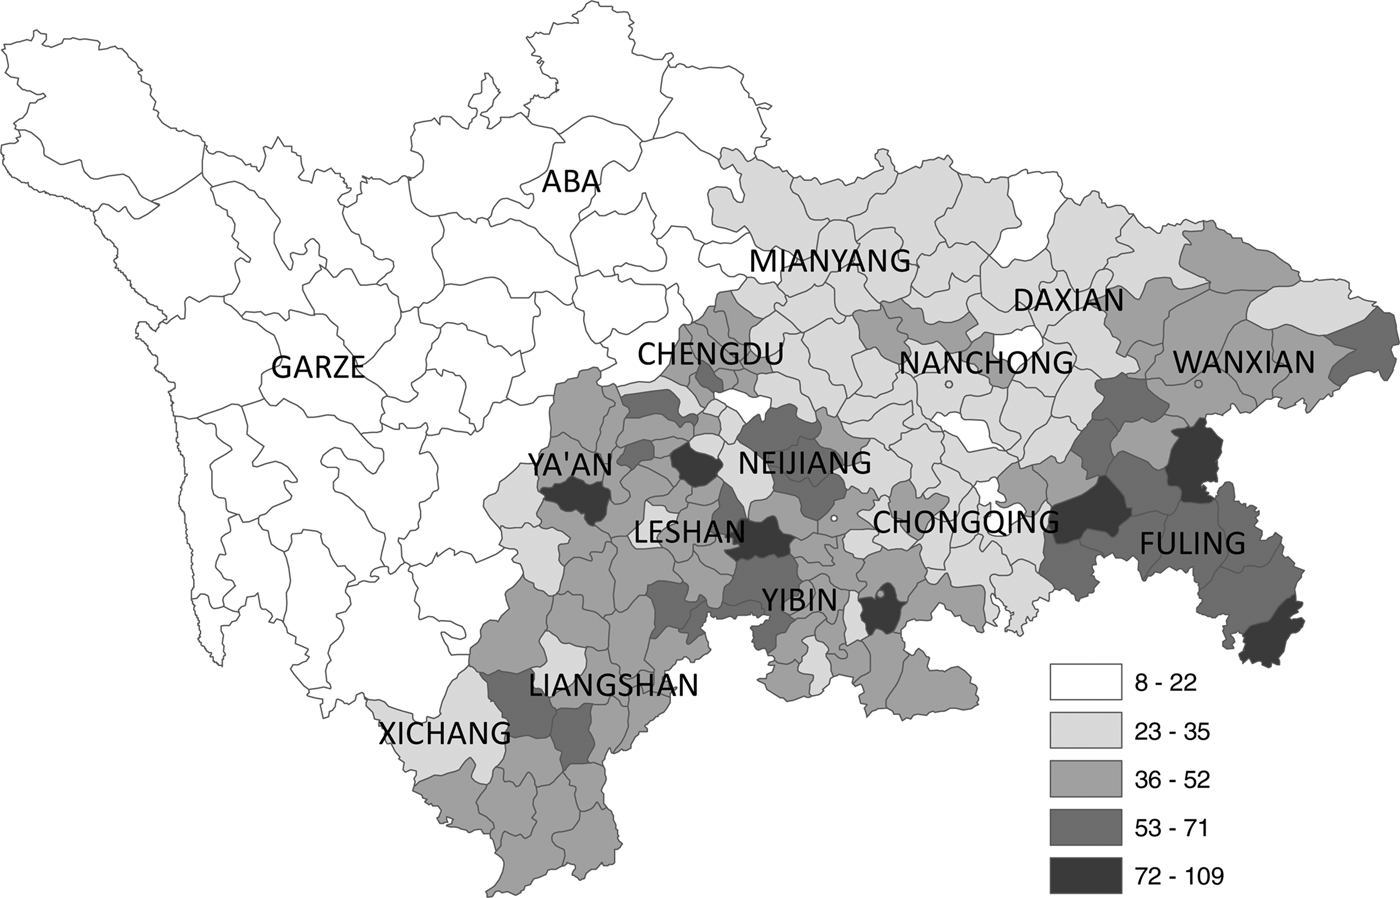
By contrast, the highest district level of mortality was recorded in Fuling 涪陵, where the CDR for 1958–61 averaged 64 per thousand. Even this understates the intensity of the famine. The death rate actually exceeded 100 in six of the eleven counties in one year or other in Fuling. Death rates were also high in Ya'an 雅安 and Neijiang 内江 districts (47 and 48 per thousand in the respective median counties). Moreover, starvation was commonplace even close to the provincial capital: the CDR in the median county of Chengdu district was 45 per thousand for 1958–61. But even these horrendous district-level medians only hint at the exceptionally high CDRs recorded in some Sichuan counties. It exceeded 100 per thousand in 23 counties in one or other year, and surpassed 150 per thousand in five.Footnote 36 In the three counties of Dayi 大邑, Xiushan 秀山 and Yingjing 荥经, the rate exceeded 100 in successive years. Unsurprisingly, it was a Fuling county (Shizhu 石柱) which recorded the highest three-year CDR (109 per thousand) reported in Sichuan for 1959–61.Footnote 37
One of the key tasks, then, in assessing the Sichuan famine is to explain these spatial variations in mortality. It is of course important to explain why the average provincial crude death rate rose from 12 per thousand in 1957 to 54 per thousand in 1960. However, we also need a theory which explains the massive local variation in death rates. Why was it that the CDR in Pi 郫 county soared from 12 per thousand in 1956 to 175 per thousand in 1960, whereas in nearby Shuangliu 双流, which started from the same mortality rate in 1956, it never exceeded 37 per thousand?
Bad Weather and the Sichuan Famine
In order to explain both the overall mortality rise and the spatial variations in mortality across Sichuan, I start by assessing the impact of poor weather. Was mortality extreme in (for example) Pi county because it was the victim of poor weather?
Although weather has sometimes been dismissed as a propaganda-based explanation of the Great Famine, there is nothing inherently implausible in the notion that bad weather played a key role in the Sichuan catastrophe. Chinese geographers estimate that there is 70 per cent chance of drought – the main threat – every ten years in the area around Fuling and Mianyang 绵阳, and about 30 per cent elsewhere in the Sichuan basin.Footnote 38 Moreover, there is some evidence, admittedly not entirely consistent, that drought caused famine in 1937.Footnote 39 A weather-based explanation of the Sichuan famine therefore cannot be ruled out a priori.
Accordingly, I proceed to assess the effects of bad weather by employing the figures assembled in two datasets covering respectively 160 and 205 weather stations across China. By using the data collected at a weather station in each Sichuan district, we can establish the pattern of rainfall.Footnote 40 As far as 1958–61 is concerned, it is true that rainfall at the median Sichuan weather station was just 4 per cent higher than the 1951–80 average, a modest variation. However, this provincial median is misleading. First, rainfall is only one dimension of weather; we must supplement it with temperature data. Second, the provincial median averages out extremes of flooding and drought: flooding in Mianyang and Chengdu districts – rainfall there was over 30 per cent above average for the four years – cancelled out drought in (for example) Chongqing, where rainfall was 20 per cent below average. Third, the four-year median obscures sharp year-on-year fluctuations, and acute summer drought. In Neijiang, for example, rainfall was 39 per cent below normal in 1958. In Fuling, the shortfall was 367 mms over the whole of 1959 and rainfall was barely 44 per cent of average in July–August. In 1960, the Fuling rainfall deficit was less than in 1959 and 1961. However, this disguises the 47-day drought between 17 July and 1 September (the worst of the Maoist era): only 34 mms of rain fell, as against 245 mms in a normal year.
To capture the impact on output of these regional, annual and seasonal variations, I estimate a production function incorporating an aridity index. I assume that the grain production function was Cobb-Douglas in form, and that the main determinants of output were grain sown area, the size of the rural labour force, the input of fertilizer, a time trend and the degree of aridity. When the weather is normal, the aridity index takes a value of one and its natural log is zero. In order to calculate the aridity index, I use monthly data on rainfall and temperature for five Sichuan weather stations during May–August, the main growing period for rice.Footnote 41 The provincial average is based on the sum of the deviations at the five stations. I also assume that only drought conditions seriously affect output because of the dominance of rice production across Sichuan; only if rice had been submerged for a long period would output losses have been significant, and this was a rare event in well-drained paddy fields.Footnote 42
My calculations suggest that poor weather played a modest role in causing the Sichuan famine. The coefficient on the aridity index obtained from the production function is 0.33. This suggests that drought reduced grain output (relative to 1957) by about 5 per cent in 1959, 4 per cent in 1960 and 4 per cent in 1961. Drought thus explains about 20 per cent of the output decline in 1959, 11 per cent in 1960 and nine per cent in 1961. These are modest contributions and, given that poor weather can only cause famine via output decline and that output decline was only one cause of famine,Footnote 43 it follows that poor weather cannot have been the main causal factor. More precisely, 42 kgs of the 66 kg decline in food availability in 1959 (compared with 1957) can be explained in terms of output decline, and only 20 per cent of that 42 kg output decline can be explained by the weather. In other words, only 8 kgs (12 per cent) of the Sichuan FAD in 1959 – when drought was most intense – can be explained by poor weather.
These econometric procedures are crude. There are potential problems associated with colinearity and endogeneity,Footnote 44 the data are not fully reliable, and we really need separate production functions for each Sichuan agricultural region because of differences in the composition of grain output. Additionally, it would be better to calculate an aridity index using data for every Sichuan weather stations (not just five) and for every month (and not merely the summer). Nevertheless, the approach appears relatively robust. Experimentation with different forms of the production function does not significantly alter the conclusions. Moreover, district-level evidence suggests little correlation between weather fluctuations and output. For example, output in the districts of Yibin 宜宾, Neijiang and Daxian 达县 was over 40 per cent lower in 1961 than in 1957, yet rainfall was virtually normal. Chongqing and Neijiang (as previously noted) were hard-hit by drought in 1958, yet per capita output actually rose.
Still, we cannot ignore the contribution of weather in parts of Sichuan. In Fuling district, for example, in the summer of 1961, rainfall was barely 10 per cent of normal and the fall in rice production – the crop most affected by summer drought – was particularly severe. Across Sichuan, rice output in 1961 was 50 per cent below its 1958 level, but in Dianjiang 垫江 and Fuling counties, production was barely 20 per cent of the 1958 peak.Footnote 45 But drought was most damaging in Fuling in 1959, when rainfall was 50 per cent of the total required. The production function approach discussed earlier suggests that this 1959 drought reduced grain output by 14 per cent compared with 1957. As the total fall in output in 1959 was 24 per cent, poor weather was evidently the most important factor in reducing output in that year.
Agents of Famine: The Provincial Government and Local Cadres
Fuling's experience, however, was the exception. For Sichuan taken as a whole, human agency, rather than poor weather, was the key causal factor. What, however, of the respective parts played by the provincial government and local cadres in the Sichuan catastrophe? Should the Party centre be blamed, as the revisionists assert, or does much of the responsibility lie with local cadres?
The role of the provincial government
The “radicalism” of Li Jingquan, the provincial Party secretary, undoubtedly played a deadly role.Footnote 46 Of course the policies pursued in Sichuan originated with the central government, but Li's radical interpretation of them undeniably exacerbated the famine.
Li was a radical well before the Leap. Although the pace of collectivization seemed slow in the mid-1950s, this was because Li had promoted the creation of large lower stage co-operatives in 1955. These proved very inefficient, so much so that they had to be dissolved before higher stage co-operatives (that is, collectives) could be established. Li also pushed for high rates of investment, accepted high procurement quotas and was an ardent advocate of the 12 Year Agricultural Plan in the mid-1950s, which together created the “supply crisis” of 1956–57, an eerie foretaste of the Leap.Footnote 47
Li Jingquan's radicalism was not extinguished by the failures of the mid-1950s. Instead, Sichuan was one of China's most radical provinces during the Leap. For example, Li was keen for Sichuan to increase its net grain exports (to the USSR and other provinces). In consequence, and despite being a modest per capita grain producer, Sichuan exported more grain than any other province in every year between 1957 and 1961, and was a net exporter even at the height of famine in 1959–60.Footnote 48 At a local level, the burden was often crippling. For example, Shifang 什邡 county on the Chengdu plain exported a staggering 44 million kgs of its grain output of 95 million kgs in 1959.Footnote 49
A second instance of Li's radicalism was the high investment rate, especially in 1959 when it reached 35 per cent. Although this was lower than the national average (44 per cent), the burden in terms of “lost” consumption was much higher in a poor province like Sichuan.Footnote 50 Third, Li Jingquan promoted rapid rural industrialization. This drew much labour out of farming and into the cities, such that Sichuan's rural labour force fell by 17 per cent during 1957–58, whereas it rose by 4 per cent nationally.Footnote 51 With many farmers temporarily engaged far from home in iron and steel production – for example, 30,000 of the farmers resident in Renshou 仁寿 county had been sent to Hongya 洪雅, some 80 kms to the west – the residual farm labour force was not large enough to collect the harvest.Footnote 52 For Sichuan as a whole, 10 per cent of the (notional) 1958 harvest allegedly rotted in the fields.Footnote 53 Fourth, Sichuan created communes unusually quickly. By the end of September 1958, 97 per cent of households were in communes.Footnote 54 By contrast, Guizhou accomplished this only in February 1959. Canteens were also introduced earlier (by October 1958, 95 per cent of households were eating there),Footnote 55 closed late, and provided a larger proportion of “free” food than elsewhere.Footnote 56 Additionally, Sichuan introduced brigade-level accounting, despite the prevalence of team-level accounting in other provinces and Mao's own opposition.Footnote 57 Finally, Sichuan pioneered changes in cropping patterns. The province moved quickly to eliminate winter-flooded fields (dongshuitian 冬水田)Footnote 58 – whereby paddy fields were flooded during the winter as a hedge against drought the following spring – so that winter wheat acreage could be expanded.Footnote 59 Simultaneously, sown area was cut: Sichuan's grain-sown area fell by 15 per cent in 1959 compared with the national fall of only 9 per cent.Footnote 60 These cuts in sown area, along with falling yields, were central to declining grain output in 1959–61.
Spatial variation and the role of local cadres
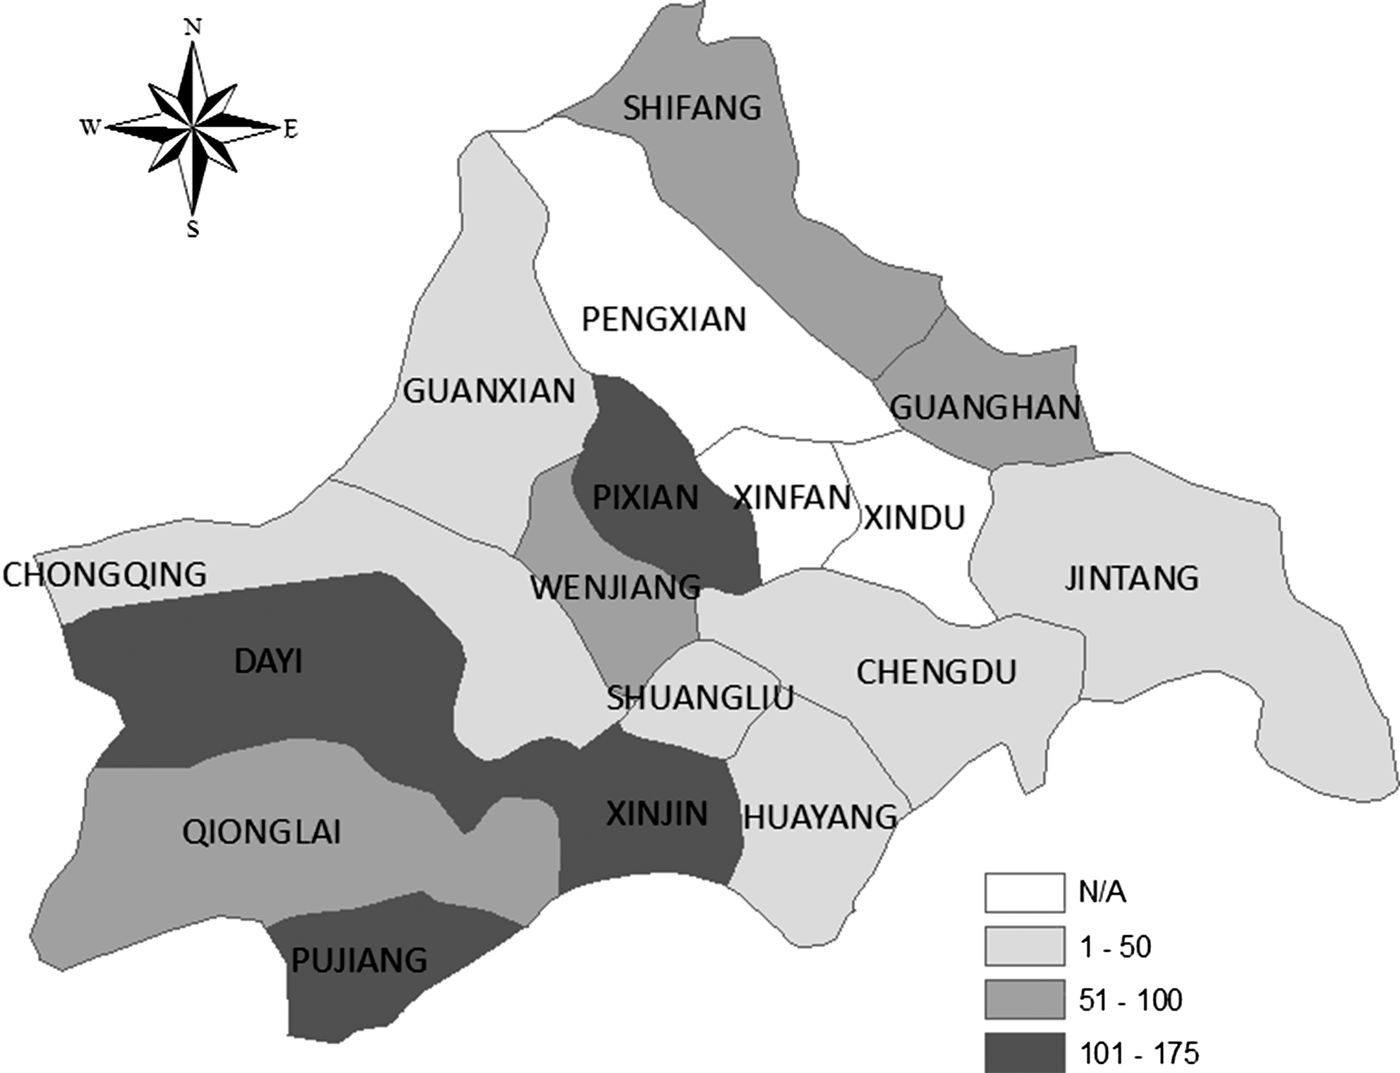
Nevertheless, neither the influence of central government nor the radicalism of Li Jingquan explains the marked spatial variation in mortality rates. Consider the experience of Chengdu district. In such a topographically similar area, weather variations between counties were comparatively small. Moreover, Chengdu's counties were similar in economic geography, economic structure and per capita output: located on the fertile Chengdu plain and within close reach of the new Chengdu–Baoji railway, these were Sichuan's most prosperous counties. Unsurprisingly, they were singled out for grain procurements and industrial development by the Party centre. Yet despite their structural and locational similarities, the variation in mortality rates amongst these counties in 1960 is striking (Figure 2).
Crude Death Rates on the Chengdu Plain by County, 1960 (deaths per 1,000)
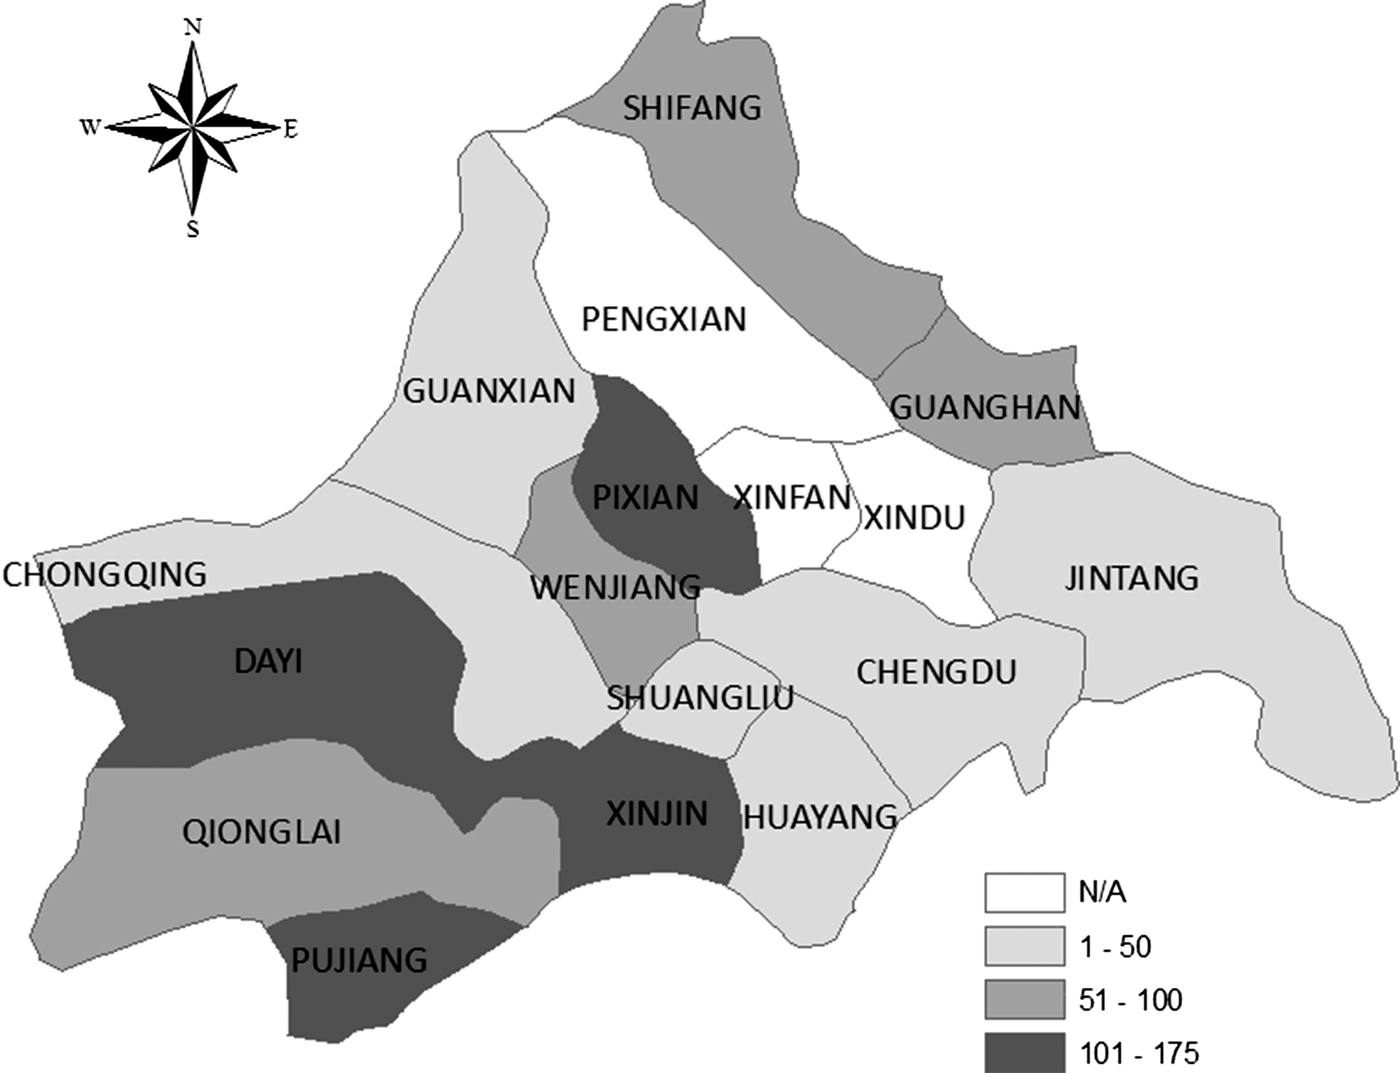
The evidence suggests that differences in local cadre responses to central and provincial government initiatives explain these mortality variations. Where cadres meekly accepted high procurement quotas, cuts in sown area and orders to invest heavily in industry, mortality soared.Footnote 61 It was no accident that the death rate (175 per thousand in 1960) was especially high in Chengdu's Pi county. The compliers of the County Records blame local radicalism for this, and no wonder. Its cadres were radicalized by Mao's visit on 16 March 1958 and by the presence of Deng Xiaoping – a radical in those days – on 18 March. Consequently, the county established Sichuan's first commune on 19 August 1958. Moreover, Pi's cadres also accepted high procurements, which rose from 48 million kgs of unhusked grain in 1956 to 135 million in 1959, over 50 per cent of output.Footnote 62
Yet the mere fact of a visit by Mao does not explain the intensity of famine: it was the response of local cadres that was critical. Neighbouring Guan 灌 county, now Du river dam (Dujiangyan 都江堰) city, was also visited by Mao, this time on 21 March 1958. The policies adopted in the county adhered closely to the Party centre line. Local cadres increased grain procurements from 37 million kgs in 1957 to 50 million in 1959, and doubled the non-agricultural population between 1957 and 1959 to develop industry and widen the area irrigated by the celebrated Dujiangyan. Even so, Guan's cadres were far less zealous than their neighbours in Pi county. Even at its peak in 1960, Guan's crude death rate of 50 per thousand was less than the provincial average and far below the 175 per thousand in Pi county.Footnote 63 It was a similar story in Shuangliu (where peak mortality rate was only 37 per thousand) and in Chongqing county (27 per thousand).
It seems, then, that local cadre responses, not differential economic treatment by the Party centre, best explain mortality variations around Chengdu. The evidence for other parts of Sichuan supports this contention. As shown above, Fuling district was hard-hit by drought, and mortality rates were well above the provincial norm. Yet drought cannot explain why modest 1960 mortality rates in Ba 巴, Changshou 长寿 and Pengshui 彭水 counties of 31, 41 and 55 per thousand respectively co-existed alongside the very high rates of 168 and 163 per thousand suffered by neighbouring Shizhu and Fengdu 丰都 respectively.Footnote 64 The whole region suffered drought, not just one or two counties. Consider also Ya'an district, west of Chengdu. The peak death rate in the median Ya'an county was 67 per thousand, but this again disguises local variations. In Shimian 石绵, the death rate was below 33 – yet in nearby Yingjing, it reached 151 per thousand in 1959 and 112 per thousand in 1960.Footnote 65 Ya'an district was a procurement target: most of its counties were accessible by road from Chengdu. However, it was the radicalism of Yingjing's two Party secretaries that caused starvation. 1958 saw both the early creation of communal canteens (the process was completed by September) and a massive campaign to promote steel production.Footnote 66 The resultant labour shortages ensured that much of the harvest was not collected. Worst followed in 1959 when grain procurement rose from 4 to 10 millions kgs; with 1959 output down by about 50 per cent because of labour shortages, this meant that the (gross) procurement burden rose from 14 to a colossal 80 per cent. In 1960, gross procurements increased still further, reaching 11 million kgs – more than the grain harvest for that year (9 million tonnes) – making widespread starvation almost inevitable.Footnote 67
This contention that variations in mortality patterns across Sichuan were largely random is supported by the evidence in Figure 1. There is little to suggest that mortality was concentrated along the main transport arteries (the Baoji–Chengdu railway and the central riverine zone), though that is what one would expect if central government procurement policy was decisive. Moreover, prosperity offered no security against starvation: Pixian's population starved, yet Chongqing's was barely affected even though both were amongst Sichuan's most prosperous counties. But poverty offered no inoculation against famine either: Fuling's Shizhu and Fengdu counties were amongst the poorest in the entire Sichuan basin and yet mortality was extreme in both.Footnote 68
This conclusion that mortality patterns lack any obvious pattern is supported by formal econometrics. To test the conclusion, I assume that changes in mortality between 1956–57 and 1958–61 were a function of three factors: the extent of the output decline, the level of per capita output in 1956–57, and location. If mortality was driven by central government policy, we would expect the highest mortality rates in counties which were procurement targets – that is, counties which produced a surplus (as measured by per capita output), and which were accessible (so that the surplus could be extracted and exported to other cities and provinces). In other words, the revisionist hypothesis implies that the regression coefficient on both per capita output in 1956–57 and location should be positive.Footnote 69 As it turns out, both location and per capita output in 1956–57 are statistically significant in the sample of 84 Sichuan counties for which I have data. However, the results are not robust. Rather, they depend upon the inclusion of five poor counties located on the Himalayan plateau, which produced little grain (because of geographical disadvantage) and which did not even establish communes until the 1970s.Footnote 70 Once these five anomalous counties are excluded from the sample, neither the coefficient on per capita output nor that on location is statistically significant.
In short, the geography of mortality across Sichuan was determined primarily by the attitude of local cadres and (to a lesser extent) the weather. Mortality rates in counties like Pi, Yingjing and Shizhu were exceptionally high because their cadres were over-zealous in their interpretation of the policies pursued during the Leap – not because they were targeted by central or provincial government.
Conclusion
The Sichuan evidence does not support the revisionist contention that the scale of the famine was caused primarily by the Party centre. Although the famine was man-made, revisionist emphasis on the role played by central and provincial governments seems over-stated. Differences in the attitudes of provincial leaders certainly help to explain variations in mortality across provinces.Footnote 71 But local leaders were as culpable as the “malevolent” provincial and central committee cadres who constituted the Party centre. As I have argued, the geography of mortality was essentially random across Sichuan: it is hard to detect the guiding hand of a radical provincial leader in any of this. Mortality rates were not systematically higher in those counties which might have been singled out – by their productivity and transport links – by a radical provincial leader for penal procurement quotas. On the contrary. The variation in mortality between counties with very similar economic structures and located within the same district is so great as to defy systematic explanation. It can be plausibly explained only by differences in local cadre behaviour.
Of course the Party centre created the context for starvation by launching the Leap. After all, the famine affected the entire Sichuan basin: the mortality rate in 1959–61 exceeded that of 1956–57 in almost every county in central and eastern Sichuan. Only the Himalayan counties of western Sichuan escaped. This shows that there was a general macroeconomic policy failure, and local cadres cannot be blamed for that. Moreover, the famine was primarily man-made. Of course some districts were hard-hit by drought: over 50 per cent of the output decline in Fuling in 1959 was due to summer drought. But Fuling was the exception – and even there the 1959 drought was devastating only because of the premature assault on the dongshuitian, the traditional system of irrigation. The Sichuan famine was not, therefore, primarily a natural disaster.
Yet in the genesis of this man-made catastrophe, the contribution of local cadres was far more important than the revisionists would have us believe.Footnote 72 The worst excesses of central government policy during the Leap could be resisted, and the variation in death rates across the province shows that, in many parts of Sichuan, they were resisted by local leaders. These local cadres were not merely passive participants in the drama which unfolded across Sichuan in the late 1950s and early 1960s. Rather, in those parts of the province where starvation was extreme, local cadres were as much agents as victims. Attempts to shift the blame for the Great Famine from local leaders to the Party centre and to Mao himself therefore do not square with the evidence. The Party centre was in no sense as powerful as the revisionists claim: the starvation that occurred during the Leap depended as much upon the willing participation of a myriad of “ordinary” local cadres as it did upon the orders of Mao Zedong.