1. Introduction
Many studies have explored the mechanisms of nanoparticle (NP) formation in low-temperature plasmas for various applications extending from electronics (Grieve, Mulvaney & Grieser Reference Grieve, Mulvaney and Grieser2000), optics (Kelly et al. Reference Kelly, Coronado, Zaho and Schatz2003), magnetism (Wei et al. Reference Wei, Skomski, Balamurugan, Sun, Ducharma and Sellmyr2009) and catalysis (Cuenya Reference Cuenya2010) to biology or medicine since nanoscale materials present enhanced properties compared to those of bulk materials (Chauduri & Paria Reference Chauduri and Paria2012). Various ionization sources can be used in this domain such as radio-frequency discharges (Couedel et al. Reference Couedel, Mikikian, Samarian and Boufendi2010), microwave electron cyclotron resonance discharges (Ouaras et al. Reference Ouaras, Hassouni, Colina Delacqua, Lombardi, Vrel and Bonin2015; Rojo et al. Reference Rojo, Glad, Margot, Dap and Clergeraux2019) and DC discharges (Kishor Kumar, Couedel & Arnas Reference Kishor Kumar, Couedel and Arnas2014; Michau, Hassouni & Arnas Reference Michau, Hassouni and Arnas2017) as well as magnetron sputtering discharges in a gas-aggregation system (MS-GAS) (Kashtanov, Sirnov & Hippler Reference Kashtanov, Sirnov and Hippler2007; Hartmann et al. Reference Hartmann, Popok, Barke, Von Oeynhausen and Meiwes-Broer2012; Caillard et al. Reference Caillard, Cuynet, Lecas, Andreazza, Mikikian, Thomann and Brault2015) and conventional magnetron discharges that we use for basic studies on NP formation (Arnas et al. Reference Arnas, Chami, Couedel, Acsente, Cabie and Neisius2019). For a given plasma source, NP formation depends strongly on the discharge conditions (geometry, magnetic field configuration if any, discharge current and voltage, gas pressure and temperature). These conditions also determine the plasma parameters at the origin of the charging, heating and transport of the NPs in the plasma as well as their internal features such as morphology, size and crystallinity from which potential applications can be considered. Plasma parameter measurements are therefore of prime interest.
Few measurements have been reported on plasma parameters for the conditions of magnetron discharges operating at rather high pressure for NP production. Langmuir probes (LPs) were used in some cases in MS-GAS in a single position under the racetrack (Koten et al. Reference Koten, Voeller, Patterson and Shield2016), and recently in radial and axial directions of MS-GAS, when the cathode is in a partially oxidized state (Kousal et al. Reference Kousal, Kolpakova, Shelemin, Kudrna, Tichy, Kylian, Hanus, Choukourov and Biederman2017). Conversely, numerous measurements and modelling were performed to describe magnetron discharges operating at low pressure (<0.05 mbar) (Field, Dew & Burrell Reference Field, Dew and Burrell2002) in order to improve deposition rates and specific coating qualities (Depla & Leroy Reference Depla and Leroy2012). For instance, a complete study of the spatial variations of plasma potential was conducted to find the electron E × B drift velocities near the cathode and in the plasma volume (Bradley, Thompson & Aranda Gonzalvo Reference Bradley, Thompson and Aranda Gonzalvo2001). A complete three-dimensional map of the plasma parameters was established pointing out the racetrack region where the most intense ion bombardment takes place (Palmero et al. Reference Palmero, Van Hattum, Arnoldbik, Vredenberg and Habraken2004).
In this article, we present measurements in two spatial dimensions of the magnetic field and plasma parameters of conventional DC magnetron discharges during the formation of NPs. The latter are synthesized from the sputtering of the cathode in tungsten at an argon pressure of 0.3 mbar. Measurements of the magnetic field were carried out with a Hall probe without plasma and a LP was used to find the plasma parameters. Correlations between the magnetic field strength and lines, and the spatial variations of the electron density and temperature have been established. A sharp increase of the plasma potential was found around the last magnetic arch allowing the deduction of the potential energy of a negatively charged NP. A potential well was found and its role is discussed.
2. Experimental set-up and diagnostic procedures
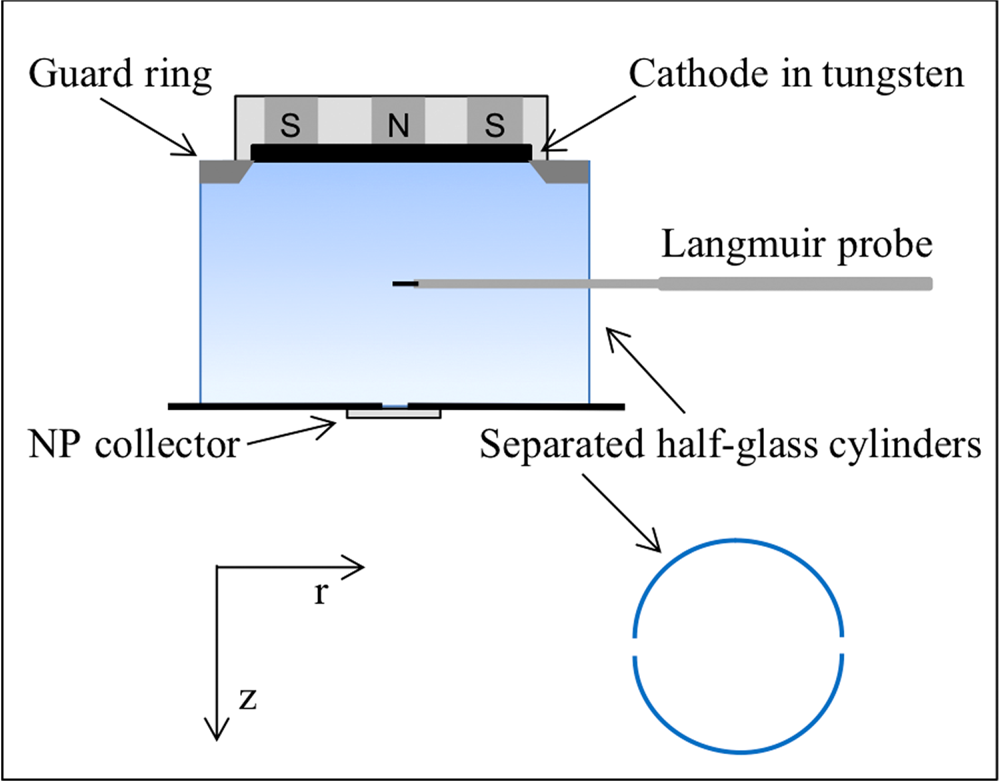
The experimental set-up was already presented (Arnas et al. Reference Arnas, Chami, Couedel, Acsente, Cabie and Neisius2019) and is schematized in figure 1. Experiments are conducted in a stainless steel cylinder of 40 cm in length and 30 cm in diameter. The ionization source is an unbalanced planar magnetron system (mcse-ROBEKO). The cathode is a tungsten disc (99.95 % purity) of 7.6 cm in diameter and 0.3 cm in width. A grounded guard ring of 2 cm in width and 1 cm in height (~7.4cm inner diameter) is set under the cathode at a distance of ~0.2 cm. A grounded stainless steel disc of 15 cm in diameter (anode plate) is placed parallel to the cathode at 10 cm. Two half-glass cylinders, 12 cm in diameter and 10 cm long, are placed around this magnetron system. In order to insert a LP in the plasma, the half-glass cylinders are separated by two diametrically opposed gaps of ~1.5 cm.
Experimental set-up. The lower-right part represents the top view of the two half-glass cylinders. They are slightly opened to allow introduction of a LP. This set-up is inside a stainless steel cylinder.

Discharges are produced in argon at 0.3 mbar and 5 sccm (standard cubic centimetres per minute) flow rate. The discharge current is maintained constant at 0.3 A using a DC current-regulated power supply (Glassman HV, 1 A–1 kV) and the discharge voltage self-adjusts to approximately −200 V. The formation of NPs and then their sampling are carried out on stainless steel polished substrates, which are pushed one after the other under a hole drilled in the centre of the anode disc. The description of their formation in such discharge conditions and geometry as well as their structural properties were already reported in Arnas et al. (Reference Arnas, Chami, Couedel, Acsente, Cabie and Neisius2019) and will not be discussed in this article.
A Hall probe was used to measure the magnitude of the magnetic field when the discharge was not operational. For this, a small gallium arsenide semiconductor plate of 0.1 cm × 0.1 cm embedded in a thin long resin stripe linked to a gaussmeter (GM08-HIRST) was used. This sensor was displaced radially every 0.2 cm from r = −5 to r = 5 cm, 0 cm being the centre of the cathode. These measurements were repeated vertically every 0.5 cm from 0.4 cm of the copper baking plate where the cathode plate is fixed to the anode plate. Measurements were taken directly with the calibrated gaussmeter.
A homemade cylindrical LP consisting of a tungsten wire 0.0125 cm in diameter and ~1 cm in length was used to measure the plasma parameters. The probe axis was displaced radially, every centimetre from r = −2 to r = 6 cm (position of the glass tubes). The same radial measurements were made by moving the probe vertically every centimetre from z = 2 to z = 9 cm (or 1 cm above the anode plate). To avoid the LP contamination, the plasma duration was limited to the time necessary for probe cleaning by electron bombardment (several seconds, several times), and then to the time necessary to acquire three LP characteristics in ~15 s. Several series of characteristics were obtained for a given z and the LP was changed in every z position. A commercial driver (Princeton Instruments) was used for LP cleaning and current–bias (I–V) acquisition every δV ~ 200 mV. The I–V data were then collected with a 12-bit A/D convertor (National Instruments). Homemade programs using the software Matlab allowed establishing the spatial magnetic field strength and lines as well as the plasma parameters.
3. Spatial distribution of the magnetic field
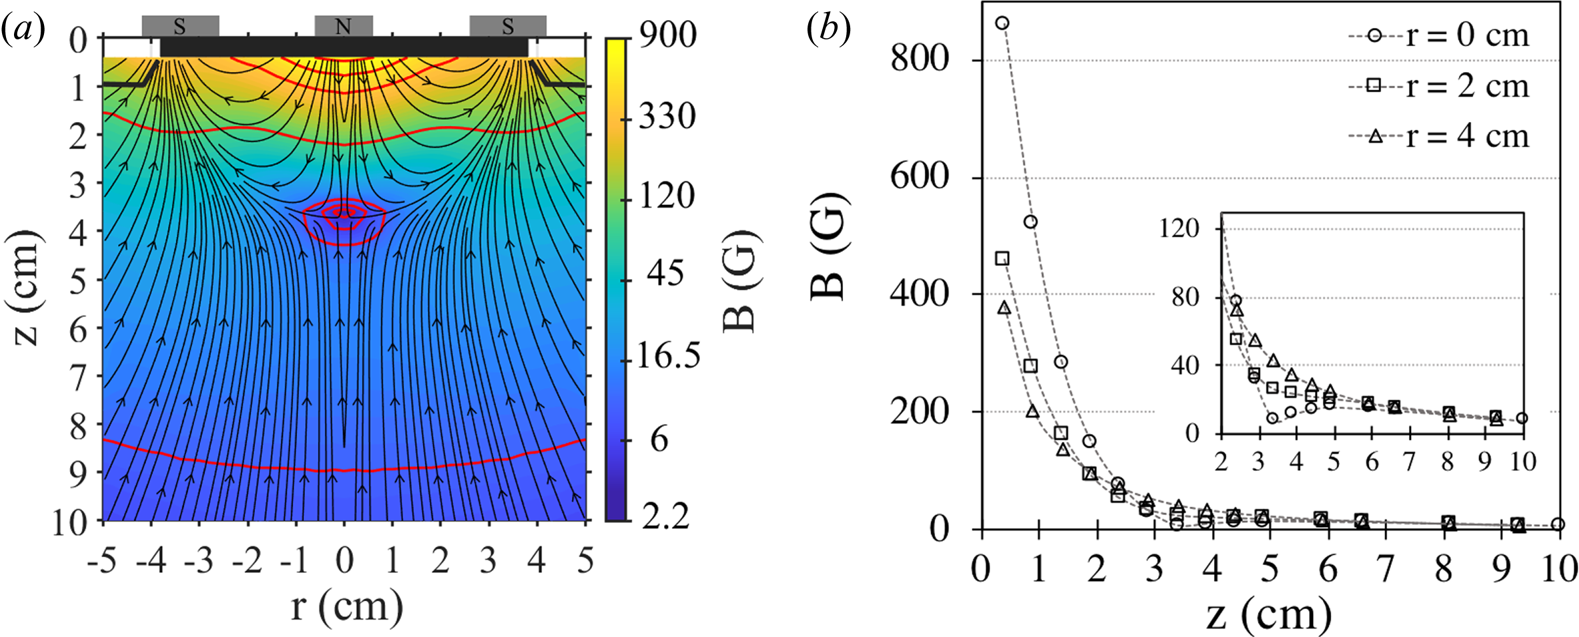
Construction of the magnetic field lines and values (B in gauss) in colour are shown in figure 2(a). The cathode is represented in black at z = 0 − 0.3 cm as well as the guard ring under each cathode side. The magnetron is unbalanced: magnetic field arches are present over a distance of z ~ 3.8 cm and a part of the magnetic field lines in the cathode centre and peripheries is directed towards the anode plate. Red lines give some contour plots of the magnetic field strength. Figure 2(b) shows the decrease of the magnetic field from the cathode, axially (for r = 0 cm) as well as under the position of the so-called ‘racetrack’ (r = 2 cm) where the sputtering is maximum (under the magnetic field lines parallel to the cathode) and under the edge of the cathode (r = 4 cm). At the cathode surface centre, B ~ 860 G. The magnetic null point is at z ~ 3.8 cm. Its position in the colour map is in the centre of the closed contour lines. The magnified view in the inset of figure 2(b) also shows this position on the plasma axis. Moreover, the inset provides the detail of B from z = 2 cm where LP measurements began to 10 cm. At z = 2 cm, the maximum of B is ~130 G. For z > 6 cm, whatever the radial position, B < 20 G and at z = 9–10 cm, B ~ 8 G.
(a) Magnetic field measurements from the cathode (z = 0.3 cm) to the grounded anode plate (z = 10 cm). Magnetic field line directions are represented by arrows; colours give the strength and some contour lines are in red. (b) Decrease of the magnetic field axially (r = 0 cm), under the racetrack (r = 2 cm) and under the cathode edge (r = 3.8 cm). Inset: magnified view from z = 2 cm where LP measurements were performed.

4. Spatial distribution of plasma parameters
Earlier studies have shown that the I–V characteristic of a cylindrical probe is not perturbed by magnetic fields if its axis is perpendicular to the magnetic field lines and if the probe radius r p is small compared to the Larmor radius r L of the charged particles. Hence, when  $\beta = {r_\textrm{p}}/{r_\textrm{L}} \ll 1$, the magnetic field influence is neglected (Kolpakova, Kudrna & Tichy Reference Kolpakova, Kudrna and Tichy2013). In our conditions, this condition was post-checked by an evaluation of r L ~ 400 μm at z = 2 cm in comparison with r p = 62.5 μm and confirmed for z > 2 cm, a region of a strong magnetic field decrease.
Assuming in a first approximation that only Ar atoms are ionized, the I–V characteristics of the LP have shown that the electron population is quasi-Maxwellian in the plasma plane, r–z. The plasma potential V p was found from the first derivative or the inflexion point of the I–V curve after subtracting the saturation ion current of the total probe current. The electron density and temperature (n e and T e, respectively) were found classically: n e from the expression of the electron saturation current of a cylindrical LP in V p, and T e by fitting the I–V characteristic curve by an exponential function from the probe floating potential to V p.
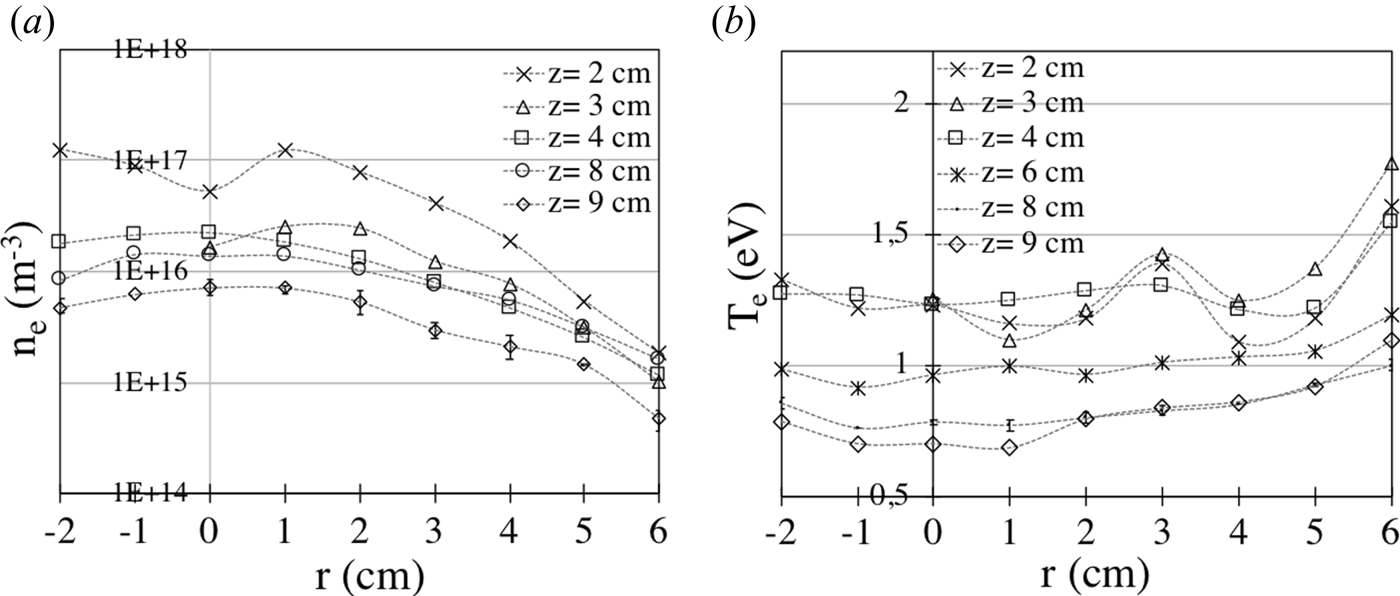
Figures 3(a) and 3(b) show n e and T e variations, respectively, from r = −2 to r = 6 cm. Measurements from r = −3 to −6 cm are not reported. They were perturbed by shadowing effects of the insulating tube part of the LP which was translated horizontally from a single lateral window of the vacuum chamber. However, measurements from r = 0 to −2 cm show that the axial symmetry of the magnetron system is fulfilled. For greater clarity, measurement error bars are only shown for data obtained for z = 9 cm of figure 3(a) and for z = 8 cm of figure 3(b). In the latter case, the data symbol was reduced to show better the error bars.
(a) Electron density and (b) temperature measurements from r = −2 to 0 cm (axial position) and r = 0 to 6 cm (half-glass tube position), for various distances z to the cathode. Symmetric measurements with respect to the discharge axis were stopped at r = −2 cm because of LP shadowing effects.

Two regions are revealed in figure 3(a). In the region located before the null point, from z = 2 to ~4 cm, the maximum of n e is inside the magnetic arches. Parameter n e decreases towards the discharge axis and to lower values towards the half-glass cylinder position. The maximum at z = 2 cm is ~1.5 × 10¹⁷ m−3. From the null point position to the anode plate, n e is maximum on the discharge axis and decreases axially and radially.
Figure 3(b) shows the distributions of T e. There is a minimum of T e when n e is maximum under the magnetic arches. A second minimum appears around r ~ 4 cm, the position of the guard ring of 1 cm in height (see figure 2a). The maximum of T e ~ 1.8 eV is reached at the plasma edge, in between the half-glass cylinders. Beyond the magnetic arches, T e progressively decreases vertically as n e does. The lower value, T e = 0.75 eV, is obtained above the anode plate at z = 9 cm.
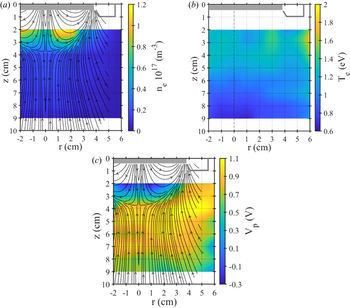
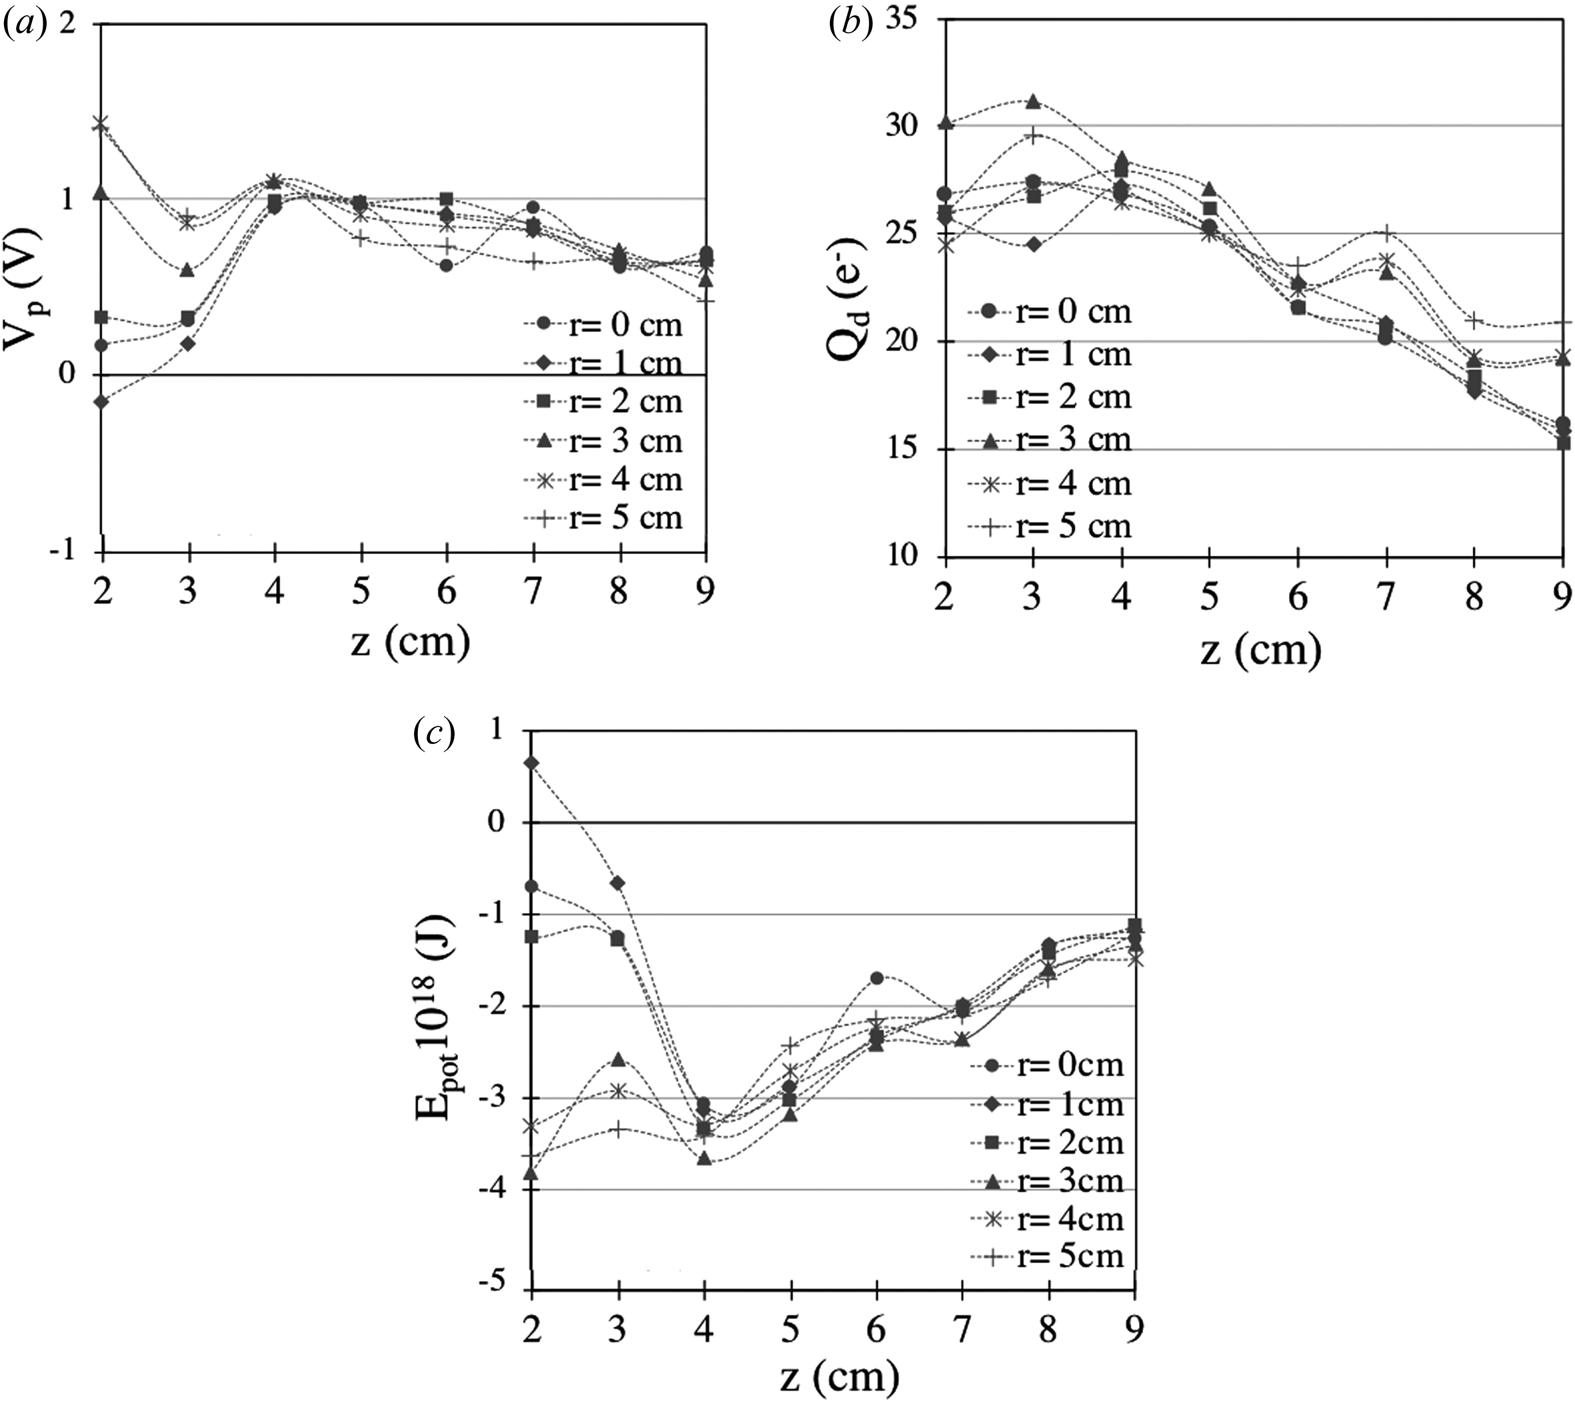
Figures 4(a)–4(c) provide, in the r–z plane, the variations in colour of ne, T e and V p, respectively. The magnetic field lines are added in figure 4(a). They highlight the correlation existing between the position of the maximum plasma density and the position of the magnetic arches. They are not added in the colour map of T e for more clarity, but it appears that in the arch regions, T e has a minimum where the density is at maximum and then increases when the density decreases. The superimposition of magnetic field lines in figure 4(c) shows that V p has negative values inside the magnetic arches, reaching −0.3 eV. A sharp increase is observed in the edge of the last magnetic arch. The largest positive values are under the guard ring and more generally in a central band, parallel to the cathode, from z ~ 4 to ~7 cm. This is also shown in figure 5(a) versus z from r = 0 to 5 cm. This spatial distribution of V p is at the origin of a potential well for NPs as presented in the next section.
Spatial distribution in colour in the r–z plane of (a) the electron density, (b) the electron temperature and (c) the plasma potential. Magnetic field lines are superimposed on the electron density and the plasma potential maps.

Variations versus the distance z for r = 0 to 5 cm of (a) the plasma potential, (b) the charge in electron units of an isolated NP of 20 nm in size and (c) the potential energy of the NP deduced from the charge and the plasma potential distributions.

5. Equilibrium position of a nanoparticle
It has been shown (Arnas et al. Reference Arnas, Chami, Couedel, Acsente, Cabie and Neisius2019) that the mean size of NPs synthesized from tungsten sputtering in magnetron discharges similar to those described above is around 20 nm after a 15 s discharge. The charging of an isolated dust particle is calculated classically using the orbital motion limited model where it is supposed that the ions and electrons have an orbital trajectory around the particle (Bernstein & Rabinowitz Reference Bernstein and Rabinowitz1959). The equality between the electron and the ion flux at the NP surface provides the NP floating potential ϕ with respect to the plasma potential, from which one can deduce the NP negative charge. In the plasma volume, the expression of the ion flux is
 \begin{equation}{I_\textrm{i}}(\phi ) = \frac{S}{4}{n_0}{\nu _\textrm{i}}\left( {1 - \frac{{2e\phi }}{{{m_\textrm{i}}v_\textrm{i}^2}}} \right),\end{equation}
where S is the NP surface, n 0 the plasma density and ν i the ion thermal velocity. The expression of the electron flux is
 \begin{equation}{I_\textrm{e}}(\phi ) = \frac{S}{4}{n_0}{\nu _\textrm{e}}\textrm{exp}\left( {\frac{{e\phi }}{{{k_\textrm{B}}{T_\textrm{e}}}}} \right),\end{equation}
were ν e is the electron thermal velocity. The negative charge is given by Q d = 4 ${\rm \pi}$ε 0r dV flot, where r d and V flot are the NP radius and floating potential, respectively. Figure 5(b) shows the variations of Q d in electron units versus z, for r = 0 to 5 cm. The maximum charge is reached in the cathode side for z = 3 to ~4 cm. Charge modulations are present along z but on average, the charge decreases from z = 4 to 9 cm.
The potential energy of an isolated dust particle in every (r, z) position is due to the contributions of the electrostatic and gravitational forces:
 \begin{equation}{E_{\textrm{tot}}} = {Q_\textrm{d}}{V_\textrm{p}} - {m_\textrm{d}}g({z_0} - z),\end{equation}
where m d is the NP mass, g the gravity intensity and z 0 = 10 cm is the distance between the electrodes. The potential energy  ${m_\textrm{d}}g({z_0} - z)$ is at least two orders of magnitude lower than Q dV p, everywhere. Figure 5(c) shows the variations of E tot. A potential well is clearly evidenced at z = 4 cm for r = 0 to 2 cm, and likely to r = 3 cm. From r = 4 to 5 cm, E tot presents modulations along z. The corresponding absolute values decrease on average from z = 2 to z = 9 cm.
6. Discussion
In the discharge axis and close to the cathode, the magnetic field has the largest values. It is directed perpendicularly to the cathode in contrast to the etch region were the magnetic field is parallel to the cathode. Hence, electrons move easily axially, being impeded from moving in a lateral direction. As a consequence, the plasma density is lower along the plasma axis and in all regions where the magnetic field lines are normal to the cathode. Moreover, when the magnetic field normal to the cathode drops, the electron gyro-radius increases and transport towards the lateral wall is also favoured, in particular from z > 4 cm. Meanwhile, electrons trapped in the high-field regions parallel to the cathode produce more ionization collisions.
Modelling at low pressure (Bogaerts, Kolev & Buyle Reference Bogaerts, Kolev, Buyle, Depla and Mahieu2008) has shown that for the discharge sustainment carried out by secondary electrons ejected from the cathode, the maximum ionization rate is located under the racetrack, in the sheath and also for a significant amount in the cathode pre-sheath. It was shown that the latter can have widths of several centimetres in magnetrons operating with strong magnetic field (Shidoji & Makabe Reference Shidoji and Makabe2003) and low pressure (Bradley et al. Reference Bradley, Thompson and Aranda Gonzalvo2001; Shidoji & Makabe Reference Shidoji and Makabe2003). In our experimental conditions, the pre-sheath extends over ~2 cm from the cathode region where V p is still negative. In the pre-sheath region to z ~ 4 cm, T e and n e are inversely proportional. This answers to a general trend in plasmas where in order to sustain the discharge, the electron temperature increases when the electron density decreases, in particular when there is diffusion towards the wall. From z > 4 cm towards the anode plate position, T e and n e decrease. Moreover, T e decreases to values ≤1 eV indicating that electron ionization can no longer take place in this region.
The cooling of T e in the presence of metallic atoms of lower ionization potential than the buffer gas has already been reported (Hopwood & Qian Reference Hopwood and Qian1995; Sigurjonsson et al. Reference Sigurjonsson, Larsson, Lundin, Helmersson and Gudmundsson2009). The W ionization energy is 7.86 eV against 15.76 eV for Ar. We assume that W ionization is performed for z < 2 cm since no W+ line has been observed for z ≥ 2 cm in emission spectra obtained in the visible range (not presented here), aiming in a direction parallel to the cathode. Therefore, the cooling of T e when z > 4 cm is attributed to W excitation collisions with electrons. In particular for z > 4 cm, the plasma light emission decreases strongly. Only W atomic lines were found in this region (no Ar lines) and the plasma emission was almost non-inexistant for z > 6 cm.
At low operating pressure, some modelling results confirmed experimentally have shown that when the plasma potential becomes positive after the pre-sheath, it progressively increases or saturates in the bulk plasma (Rossnagel & Kaufman Reference Rossnagel and Kaufman1986; Kondo & Nambu Reference Kondo and Nambu1999; Bradley et al. Reference Bradley, Thompson and Aranda Gonzalvo2001). In MS-GAS used for the production of titanium NPs at a pressure similar to ours, LP measurements have evidenced a progressive increase of V p in the direction perpendicular to the cathode (Kousal et al. Reference Kousal, Kolpakova, Shelemin, Kudrna, Tichy, Kylian, Hanus, Choukourov and Biederman2017). In our conditions, a sharp increase of V p on the edge of the last magnetic arch has been highlighted and maximum values were measured in a rather central band, parallel to the cathode. The potential energy that a negatively charged NP can have in such a plasma potential distribution shows the presence of a potential well. NPs could have a stable position in this region.
7. Conclusion
Two-dimensional spatial distributions of plasma parameters were established in unbalanced magnetron discharges using a LP. The cathode material was tungsten and argon was used at a pressure of 0.3 mbar in order to produce NPs from cathode sputtering. The magnetic field lines and strength were also established without plasma, using a Hall probe. Despite the presence of NPs of ~20 nm in size on average, correlations were established between the magnetic field geometry and strength, and the spatial distributions of the electron density and temperature. These correlations are quite similar to those established in magnetron discharges operating at low pressure for material deposition processes. Differences were found in the plasma potential variations from the cathode pre-sheath region where the potential is negative towards the anode plate region. In particular, a sharp potential increase was evidenced on the edge of the last magnetic arch and the maximum values were found in a layer parallel to the electrodes. This particular distribution is at the origin of a NP potential well which was evidenced from the potential energy that an isolated NP of negative charge can reach. Subsequent experiments will be dedicated to investigating whether NPs can have a stable position in this region using the laser extinction method and also whether they could grow there by W deposition.
Acknowledgements
This work has been carried out within the framework of the French Federation for Magnetic Fusion Studies (FR-FCM) and the Eurofusion consortium, and has received funding from the Euratom research and training programme 2014–2018 and 2019–2020 under grant agreement no. 633053. The views and opinions expressed herein do not necessarily reflect those of the European Commission.
Editor Edward Thomas thanks the referees for their advice in evaluating this article.
Declaration of interests
The authors report no conflict of interest.