INTRODUCTION
Season-to-season variability in meteorological conditions affects the main biological processes of plant growth (Dalla Marta et al. Reference Dalla Marta, Grifoni, Mancini, Storchi, Zipoli and Orlandini2010; Eitzinger et al. Reference Eitzinger, Orlandini, Stefanski and Naylor2010) and disease development, decreasing final harvest in grape (Calanca et al. Reference Calanca, Bolius, Weigel and Liniger2011; Fernández-González et al. Reference Fernández-González, Escuredo, Rodríguez-Rajo, Aira and Jato2011; Kocmánková et al. Reference Kocmánková, Trnka, Eitzinger, Dubrovský, Štěpánek, Semerádová, Balek, Skalák, Farda, Juroch and Zalud2011). One of the most important diseases of the vineyards located in north-western Spain is powdery mildew, caused by the fungus Uncinula necator (Schw.) Burr. Infection, by invasion of sprouts, leaves, inflorescences or immature berries, results in important worldwide economic losses for winegrowers, with wine production even reaching total loss in one area (Gadoury et al. Reference Gadoury, Seem, Pearson, Wilcox and Dunst2001). U. necator overwinters as sclerotia, germinating in the spring to form the asci and ascospores that are responsible for primary infection or conidia that cause the secondary spread of the disease. In areas with abundant rainfall, ascospores may constitute the main source of primary inoculum (Pearson & Gadoury Reference Pearson and Gadoury1987; Jarvis et al. Reference Jarvis, Gubler, Grove, Bélanger, Bushnell, Dik and Carver2002), while the mycelium associated with infected buds are the main source of primary inoculum in extremely dry areas (Campbell et al. Reference Campbell, Bendek and Latorre2007). Symptoms of infection include the presence of a grey-white dust on both sides of the leaf (Bendek et al. Reference Bendek, Torres, Campbell and Latorre2002) formed by conidia (which can cover the entire leaf) and diffuse dark green spots in vine shoots (with further brown tones as a consequence of development processes, or blackish when the sprout becomes lignified). Serious infections produce anomalous withering of the branches (Hidalgo Reference Hidalgo2002). Furthermore, the susceptibility of grape bunches to powdery mildew attacks depend on the phenological stage, being the most critical in the period between fruit set and ripening of berries (Gadoury et al. Reference Gadoury, Seem, Pearson, Wilcox and Dunst2001). During the beginning of stage 7, development of fruits, the fungal conidia coat the berries in a grey dust (Campbell et al. Reference Campbell, Bendek and Latorre2007). During this period, tearing of the berry skin is common, because the skin stops growing while the berry continues thickening; this sometimes favours the entry of other diseases such as grey mould. As a consequence of powdery mildew infection in grapes used for processing into wine, the final wine organoleptic qualities are altered due to reduction of the total soluble solids, colour intensity and increase in the total acidity (Amati et al. Reference Amati, Piva, Castellari and Arfelli1996; Gadoury et al. Reference Gadoury, Seem, Pearson, Wilcox and Dunst2001), whereas the yield quality and quantity of grapes used for fresh consumption are reduced. The infection risk period depends on the intensity of the powdery mildew presence in the vineyard, which is directly related to temperature and humidity (Carroll & Wilcox Reference Carroll and Wilcox2003).
The disease triangle is one of the paradigms in plant pathology (Stevens Reference Stevens, Horsfall and Dimond1960); that is, the existence of a disease caused by a biotic agent requires the interaction of a susceptible host, a virulent pathogen and an environment favourable for disease development (in the present case a vine in a phenological phase susceptible to the pathogen, the fungus U. necator and optimal meteorological conditions). The aim of the present study was the implementation of a system to predict the actual powdery mildew infection periods in order to reduce the number of chemical treatments, the most common method for reducing the impact of the fungus on crops (Russell Reference Russell2005; Walters & Fountaine Reference Walters and Fountaine2009; Day Reference Day2011), and thus to achieve a reduction in both economic costs and environmental damage. Disease is not produced if any one of the aforementioned three causal components is absent. The combination of a phenological study (to evaluate the susceptible host), the development of models to forecast the presence of the pathogen (by means of biological sensors to detect, e.g. the atmospheric spore levels of the fungus) and the prediction of environmental conditions favourable for the spread and development of the pathogen (taking into account agrometeorological models based on the air temperature of the vineyard) gives an interesting tool for adjusting the application of pesticide treatments in the vineyard.
MATERIALS AND METHODS
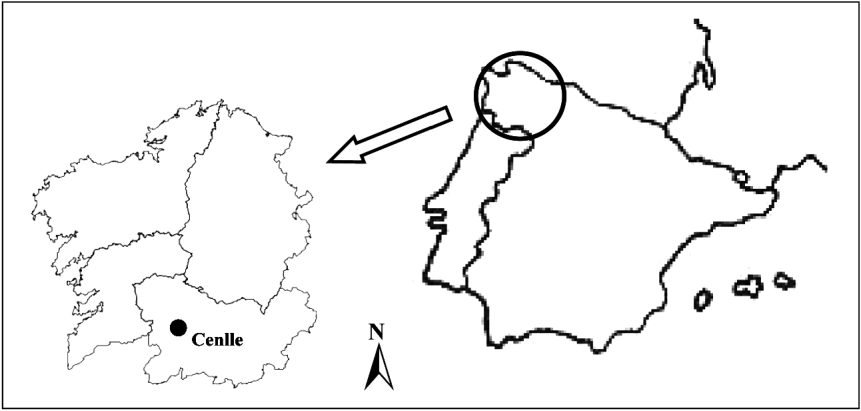
The study was conducted in a vineyard of the Ribeiro region located in north-western Spain (42°18′N, 8°6′W, 75–400 m asl) (Fig. 1). The Ribeiro Designation of Origin area covers a total of 371 km2, characterized by fairly steep valleys and hillsides. The main grape cultivars grown are Treixadura, Godello and Loureira. The particular Oceanic–Mediterranean transition ecoclimate of this region is favoured by its southern situation in Galicia and by the natural barriers that protect the territory from sub-Atlantic storms. According to the Multicriteria Climatic Classification System, most winemaking areas in this region, watered by the river Miño, would be defined as temperate and warm, sub-humid, with very cold nights (Blanco-Ward et al. Reference Blanco-Ward, Garcia Queijeiro and Jones2007).
Location of Cenlle in Galicia (Spain).

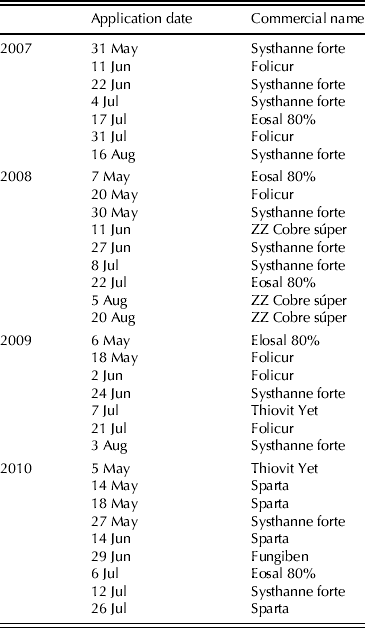
Sampling was carried out during the active Vitis season from 1 April to the harvest date (19, 23, 22 and 12 September in 2007–2010, respectively) in a grapevine 10-years-old, grown using the Ferti-irrigation system. The pruning and training system used was Cordon de royat, characterized by one horizontal branch bearing five spurs (with two eyes) along the carrier wire of the tying-up, at least 0·6 m from the ground. Soil management consisted only of maintenance of the vegetal cover, without ploughing. In order to avoid U. necator attacks, the following commercial products were applied using preset calendars: Folicur, Thiovit Yet, Systhanne forte, Eosal 80%, Fungiben, ZZ Cobre súper and Sparta (Table 1).
Phytosanitary treatments applied to U. necator during each of the study years
Aerobiological sampling was performed during the Vitis vegetative period from 2006 to 2011 using a LANZONI VPPS-2000 volumetric trap located in the central part of the vineyard. The sampler was placed 2 m above ground level, so that spore trapping would not be impeded by vine growth. The trapping system worked continuously for 1 week, with an intake of 10 litres of air/min which allowed calculation of the daily U. necator spore concentrations in 1 m3 of air of the vineyard. Melinex tape coated with a 2% silicone solution was used at the spore-trapping surface. The exposed tape was cut into seven pieces, which were mounted on separate glass slides. U. necator conidia were counted following the model proposed by the Spanish Aerobiological Network (R.E.A.), based on two longitudinal transects along the slides (Galán et al. Reference Galán Soldevilla, Cariñanos González, Alcázar Teno and Domínguez Vilches2007). The sampling was interrupted for power cuts on 10–15 September in 2007; 12–14 April in 2008; 19–20 August and 5–8 September in 2009 and finally 1–6 April, 29 April–11 May and 27–30 August in 2010. The U. necator conidia concentrations were expressed as total spores or spores/m3 of air when referring to daily mean values.
The phenological study was conducted following the phenological scale recommended by Lorenz et al. (Reference Lorenz, Eichhorn, Bleiholder, Klose, Meier and Weber1994), adopted by the BBCH as the standardized scale for phenological grapevine observations (Meier Reference Meier2001). A total of 15 phenological phases were monitored, belonging to five principal stages: stage 1 (leaf development), stage 5 (inflorescence emergence), stage 6 (flowering), stage 7 (development of fruits) and stage 8 (ripening of berries). The phenological study was carried out on 20 selected vines of cvar Godello. The sampling area was visited weekly during the 6 years of study (2006–11), except during the flowering stage when visits increased to twice a week. The visits consisted of checking the phenological stage, and collection of the aerobiological sample data (for subsequent spore counting in the laboratory) and weather sampling data. The start date of each phenological stage was taken as the date when half of the studied vines had reached that stage.
In order to ascertain the possible disease infection periods, the infection risk index (IRI), as proposed by Jarvis et al. (Reference Jarvis, Gubler, Grove, Bélanger, Bushnell, Dik and Carver2002) and based on the maximum temperature registered, was calculated. The IRI values ranged from 0 (no risk of infection) to 100 (very high risk of infection). According to the IRI, the high-risk periods began at 30 points, which corresponded to 3 consecutive days experiencing maximum temperatures of 20–30 °C for at least 6 consecutive hours. Later, 20 points were summed or 10 points were subtracted for each day on which this thermal requirement was attained or not, respectively. Also, 10 points were discounted per day if maximum temperature reached 30–35 °C for 60 min or if maximum temperature was higher than 35 °C for 15 min. The IRI returned to 0 after 3 consecutive days without meeting the aforementioned thermal requirements (Jarvis et al. Reference Jarvis, Gubler, Grove, Bélanger, Bushnell, Dik and Carver2002).
Data on the maximum, average and minimum temperatures, and the dew point were obtained from a Hobo Micro Station data logger located in the vineyard. Rainfall was recorded using a Davids weather station, also located in the vineyard. Hourly data were used to calculate the IRI, while daily data were used for the other analyses.
In order to ascertain the influence of major daily weather-related parameters on daily mean airborne U. necator spore counts, a Spearman linear correlation analysis (r) was applied, taking into account the U. necator spore counts and weather parameters for the same day and the 7 preceding days as dependent variables. Significance was calculated for P ⩽ 0·01 and P ⩽ 0·05. Finally, based on the results obtained by the correlation analysis, multi-linear regression equations were drawn up in order to construct a model to predict the conidia concentration in the atmosphere of the vineyard. Meteorological, phenological and phytopathological variables displaying elevated significance levels and positive correlation coefficients were included as model estimators. In all statistical analyses, the SPSS 19.0 software package was used. The model was trained with data from 2007 to 2010, while harvest data from 2006 and 2011 (which were not included for the development of the models) were used to prove the accuracy of the proposed equations. Moreover, a t test for dependent samples was carried out in order to check whether significant statistical variations existed between the estimated and the real data.
RESULTS
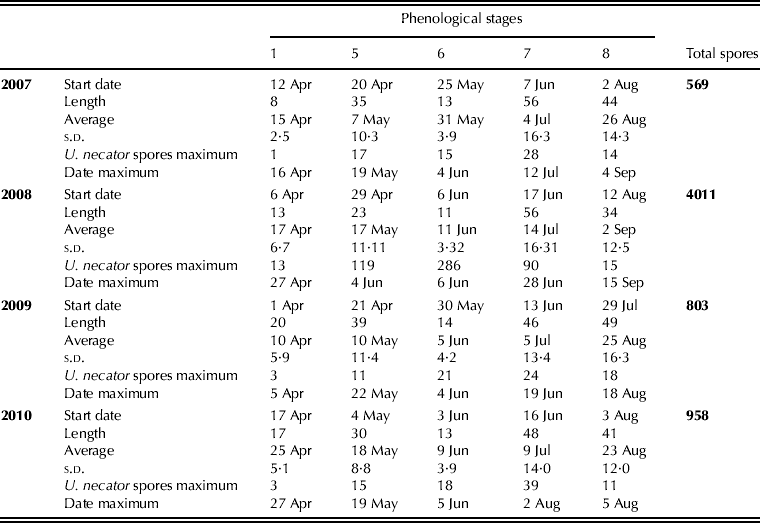
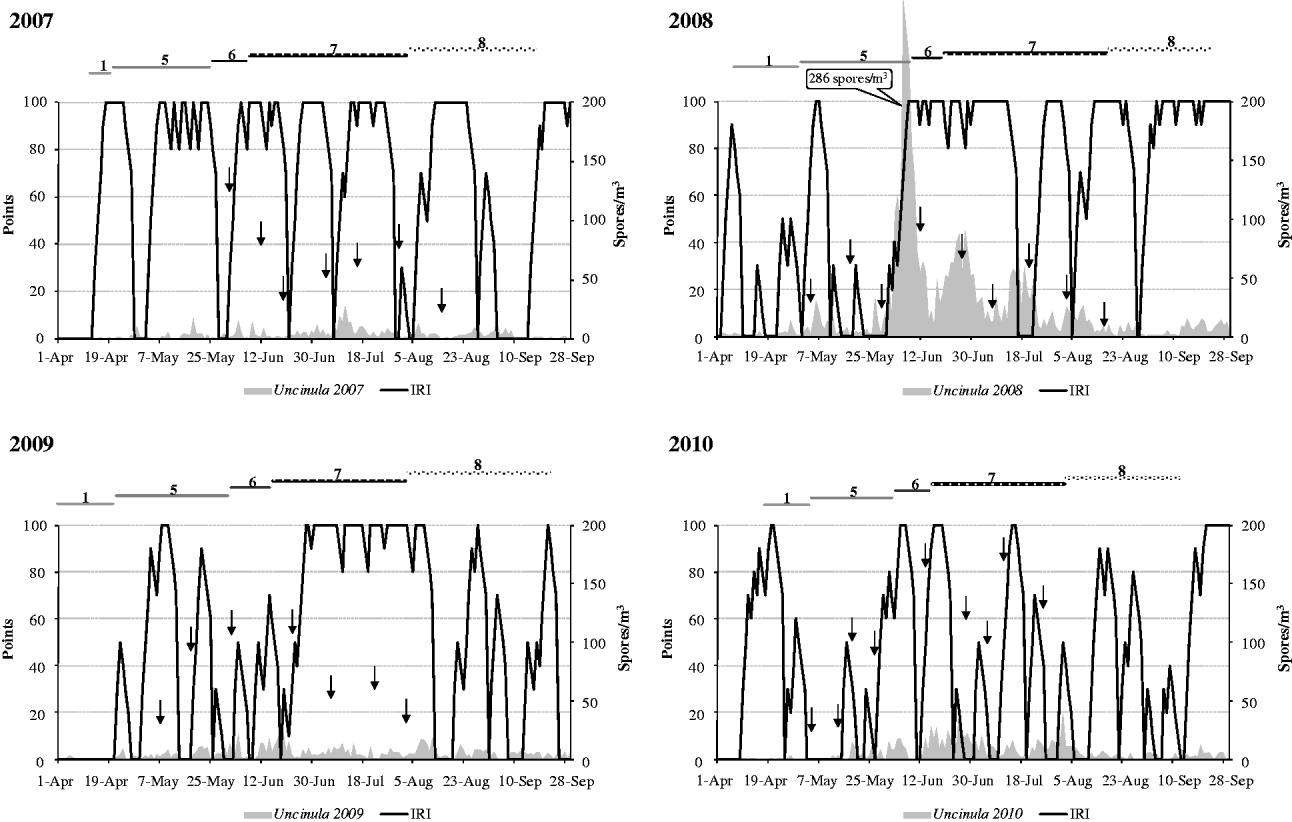
The highest total U. necator spore concentrations were recorded in 2008 (4011 spores) and the lowest in 2007 (569 spores). Intermediate values were registered during the other harvests studied (Table 2). The presence of airborne U. necator spores was not constant during the grapevine cycle, being recorded on 0·77–0·93 of sampling days. In general terms, high spore counts were observed from the first fortnight of June to the first days of August (Fig. 2).
U. necator total spores (spores) and maximum concentration (spores/m3) together with start date of the different phenological stages and length of each stage (days) in each study year
U. necator concentrations (spores/m3), IRI (points), principal phenological stages, stage 1 (leaf development), stage 5 (inflorescence emergence), stage 6 (flowering), stage 7 (development of fruits) and stage 8 (ripening of berries). Chemical treatments applied are marked by arrows.
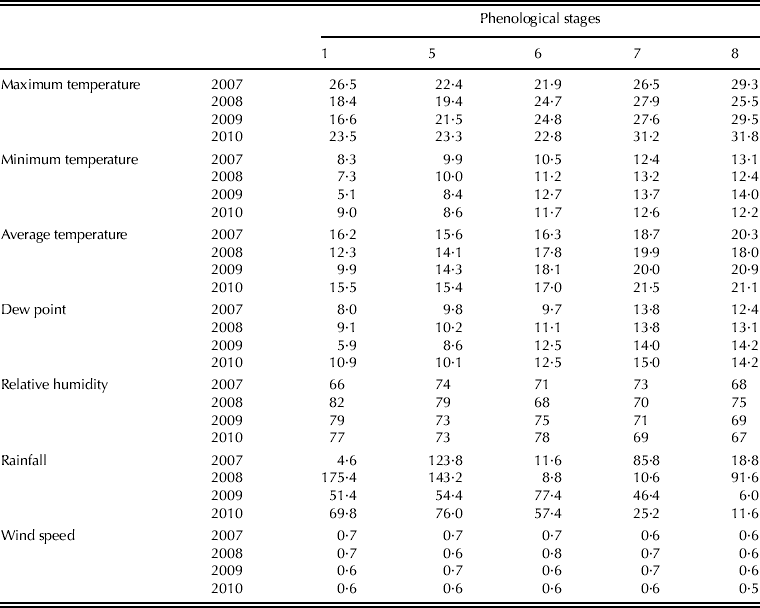
There was little variation in the duration of the cvar Godello cycle, calculated from the beginning of stage 1 to stage 8 (phase 89: harvest maturity), ranging from 165 days in 2010 to 176 days in 2008. Nevertheless, considerable year-to-year differences were noted in the duration of individual phenological stages (Table 2). The most important variations were observed for stages 1 and 8. Generally, the longest-lasting stage for the study as a whole was stage 7 with a mean duration of 51 days, followed by stage 8 (mean: 42 days) and stage 5 (mean: 32 days). The shortest stages were stage 6 (mean: 10 days) and stage 1 (mean: 15 days). The highest daily U. necator spore concentrations were recorded during stage 6 in 2008 (286 spores per m3) and stage 7 in 2007, 2009 and 2010 (28, 24 and 39 spores/m3, respectively) (Table 2). The highest concentration of spores during stage in 2008 coincided with the minimum rainfall during the study years at this stage, as well as mild average temperatures of c. 17·8 °C (Table 3). Likewise high maximum temperatures were registered during stage 7 in the rest of the studied years.
Meteorological variables (maximum, minimum and average temperature (°C), dew point (°C), relative humidity (%), rainfall (mm) and wind speed (m/s)) during the phenological stages in the study period
IRI for each studied year was calculated according to the hourly maximum temperatures. In 2007, the IRI began to increase from the end of stage 1, achieving the highest risk of infection during stages 5, 6 and 7. However, high risk of infection only coincided with the highest concentration of U. necator spores during stage 7. During the 2008 harvest, the IRI rate began to increase from the end of May, reaching the highest risk of infection during stages 6, 7 and 8. The highest concentration of U. necator spores coincided with periods of high risk of infection only during stage 6. In 2009, the concentration of spores started to increase from the first days of May, matching punctual increases in IRI. The majority of risk infection periods were observed during stage 7. Finally, during the 2010 harvest the IRI began to rise earlier, from stage 1. The main risk of infection periods were recorded during specific periods of stages 6 and 7, coinciding with the highest presence of U. necator spores in the atmosphere of the vineyard (Fig. 2). Correlation linear analysis showed a significant (P < 0·01) positive relationship between the IRI and U. necator spore levels.
The Spearman correlation test, considering the full dataset (2007–10), showed positive correlations (P ⩽ 0·01) with the concentration of U. necator spores during the 1–7 days before, maximum, minimum and mean temperatures and the dew point of the same day and the previous 7 days. Negative correlations (P ⩽ 0·01) were seen with the relative humidity of the same day and the 3 previous days, and the rainfall of the same day and 1–6 previous days. Finally, a lower negative correlation (P ⩽ 0·05) was obtained with relative humidity of the previous 4 days and rainfall of the previous 7 days.
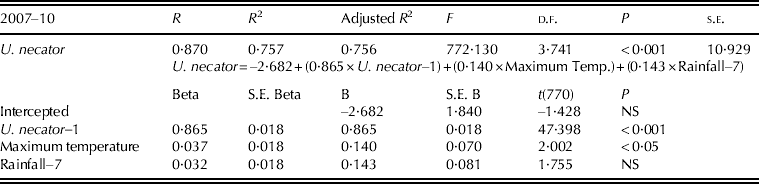
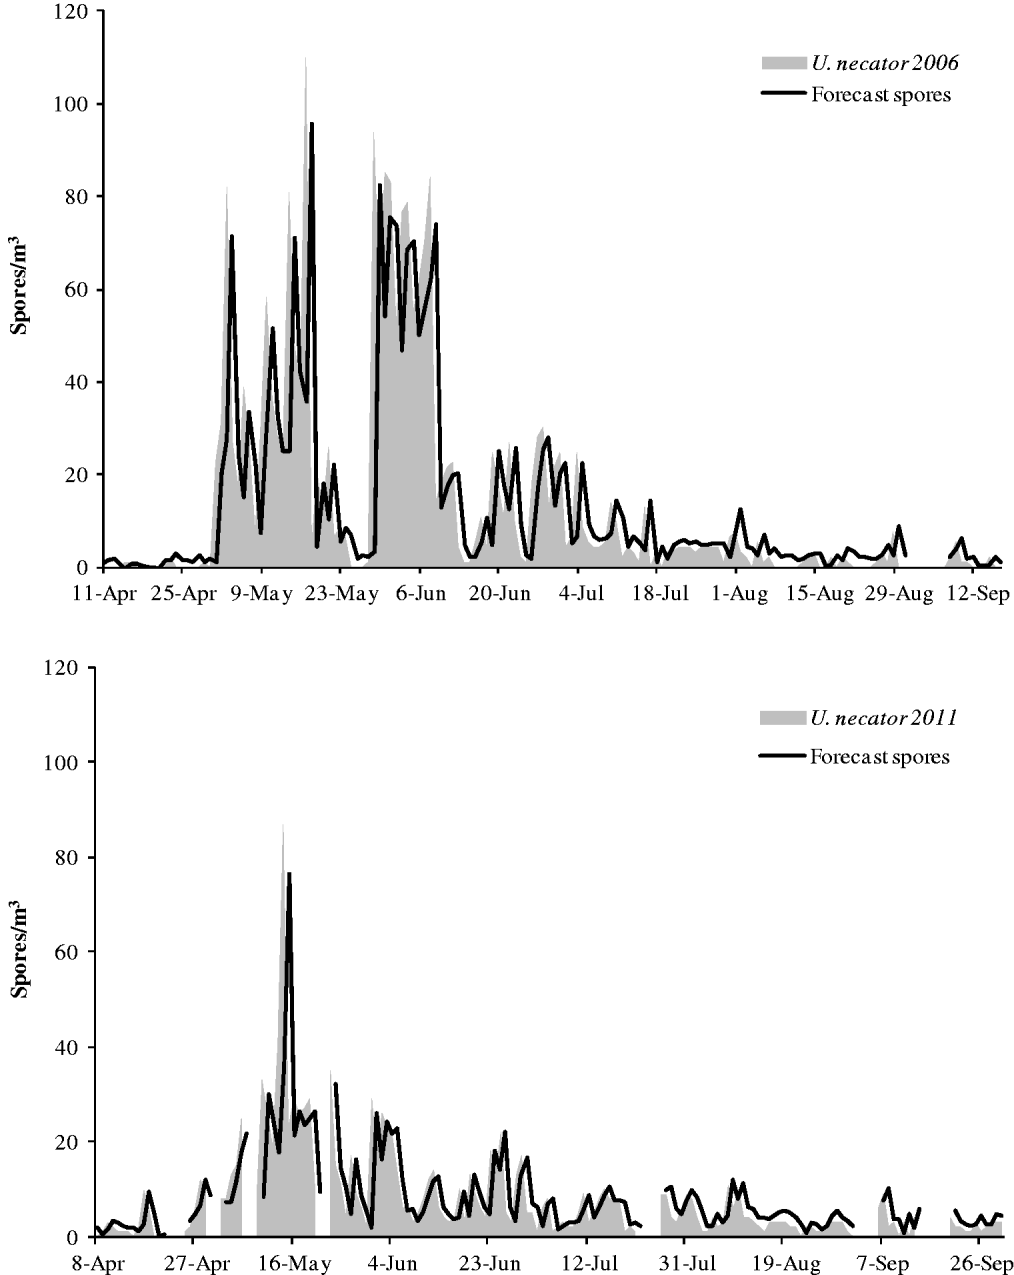
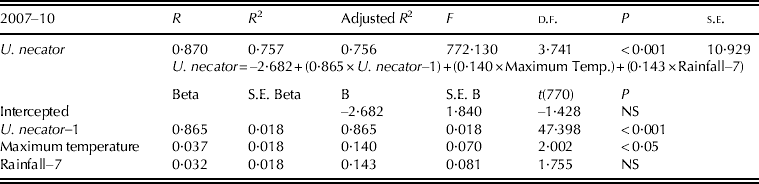
The best estimators of U. necator spore concentration were the phytopathogen fungus level during the previous day, the maximum temperature of the same day and the total rainfall registered 7 days in advance. The regression equation obtained shows an F value of 772·130 (d.f. = 3·741, P < 0·001) accounting for 76% of variation in spore concentration (Table 4). The prediction capacity of the regression model was therefore evaluated by means of the comparison of the observed U. necator spore concentration v. the predicted spore counts of the 2006 and 2011 harvest, years which were not used to construct the aforementioned model (Fig. 3). The predicted values matched actual spore counts in most cases. The precision of the model was statistically verified by t test analysis; the results indicated no significant differences between estimated and actual daily U. necator spore values (Table 5).
Forecast model of U. necator spore concentrations
T-test for the real concentration U. necator values (2006 and 2011) and estimated concentration values

Levels of U. necator spores observed and estimated in the years 2006 and 2011.
DISCUSSION
Powdery mildew is a polycyclic fungal disease having a major economic impact on the wine industry; even low infection levels, c. 0·03 of bunches, adversely affect the flavour of the wine (Albelda Reference Albelda2008). Powdery mildew fungus can overwinter as cleistothecia, which are often considered the main source of primary inoculum (Gadoury & Pearson Reference Gadoury and Pearson1988; Cortesi et al. Reference Cortesi, Bisiach, Ricciolini and Gadoury1997; Rügner et al. Reference Rügner, Rumbolz, Huber, Bleyer, Gisi, Kassemeyer and Guggenheim2002; Grove Reference Grove2004). Mycelia preserved inside the bud are thought to give rise to so-called flag shoots in spring (Rügner et al. Reference Rügner, Rumbolz, Huber, Bleyer, Gisi, Kassemeyer and Guggenheim2002). During the spring U. necator germinates forming asci and ascospores, responsible for primary infection, or conidia that cause the secondary spread of the disease. The synchronization between ascospore dispersal and grapevine phenology has been noted by several authors in different bioclimatic areas (Magarey et al. Reference Magarey, Gadoury, Emmett, Biggins, Clarke, Wachtel, Wicks and Seem1995; Cortesi et al. Reference Cortesi, Bisiach, Ricciolini and Gadoury1997). Campbell et al. (Reference Campbell, Bendek and Latorre2007) stated that the most critical infection period occurs from the onset of flowering to the period in which the berries reach a diameter of 7 mm, as occurred during most years of the present study. However, Jailloux et al. (Reference Jailloux, Willocquet, Chapuis and Froidefond1999) indicated that the dispersal of ascospores that originated from the overwintering cleistothecia took place early, between stages 0 (sprouting) and 6 (flowering).
The highest spore concentrations are mainly influenced by weather conditions. The meteorological conditions registered during the periods in which the highest concentrations of U. necator were recorded in the present study generally corresponded with the optimal values for the fungus development and the disease progression. Gadoury & Pearson (Reference Gadoury and Pearson1990) indicated that precipitation of c. 2·5 mm followed by a wet period of at least 4 h at temperatures of 6–24 °C facilitate ascospore dispersal, because rainfall and humidity are considered to be important for moistening the cleistothecia, which favours their dehiscence (Jailloux et al. Reference Jailloux, Thind and Clerjeau1998). Relative humidity values of 53–97% are optimum for infection, while the progress of the disease is stopped below 47% or close to 100% (Jarvis et al. Reference Jarvis, Gubler, Grove, Bélanger, Bushnell, Dik and Carver2002). These data are similar to those obtained in the present study, since relative humidity values ranged from 70 to 79% in stage 5, 47 to 71% during stage 6 and 63 to 73% during stage 7. The temperature also plays a role in ascospore dispersal; temperatures of c. 25 °C are considered optimal for this process while values below 8 °C reduce the amount of the U. necator spores (Gadoury & Pearson Reference Gadoury and Pearson1990; Moritz et al. Reference Moritz, Zinkernagel, Kassemeyer and Hill1994; Jailloux et al. Reference Jailloux, Thind and Clerjeau1998). During 2008, the daily peak value was registered in stage 6 (reaching a concentration of 286 spores per m3) when optimal temperature and rainfall conditions for the U. necator infection were produced: daily average temperatures of 18 °C and rainfall of 8·8 mm. Finally in 2007, 2009 and 2010 the maximum daily spore peak was delayed to the first half of stage 7 when rainfall occurred during 3–4 consecutive days followed by rainless periods of 6–7 days with temperatures of 19–22 °C. The lower concentrations registered during stage 8 in 2007 were the consequence of atmospheric washes produced by the abundant rainfall during stage 7, with a total of 85·8 mm. Spore concentrations were significantly reduced in stage 8 in all years of the present study. Some authors have pointed out an ontogenic resistance developed by small berries against mildew infection growth as the berries ripen (Ficke et al. Reference Ficke, Gadoury, Seem and Dry2003). Subsequently, the infection susceptibility varies with the phenology timing. The vine is very vulnerable to infection during the early stages of berry development, mainly between fruit set and veraison (Gadoury et al. Reference Gadoury, Seem, Pearson, Wilcox and Dunst2001).
Besides the meteorological variables, other factors can affect the degree of U. necator infection. Age and spatial distribution of leaves in the vine affect development of the pathogen; shaded or sheltered areas favour the development of powdery mildew while high temperatures and solar radiation inhibit the progress of the infection (Calonnec et al. Reference Calonnec, Cartolaro, Naulin, Bailey and Langlais2008).
The importance of temperature in the progress of the disease has led some authors to develop IRI based on the evolution of this parameter (Gubler et al. Reference Gubler, Rademacher and Vasquez1999; Jarvis et al. Reference Jarvis, Gubler, Grove, Bélanger, Bushnell, Dik and Carver2002; Chauhan et al. Reference Chauhan, Wright, Rachaputi, Holzworth, Broome, Krosch and Robertson2010). According to the maximum and moderately favourable conditions for powdery mildew disease development, Campbell et al. (Reference Campbell, Bendek and Latorre2007) described a moderate IRI during the sprouting stage (stage 0). Some authors consider the buds to be an important source of inoculum for the development of powdery mildew epidemics, particularly in areas where the pathogen survives as mycelium on infected buds (Ypema & Gubler Reference Ypema and Gubler2000; Halleen & Holz Reference Halleen and Holz2001; Cortesi et al. Reference Cortesi, Ottaviani and Milgroom2004; Rumbolz & Gubler Reference Rumbolz and Gubler2005). During 2008 in the present study, high levels of IRI of c. 90 points were recorded before stage 1. Therefore, it is possible that the primary inoculum could have grown initially in the buds, during the period before that in which the symptoms were observed in the vineyard, causing further development of the disease and a greater amount of spores for secondary infections. During stage 6 the IRI ranged from moderate (30–60) to high levels (60–100), mainly at full flowering. Over the final phenological stages, stages 7 and 8, the average temperature conditions (18–23 °C) were favourable for disease development, which induced high IRI levels. Similar results were noted in studies conducted by Campbell et al. (Reference Campbell, Bendek and Latorre2007) in which high IRI values were obtained under temperatures c. 20 °C during stages 6 and 7.
Aerobiological studies allow calculation of the daily and hourly airborne spore concentrations present in the crop (Fernández-González et al. Reference Fernández-González, Rodríguez-Rajo, Jato and Aira2009; Rodríguez-Rajo et al. Reference Rodríguez-Rajo, Jato, Fernández-González and Aira2010). The Spearman correlation analysis results between the meteorological parameters and the U. necator spores concentrations reinforce the importance of temperature on powdery mildew infections. The spore concentration could be used as a biological sensor of pathogen development and it could be useful when the infection level is firstly determined by inoculum (Jeger Reference Jeger1984). A significant correlation between aerial conidia concentration at a given date and lesion density 1 week later than most sampling dates was achieved for Botrytis leaf blight (Carise et al. Reference Carise, Savary and Willocquet2008), especially when both disease intensity and airborne conidia concentration were high. Therefore, the high accuracy obtained for the regression equation model proposed in the present study for predicting U. necator spore concentrations could make possible an 8-day horizon of infection in the vine.
The aerobiological monitoring of airborne inoculums integrated with the use of the meteorological IRI and phenological data provides a valuable tool for establishing the basis for an accurate, modern, integrated pest-management strategy. The application of chemical treatments should be conducted only when all three causal components of the disease triangle are present, since disease is not produced if any one of these is absent. This would lead to a lower number of treatments, and thus to a reduction in both economic costs and environmental damage. This methodology is very economical for winegrowers, simple to implement and use in the vineyard (Bendeck et al. Reference Bendek, Campbell, Torres, Donoso and Latorre2007; Rodríguez-Rajo et al. Reference Rodríguez-Rajo, Jato, Fernández-González and Aira2010).
The results of the present study show that the critical periods for powdery mildew infection are stages 5, 6 and 7, as a consequence of the high susceptibility of the vine at these times. The IRI allows the moments in which the meteorological conditions could facilitate the fungus attacks during the aforementioned phenological phases to be ascertained. Finally, the aerobiological model allows identification and prediction of the times of real infection risk among the possible periods described by the IRI, in order to avoid the possible appearance of infection symptoms in the vine one week later. The combination of these three variables provides a valuable tool to establish an accurate, modern, integrated pest-management strategy in a vineyard. This information about risk infection alerts could be transferred to winegrowers, official regulatory organisms and the wine industry by means of web sites, sms or emails.