



1. Introduction
Combustion of a spinning fuel disk in a quiescent microgravity environment provides an ideal geometrical configuration for investigating the influences of stretch on diffusion flames (Holcomb & Tíen Reference Holcomb and Tíen1997; Nayagam & Williams Reference Nayagam and Williams2000a,Reference Nayagam and Williamsb). Theoretically the problem becomes one-dimensional in the von Kármán similarity coordinates, and experimentally the stretch rates are precisely controllable by changing the rotational speed of the fuel disk. Previously the combustion of polymethylmethacrylate (PMMA) disks in air embedded in a von Kármán swirling flow generated by a spinning fuel disk has been investigated experimentally (King, Nayagam & Williams Reference King, Nayagam and Williams2000) and theoretically (Nayagam, Balasubramaniam & Williams Reference Nayagam, Balasubramaniam and Williams2009; Nayagam & Williams Reference Nayagam and Williams2011), with fuel burning rates and flame stand-off distances measured as functions of the fuel-disk rotational speed. In this configuration, after steady-state conditions are reached, there is a thin liquid layer at the surface of the solid polymer in which the liquid flows radially outward, and an upward portion of this flowing molten PMMA is ejected along the periphery by the action of centrifugal force. At the end of an experimental run, ‘cobweb-like’ fine solidified PMMA strands were found surrounding the experimental apparatus. A close examination revealed that the strands originated from a contact-line instability along the periphery of the fuel disk where the molten layer encounters a non-burning solid substrate. The objective of this paper is to provide quantitative information on the characteristics of this contact-line instability observed during the combustion of this thermoplastic material. Understanding of these processes may be of importance in low-gravity spacecraft fire safety (Yang, Hamins & Donnelly Reference Yang, Hamins and Donnelly2000; Huang & Nakamura Reference Huang and Nakamura2020), as well as in polymer spin-coating applications (Lawrence Reference Lawrence1988). The prevalent use of thermoplastic materials in spacecraft motivates acquiring improved knowledge of their behaviours in elevated-temperature and combustion scenarios for establishing better crew safety protocols.
The physical processes involved in the development of contact-line instabilities have been studied extensively in the fluid-mechanics literature (Huppert Reference Huppert1982; Troian et al. Reference Troian, Herbolzheimer, Safran and Joanny1989; Jerrett & de Bruyn Reference Jerrett and de Bruyn1992; Brenner Reference Brenner1993; Fraysse & Homsy Reference Fraysse and Homsy1994; Spaid & Homsy Reference Spaid and Homsy1996; Moyle, Chen & Homsy Reference Moyle, Chen and Homsy1999). A driven contact line of a liquid spreading over a solid substrate becomes unstable to spanwise perturbations and develops a fingering pattern in the direction of the main flow, with a characteristic wavelength in the cross-flow direction. The driver can be a body force, such as gravity or centrifugal force, or surface shear stresses caused by surface-tension gradients or by gas flow over the liquid film. Experimentally (Huppert Reference Huppert1982; Silvi & Dussan Reference Silvi and Dussan1985; Jerrett & de Bruyn Reference Jerrett and de Bruyn1992) two types of flow patterns are observed to develop from this instability, as illustrated in figure 1: a saw-tooth pattern and a long straight rivulet pattern, both periodic in the cross-stream direction. In the rivulet instability the tip was found to move in the direction of the driving force, while the troughs were stationary. On the other hand in the saw-tooth pattern both the tip and the bottom trough move in the flow direction. The reason for this difference is believed to be the variations in the contact angle of the liquid with the substrate (Silvi & Dussan Reference Silvi and Dussan1985; Jerrett & de Bruyn Reference Jerrett and de Bruyn1992). Moyle et al. (Reference Moyle, Chen and Homsy1999) show that when the contact angle of the liquid with the substrate is small, propagating saw-tooth patterns are formed, and straight-edged patterns occur for larger contact angles.
Sketch of the two types of instabilities patterns observed (Silvi & Dussan Reference Silvi and Dussan1985): (a) straight-edged rivulet and (b) saw-tooth pattern.

The wavelength of the instability, irrespective of which pattern evolves during the nonlinear growth process, has been predicted by linear stability analysis in the work of Troian et al. (Reference Troian, Herbolzheimer, Safran and Joanny1989). They showed that, for small perturbations in the spanwise direction, the capillary ridge that forms along the contact line is unstable for certain wavelengths. The most dangerous wavelength  $\lambda$, the wavelength for which the growth rate is the fastest, being given by
 $\lambda =14\ell$, where the length scale
 $\ell$ is defined as
 $H(3Ca)^{-1/3}$, in which
 $H$ is the height of the liquid film at the inner edge of the capillary ridge, and the capillary number is
 $Ca=\mu U/ \sigma$, with
 $\mu$ the viscosity,
 $\sigma$ the surface tension and
 $U$ the height-averaged radial velocity at the contact line. Their results were shown to agree reasonably well with the experimental measurements of Huppert (Reference Huppert1982). Homsy and coworkers have further clarified the physical mechanisms of fingering instability by performing spin-coating experiments with Newtonian and non-Newtonian fluids (Fraysse & Homsy Reference Fraysse and Homsy1994), considering energy balances in the linear stability theory (Spaid & Homsy Reference Spaid and Homsy1996). They showed that, when the advancing capillary ridge is perturbed, the body forces propel the thicker regions faster than the thinner regions, thus providing a positive feedback for the formation of fingering patterns. They also showed that the most dangerous wavelength is relatively insensitive to the details of the contact-line model used in the stability analysis. A similar description of the instability mechanism is provided by Brenner (Reference Brenner1993), based on scaling arguments. Although these studies considered the spreading of liquids deposited on a solid substrate from an external source, a similar phenomenon can be expected to occur in the melt layers of burning solid thermoplastics.
Earlier studies of melt-layer flows were aimed at understanding the aerodynamic melting associated with ablation of protecting shields on re-entry vehicles, or determining potential origins of meteorites from their external markings (see e.g. Feldman Reference Feldman1959; Penner Reference Penner2012). Fingering instabilities, addressed herein, were not observed in those studies. The present work shows that melt layers formed on the surface of a burning polymer subjected to body forces in fact undergo fingering instabilities, and the process by which that occurs can be described well by the earlier predictions available in the literature cited above. First the experimental apparatus and the experimental procedure will be described, then the experimental observations will be presented, followed by an approximate analysis that provides a method to estimate the capillary number needed for correlating the experimental results.
2. Experimental set-up and procedure
Figure 2 shows a schematic illustration of the experimental apparatus. A horizontally mounted cast PMMA disk, of thickness 0.5 in. (12.7 mm) and diameter 7.5 in. (190.5 mm), attached to an aluminium back-plate, was spun using a stepper motor and a belt-and-pulley drive mechanism. All the fuel disks used in this study were cast PMMA, from the same manufacturer and were cut from one single sheet. The stepper-motor controller was operated from a personal computer and can be commanded to run the motor continually at rotational speeds between 0 and 40 r.p.s. (revolutions per second). The accuracy of the motor-drive in maintaining a specified speed was checked using a strobe light and found to be within  $\pm 2\,\%$ over the range of rotational speeds employed in this study. The area of the exposed face of the PMMA disk can be varied by covering it with a 1/16-inch-thick (1.5875 mm) aluminium plate with different diameter holes in the centre (see figure 2). Some experiments were also carried out with no cover plate, in which case only a small ring held the fuel disk to the bottom plate. The entire experimental assembly was enclosed in a transparent chamber to shield the experiment from drafts in the laboratory.
Schematic diagram of the experimental apparatus.

At the beginning of an experiment the fuel disk was levelled horizontally, and a cover plate with the desired hole size was inserted. The stepper motor was then energized to run at a preselected rotational speed. Once the specified speed was reached (usually within a minute) the steadiness and accuracy of the disk speed was checked with a strobe light. The strobe light also freezes the rotation of the fuel disk and permits direct visual observations of the melt flow during an experiment. Ignition was achieved by applying a butane torch over the exposed polymer face so that the entire exposed face of the disk was heated uniformly. Once a self-sustaining flame was established over the entire fuel surface, the torch was removed and the fuel disk was allowed to burn freely. A thin melt layer forms at the surface and under the action of the centrifugal force flows radially outward. At the edge of the exposed disk the aluminium cover plate pins the contact line at a fixed location forming a capillary ridge along the periphery. Depending upon the experimental conditions, the capillary ridge subsequently undergoes fingering instability and forms fingering patterns on the aluminium cover plate. At low rotational speeds orange-coloured sooting flames exist, and therefore additional lighting was used to observe the flow patterns. Once the fingering pattern was visually observed, the flame was quickly quenched by a blast of air from a compressed-air bottle. The fuel disk along with the cover plate was then removed and scanned electronically, and the images were stored as TIFF (tagged image file format) files for subsequent analysis. When there was no cover plate, the fingering patterns were formed along the outer edges of the PMMA disk, where burning was less vigorous as a result of the heat loss to the edges so the patterns sometimes could still be observed and measured. All of the experimental results reported here were conducted in air and at normal laboratory atmospheric pressure.
3. Experimental observations
A total of 18 different experiments were conducted (see table 1) with the exposed fuel-disk diameter varying between 2 and 6 in. (50.8 and 152.4 mm) and the disk rotational speed between 8 and 30 r.p.s. Typically, following ignition the time it takes for the finger pattern to appear varied with the rotational speed. At lower speeds it took longer ( $\approx 5$ min) while at higher speeds the patterns appeared within a minute. A precise timing of the onset of the instability is difficult due to the unpredictability of the ignition process as well as the inability to observe the melt front during combustion. It was also complicated by soot which deposited on the cover plate (likely due to thermophoretic forces) forming a black layer making it difficult to the see the flow patterns.
Summary of experimental results.

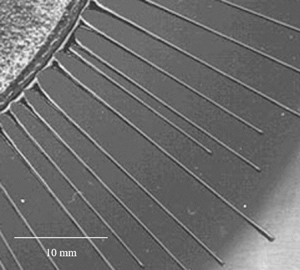
Figures 3–5 show typical fingering flow patterns observed during these experiments. As seen in figure 3 the wavelength between the fingers is not quite uniform and varies slightly over the entire perimeter. This variation may result from variations of the contact angle, which affects the wavelength according to the literature, but that could not be tested experimentally because the contact angle could not be measured. The variation also is seen in the exploded view of the same image shown in figure 4. It may be seen there that the rivulets are shorter when the spacing is closer together, which is maybe due to less material being available to form each rivulet at closer spacing. Our material is less ideal than materials employed in earlier studies and so may be more prone to circumferential variations, preventing comparisons with previous measurements. The rivulets are extremely straight and narrow with a rounded tip. The bottom trough is pinned at the inner edge of the cover plate and does not propagate while the rivulet tips lengthen with time. Eventually these rivulets leave the cover plate and emerge as the cobweb-like threads surrounding the experimental apparatus.
Fingering instability overview.

Fingering instability close-up of high-rotation-rate straight-edged rivulets.

Fingering instability close-up of a low-rotation-rate pattern approaching a saw-tooth.

Figure 5 shows a slightly different form of pattern than the one shown in figure 4. In this figure the bottom trough part of the pattern has a distinctive triangular shape with a straight-edged rivulet tip. Unlike the isothermal liquid/solid experiments, here the physical properties and the contact angle of the polymer melt vary continually along the radius due to variations in the substrate temperature. In figure 5 the straight-edged rivulets are formed at an earlier stage and as the substrate temperature increases with time the trough shape changes into a saw-tooth pattern. When these triangular troughs appeared, they were seen to propagate with the flow direction. Rivulet patterns formed on the PMMA surface are shown in figure 6.
Fingering instability without a cover plate.

4. Quantitative experimental results
Table 1 summarizes the quantitative experimental results, where  $\varOmega$ is the fuel-disk rotational speed in radians per second,
 $R$ is the radius of the exposed disk and
 $N_f$ is the total number of fingers formed at the conclusion of an experiment. For the runs with no cover plates, the radius
 $R$ is measured from the centre to the beginning of the fingering pattern.
In runs 1, 2, 4 and 5, the smallest radii studied (other than 3), fingering patterns were not observed. The melt layer formed on the surface burned up completely before it could spill over the edge of the cover plate in these tests. In run 3, a PMMA cone with a  $45^{\circ }$ cone angle was introduced instead of a flat disk, providing a larger burning surface and a greater melt volume for fingering patterns to form. In run 18, with no cover plate and at the highest rotational speed, the flame lies closer to the surface, and within the exposed area of the fuel disk a contact line could not be established.
5. Analysis and discussions
To test the wavelength correlation with the capillary number (as predicted by the linear stability theory (Troian et al. Reference Troian, Herbolzheimer, Safran and Joanny1989)) estimates for  $H$ and
 $U$ are needed. An approximate model may be developed as follows. An illustration of the geometry of the model problem is shown in figure 7. The melt layer is thin enough that lubrication theory (Rauscher, Kelly & Cole Reference Rauscher, Kelly and Cole1973) likely can be applied. The vertical,
 $z$, dependence of the radial,
 $u$, component of velocity then obeys the equation
 \begin{equation} {-}\varOmega^{2}r=\nu \frac{{\rm d}^{2}u}{{\rm d} z^{2}}, \end{equation}
where  $\nu$ is the kinematic viscosity of the melt, and
 $r$ is the radial coordinate. Applying the no-slip condition (
 $u=0$) at the melt–solid interface, (
 $z=0$), and a no-shear condition (
 ${\rm d} u/{\rm d} z=0$) at the melt-air interface (
 $z=h$) then leads to the solution
 \begin{equation} u=\frac{r\varOmega^{2}h^{2}}{\nu}\left(\frac{z}{h}-\frac{1}{2}\left[\frac{z}{h}\right]^{2}\right).\end{equation}
The height-averaged radial velocity at the location of the contact line,  $r=R$ can be evaluated from (5.2) to be
 \begin{equation} U=\frac{1}{3}\frac{\varOmega^{2}H^{2}R}{\nu},\end{equation}
where  $H$ (previously defined) is the height of the melt layer at
 $r=R$.
Illustration of the approximate model.

A characteristic time for the melt flow can be estimated as  $t_f \approx R/U \approx \nu /(\varOmega ^2 H^2)$. For the range of parameters considered in this study,
 $t_{f}$ is of the order of a second (estimating
 $\nu \approx 0.01$ m
 $^{2}$ s
 $^{-1}$,
 $\varOmega \approx 100~$s
 $^{-1}$ and
 $H\approx 1\times 10^{-3}$ m, estimated from experimental observations) and is much shorter than any other time scale except the rotational period. This suggests that the melt flow is quasisteady as assumed in the analysis. The volume flow rate
 $Q$ at the edge of the fuel disk can be obtained by integrating (5.2):
 \begin{equation} Q= \left (\frac{2 {\rm \pi}}{3} \right ) \frac{\varOmega^{2}R^{2}}{\nu}H^{3}. \end{equation}
The total volumetric rate of generation of melt can be expressed as  ${\rm \pi} R^2 V_m$ where
 $V_m$ is the velocity of penetration of the melt front into the solid. Most of the melted material vaporizes and burns in the flame, but a fraction
 $f$ of the total volume of melt escapes along the periphery (Nayagam & Williams Reference Nayagam and Williams2011). Thus,
 $Q=f{\rm \pi} R^2 V_m$, which relates
 $H$ to
 $V_m$ according to the previous equation. Although
 $V_m$ is, in general, a function of
 $\varOmega$, for the range of rotational velocities employed in this study it is reasonable to assume it to be approximately a constant. Equation (5.4) then yields an expression for
 $H$, namely
 \begin{equation} H=\left[\frac{3 f V_{m}\nu}{2 \varOmega^{2}}\right]^{1/3}. \end{equation}
The most dangerous wavelength (Jerrett & de Bruyn Reference Jerrett and de Bruyn1992),  $\lambda =14 H (3Ca)^{-1/3}$ , can now be evaluated using (5.3) and the definition of
 $Ca$, resulting in
 \begin{equation} \lambda=14\left[\frac{\sigma}{\rho}\frac{H}{\varOmega^{2}R}\right]^{1/3}.\end{equation}
The value of  $H$ in (5.6) is calculated from (5.5). The number of fingers around the periphery of a circle of radius
 $R$ can then be expressed as
 \begin{equation} N_{f}=\frac{2{\rm \pi} R}{\lambda}=\frac{\rm \pi}{7}\left[\frac{R}{H}\right](3Ca)^{1/3} = 14 \left[\frac{1}{(\sigma/\rho)} \frac{H}{\varOmega^2 R} \right ]^{1/3}. \end{equation}
In order to evaluate (5.7) we need estimates for the two unknown parameter groups, namely  $(\sigma /\rho )$ and
 $(f V_m \nu )$, which involves the physical properties of the melt
 $\rho$,
 $\sigma$ and
 $\mu$, and the experiment-related parameters
 $V_m$ and
 $f$. Among the physical properties, the melt density is fairly well established, and we use a value of
 $\rho = 1.09 \times 10^{3}$ kg m
 $^{-3}$ (Nayagam & Williams Reference Nayagam and Williams2000a). Accurate surface tension values as a function of melt temperature are also available from Yang et al. (Reference Yang, Xu, Liu and Wang2010):
 $\sigma = 44.372 -0.083T$, where
 $\sigma$ is measured in mN m
 $^{-1}$, and
 $T$ is in degrees Kelvin. Considerable uncertainty exists, however, for melt dynamic viscosity
 $\mu$ values, and they can vary by more than an order of magnitude depending upon the molecular weight of the polymer and temperature. A reasonable choice is the expression
 $\mu = 2.002e^{4617/T}$, where
 $\mu$ is measured in Pa s and
 $T$ is in degrees Kelvin, obtained in Nayagam & Williams (Reference Nayagam and Williams2000a) for high molecular weight PMMA by curve-fitting the experimental data of Kashiwagi et al. (Reference Kashiwagi, Shields, Harris and Davis2003).
The melt penetration velocity into the solid fuel  $V_m$ is readily estimated from the experimental results of King et al. (Reference King, Nayagam and Williams2000), which varies in the range 10
 $^{-5}$ to
 $3.0 \times 10^{-5}$ m s
 $^{-1}$. The fraction of the melt
 $f$ that is not consumed by the gas-phase flame has been calculated for high molecular weight PMMA as function of melt temperature in Nayagam & Williams (Reference Nayagam and Williams2011), and it varies between 0.04 to 0.12 for melt-temperature varying from 580 to 640 K. As a baseline, then we use the following values
 $\rho =1.09 \times 10^{3}$ kg m
 $^{-3}$,
 $\sigma = 15.6 \times 10^{-3}$ N m
 $^{-1}$,
 $\mu = 3428$ Pa s,
 $f = 0.08$ and
 $V_m = 1 \times 10^{-5}$ m s
 $^{-1}$, where
 $\sigma$ and
 $\mu$ are evaluated at a temperature of 620 K. The resulting values of
 $N_f$ calculated using (5.7) with the baseline parameters are shown in figure 8. Also shown in figure 8 is the best fit to the experimental data which requires one hundredth of the parameter grouping (
 $\,f \mu$), which reasonable considering the viscosity can vary several orders of magnitude between the low and high molecular weight PMMA (Kashiwagi et al. Reference Kashiwagi, Shields, Harris and Davis2003).
Test of the correlation with capillary number: open circles correspond to baseline parameter values, and closed circles with best fit value for  $f\mu$.

6. Conclusions
Melt layers at the upper surfaces of spinning thermoplastic disks of PMMA, generated by diffusion flames above them, can experience contact-line instabilities, resulting in the formation of patterns that often are straight-edged rivulets. The transverse spacings of these patterns, by suitable selections of values of parameters, can be made to correlate well with existing theories based on a capillary number. These observations thus provide an additional realm in which such theories can be applied.
Funding
The work of V.N. is funded by the NASA, United States contract 80GRC020D003.
Declaration of interests
The authors report no conflict of interest.



