

Does foreign direct investment (FDI) promote host countries' economic growth? Scholars and practitioners have argued that FDI can play a significant role in invigorating host economies and stimulating economic growth through capital accumulation and technology transfer. In addition, this conventional belief has served as a justification for various investment-friendly policy reforms in many countries. Although the positive externalities from FDI have been widely accepted by both scholars and policy makers, the empirical evidence for FDI-led growth has been debated.
While some studies find evidence for positive FDI spillovers in country case studies (Blomström, Reference Blomström1986; Wei and Liu, Reference Wei and Liu2006; Buckley et al., Reference Buckley, Wang and Clegg2007; Tian, Reference Tian2007) other empirical literature shows a mixed or null effect of FDI on growth and productivity improvements (Haddad and Harrison, Reference Haddad and Harrison1993; Aitken and Harrison, Reference Aitken and Harrison1999; De Mello, Reference De Mello1999; Javorcik, Reference Javorcik2004; Carkovic and Levine, Reference Carkovic, Levine, Graham, Moran and Blomström2005; Wang, Reference Wang2009; Havranek and Irsova, Reference Havranek and Irsova2011; Iršová and Havránek, Reference Iršová and Havránek2013). More importantly, scholars find that the positive relation between FDI and growth is conditional upon policy- and country-specific circumstances (Elias, Reference Elias1990; Balasubramanyam et al., Reference Balasubramanyam, Salisu and Sapsford1996, Reference Balasubramanyam, Salisu and Sapsford1999; Borensztein et al., Reference Borensztein, De Gregorio and Lee1998; De Mello, Reference De Mello1999; Xu, Reference Xu2000; Nair-Reichert and Weinhold, Reference Nair-Reichert and Weinhold2001; Basu et al., Reference Basu, Chakraborty and Reagle2003; Bengoa and Sanchez-Robles, Reference Bengoa and Sanchez-Robles2003; Hermes and Lensink, Reference Hermes and Lensink2003; Blalock and Simon, Reference Blalock and Simon2009; Azman-Saini et al., Reference Azman-Saini, Law and Ahmad2010; Javorcik and Spatareanu, Reference Javorcik and Spatareanu2011; Damijan et al., Reference Damijan, Rojec, Majcen and Knell2013; Ha and Giroud, Reference Ha and Giroud2015). Given the mixed empirical evidence, scholars have emphasized the importance of identifying the economic conditions under which FDI spillovers are likely to occur and facilitate economic growth. In particular, scholars have paid much attention to host countries' absorptive capacities, which are determined by economic preconditions such as the quality and quantity of human capital, and the development of a well-functioning financial system (Borensztein et al., Reference Borensztein, De Gregorio and Lee1998; De Mello, Reference Aitken, Hanson and Harrison1999; Bengoa and Sanchez-Robles, Reference Bengoa and Sanchez-Robles2003; Hermes and Lensink, Reference Hermes and Lensink2003; Alfaro et al., Reference Alfaro, Chanda, Kalemli-Ozcan and Sayek2004; Durham, Reference Durham2004; Blalock and Simon, Reference Blalock and Simon2009; Javorcik and Spatareanu, Reference Javorcik and Spatareanu2011; Damijan et al., Reference Damijan, Rojec, Majcen and Knell2013; Ha and Giroud, Reference Ha and Giroud2015).
However, political determinants of FDI-led growth have been rather underemphasized. This is surprising, because the economic preconditions mentioned above are not purely exogenous but largely shaped by the policy environment that host governments provide, which is usually a function of government preferences. The argument that certain economic preconditions catalyze FDI spillovers obviously helps our understanding of the economic consequences of FDI, but it appears to overlook important political factors that disentangle the relationship between FDI and growth. To fill this gap, this paper examines how political leaders' policy preferences influence FDI-led economic growth, particularly in autocratic countries.
Democratic countries, compared with autocracies, tend to provide more market-friendly institutions, including sound rule of law and domestic political constraint mechanisms. However, democratic leaders' discretion over economic policy-making is often undermined by domestic audiences' preferences and veto players (Li and Resnick, Reference Li and Resnick2003; Jensen, Reference Jensen2003). By contrast in autocracies, rulers' preferences are the driving force of economic policy choices due to the relative lack of institutional checks. Autocrats are better able to construct their country's economic environments in a way that maximizes their own self-interest. Given autocrats' relatively higher political discretion over economic policy making, when it comes to investigating the role host governments' policy preferences play in FDI's growth-enhancing effect, we believe that examining autocratic host countries would be theoretically more relevant and straightforward.
Drawing from the literature on autocratic time horizons (ATHs) (e.g., Olson, Reference Olson1993; Clague et al., Reference Clague, Keefer, Knack and Olson1996) – that is, leaders' expected stay in power – we argue that autocratic leaders with long-time horizons are likely to facilitate positive spillovers of FDI, mainly by building sound property rights institutions. Autocrats with long-time horizons tend to value economic growth since they expect long-term economic gains to exceed short-term profits from predatory policies such as excessive taxation and confiscation of private properties. Thus, the productivity-oriented political motivation of autocrats with long-time horizons induces a well-functioning property rights system, which provides a safety net under which foreign and domestic firms are assured of being protected by the rule of law. In such a business-friendly environment, foreign firms are less afraid of expropriations of assets or infringement of intellectual property rights, while domestic firms are more willing to adopt FDI spillovers, increase investment, and expand their businesses. Thus, our theory suggests that FDI-led growth is more likely when autocrats' time horizons are sufficiently long. Our empirical analysis, which covers 64 autocratic countries from 1970 to 2005, not only supports this theoretical expectation, but provides evidence for the theoretical mechanism itself.
This paper contributes to two bodies of literature. First, it cuts through the debate on FDI spillovers and growth by identifying the underlying political source of economic preconditions that stimulate FDI-led growth. Second, our findings add to a growing body of literature on autocratic political economy, which has noted significant variations in political and economic performances within autocratic regimes. In the following sections, we briefly review the literature on FDI-led growth, and relate the discussion to ATH. We then present our research design and empirical findings.
1. FDI spillovers and economic growth
Existing literature provides a number of different channels through which positive FDI spillovers occur.Footnote 1 These channels include a learning from foreign companies (Wang and Blomström, Reference Wang and Blomström1992; Blomström and Kokko, Reference Blomström and Kokko1998),Footnote 2 diffusion of knowledge through the domestic employees of multinational corporations (Fosfuri et al., Reference Fosfuri, Motta and Rønde2001), positive backward linkages (Spencer, Reference Spencer2008), and domestic competitions with foreign companies (Wang and Blomström, Reference Wang and Blomström1992).Footnote 3 Interestingly enough, although these channels for positive FDI spillovers may well contribute to host countries' economic growth, empirical evidence is contested (e.g., Haddad and Harrison, Reference Haddad and Harrison1993; Aitken and Harrison, Reference Aitken and Harrison1999; De Mello, Reference De Mello1999; Javorcik, Reference Javorcik2004; Carkovic and Levine, Reference Carkovic, Levine, Graham, Moran and Blomström2005; Havranek and Irsova, Reference Havranek and Irsova2011; Iršová and Havránek, Reference Iršová and Havránek2013).
One possible reason for these mixed empirical findings lies in the heterogeneity of host economies.Footnote 4 Some countries may be better equipped with absorb technology and know-how from MNCs than others. For example, FDI spillovers are likely to occur only in countries that have sufficient human capital (Borensztein et al., Reference Borensztein, De Gregorio and Lee1998; Xu, Reference Xu2000; Bengoa and Sanchez-Robles, Reference Bengoa and Sanchez-Robles2003). Hermes and Lensink (Reference Hermes and Lensink2003) and Azman-Saini et al. (Reference Azman-Saini, Law and Ahmad2010) show that the development of a sound financial system is a precondition for FDI's positive effect on growth. Similarly, Alfaro et al. (Reference Alfaro, Chanda, Kalemli-Ozcan and Sayek2004) contend that FDI has a positive effect on growth in countries with well-developed financial markets. Balasubramanyam et al. (Reference Balasubramanyam, Salisu and Sapsford1996) demonstrate that the positive effect of FDI on growth is significant for host countries with export promotion policies. Damijan et al. (Reference Damijan, Rojec, Majcen and Knell2013) find that positive spillovers appear in medium or high productivity firms with higher absorptive capacities.
In sum, these studies disentangle the FDI-growth nexus by investigating how heterogeneous economic preconditions in host countries affect FDI spillovers. However, to understand the microfoundation of the relation between FDI and growth, the following question needs to be answered: what makes certain host countries more likely to adopt growth-friendly institutions and policies in the first place? The aforementioned preconditions for FDI-led growth are not exogenously dictated, but created and promoted (or demoted) by host governments. More importantly, the literature lacks discussion on the role of property rights protection in moderating the relationship between FDI and growth. In the next section, we attempt to demonstrate how ATHs influence host countries' property rights protection, in turn affecting FDI-led growth.
2. Autocratic time horizons, property rights, and FDI-led growth
FDI is not a magic pill for host countries' economic growth, but can be a catalyst for the development of local businesses and entrepreneurship. For FDI's positive spillovers to occur, domestic economic actors should not only adapt themselves to new technologies and business practices brought by FDI, but must grow to be self-sustaining. Unless domestic businesses do away with significant reliance on foreign capital and productivity, negative spillovers may have an adverse impact on the host country's economic growth. For example, foreign firms may dominate a host country's domestic market, crowd out potential domestic competitors (Aitken and Harrison, Reference Aitken and Harrison1999), and hurt infant domestic industries by increasing labor costs (Zhang et al., Reference Zhang, Li, Li and Zhou2010). Thus, FDI-led growth is likely to occur (1) when foreign firms are willing to transfer technologies and know-hows, and (2) when local businesses are willing to make investments to accommodate new operating systems, train local workers, and become competitive in both domestic and global markets. We contend that these two general conditions are likely to be fulfilled in autocratic countries with long-time horizons, particularly through the protection of property rights.
ATH is an autocrat's expectation of job security in the future. As Olson (Reference Olson1993) posits,Footnote 5 self-interested autocrats with long-time horizons are likely to adopt optimal (or revenue-maximizing) taxation, promote domestic economic productivity, and build market-friendly domestic institutions, thus protecting property rights strongly and providing public goods to domestic economic actors. That is because they expect their long-term benefits through economic growth to outweigh short-term predatory rents. To the contrary, autocrats with short time horizons resemble roving bandits who tend to be highly myopic and predatory. Their utmost interest is in maximizing their short-term private gains at the expense of domestic economic productivity. Thus they are likely to build and strengthen rent-extraction mechanisms that require significant government control over domestic assets, economic activities, and markets, by imposing excessive taxation and confiscating capital goods. Since Olson's pioneering research, scholars have uncovered empirical evidence for this conjecture. Wright (Reference Wright2008), for example, argues that autocrats with long-time horizons are more likely to use foreign aid effectively for economic growth. Clague et al. (Reference Clague, Keefer, Knack and Olson1996) find that they are more likely to protect property and contract rights. Moon (Reference Moon2015) demonstrates that autocratic regimes with long-time horizons provide better property rights institutions, thus attracting more FDI. Scholars also find that those far-sighted autocrats are less likely to confiscate private properties and expropriate foreign investments (Li, Reference Li2009a), and less prone to corruption (Chang and Golden, Reference Chang and Golden2007). Similarly, it is also argued that the long-time horizons give governments incentive to maintain greater room to manipulate policy when it comes to designing bilateral investment treaties (Blake, Reference Blake2013).
This market-friendly preference structure leads autocratic countries with long-time horizons to provide conditions under which FDI-led economic growth is likely to occur. We argue in particular that such countries are liable to benefit from FDI spillover through secure property rights institutions,Footnote 6 via property right institutions. Since autocratic governments with long-time horizons are generally interested in economic growth, underlying preference could be realized through a development of infrastructure, human capital, or other market friendly economic policies. We will discuss more on this in the empirical analysis section. First, foreign firms' willingness to transfer technologies and know-how depends on there being sound rule of law under which they are likely to believe that their property rights will not be infringed by the host government and local businesses. The growth of infant domestic industries, often expedited by FDI, starts from imitating advanced technologies and business operations. However, foreign firms would be reluctant to transfer their technology and skills if the host government and local businesses are willing and able to take them without proper payment. Thus, foreign investors' confidence in the enforcement of property rights over their intellectual properties or physical assets is essential. Conversely, the absence of well-enforced property rights should hinder such positive spillovers by making foreign firms more risk-averse and myopic. For example, country case studies find evidence that firms are unwilling to transfer technologies when the developing host countries have a weak system of intellectual property rights protection (Mansfield, Reference Mansfield1994; Maskus, Reference Maskus1994). Olofsdotter (Reference Olofsdotter1998) also shows evidence that sound property rights institutions and efficient bureaucracies facilitate FDI spillovers.
Property rights protection also reassures domestic firms that their investments will be protected from illegal expropriations. For local businesses to increase their capacity to absorb advanced technologies and efficient management skills, they should invest in training programs for local labor and reforming business operations, which are costly. Similarly, unless local firms have confidence in the legal protection of their investment and subsequent economic outcomes, they would be extremely risk-averse for fear of government exploitation and corrupt (and/or inefficient) bureaucracies. Even when FDI's positive spillovers are available, the host country's economic growth is not guaranteed if local companies remain to be uncompetitive subsidiaries of foreign firms. On the other hand, once domestic economic actors have confidence in the government's credible promise to protect their property rights, they will be more willing to make investments to increase their absorptive capacities and imitate management know-hows.
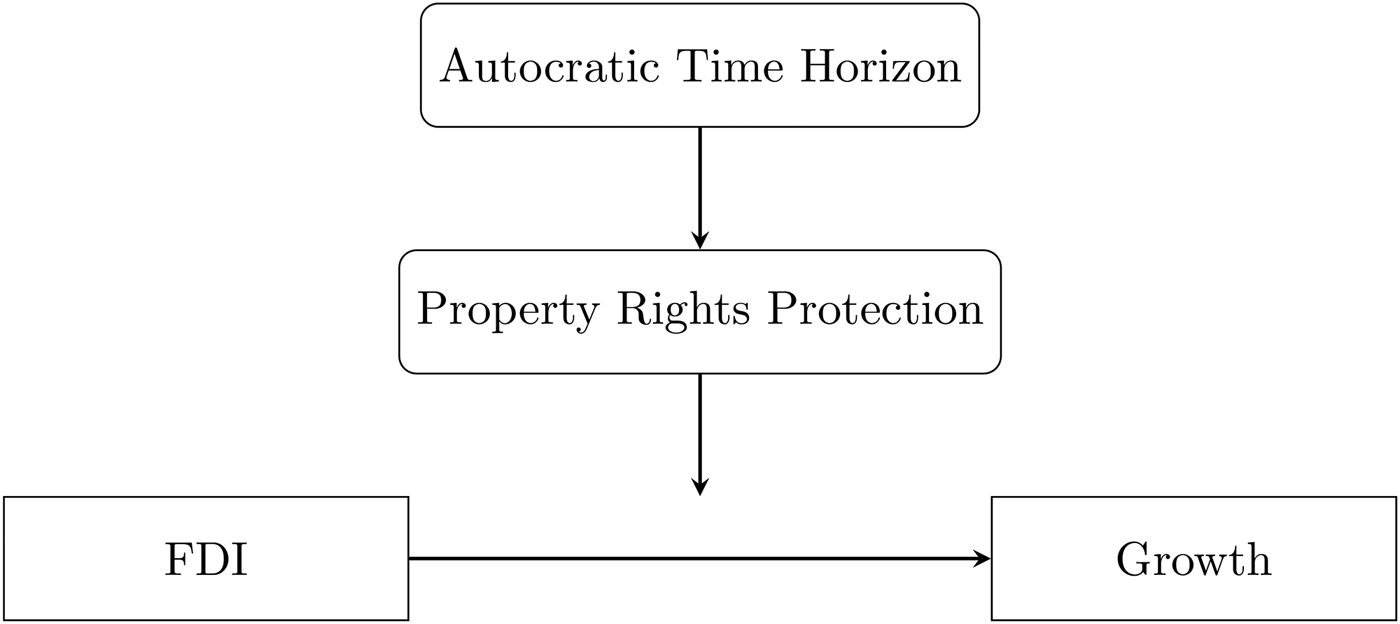
In sum, we hypothesize that FDI has positive effect on growth when an autocratic host country's leadership time horizon is sufficiently long. In the empirical analysis section, we further test whether this conditional relationship is through property right institutions, as Figure 1 denotes.Footnote 7
Moderating effect of ATH FDI-led growth.

3. Research design
We estimate the impact of FDI on economic growth, moderated by autocratic leadership time horizon, in a panel dataset of 64 countries for 36 years (1970–2005). The sample of autocratic countries is taken from the regime-type dataset created by Geddes et al. (Reference Geddes, Wright and Frantz2014).Footnote 8 In years of leadership turnover, we consider only a single leader who held the leadership position on the first day of each year (Goemans et al., Reference Goemans, Gleditsch and Chiozza2009). As Figure 1 shows, our theoretical mechanism is more than just showing the moderating effect of ATH. After demonstrating empirical evidence for our hypothesis, we further investigate whether the mechanism itself is empirically supported.
3.1 Estimator
Our methodological approach is incremental starting from a simple ordinary least squares (OLS) framework to more sophisticated models. First, we estimate a growth model using OLS controlling for country-specific fixed effects and serial autocorrelation.Footnote 9 However, in estimating these models for the dynamic panel dataset, we encounter multiple econometric problems that may not be solved using a simple OLS framework.
First, we run fixed-effects models because country-specific characteristics are likely to be correlated with the independent variables as well as with the error term that contains unobserved country-specific confounders. Yet, a fixed-effects model poses a problem (so-called Nickell bias) in our dynamic panel data with a small number of time periods compared with a larger number of countries; i.e., Nickell (Reference Nickell1981) demonstrates that the standard fixed-effects estimator generates inconsistent estimates in dynamic panel data with small T and large N.Footnote 10
Second, the explanatory variables are likely to be endogenous to economic growth. For example, FDI may well promote economic growth by invigorating and expanding a host country's market, in turn inviting further FDI.Footnote 11 In addition, ATHs may be endogenous to growth from a theoretical standpoint; that is, an autocratic leader may be more likely to expect to survive in office when the country's economy is vibrant and growing, which makes the leader better equipped with fund government projects and provide patronage goods to elites in the winning coalition (Bak and Moon, Reference Bak and Moon2016). Given multiple endogeneity problems, using a conventional two-stage least squares estimator also poses a daunting methodological challenge; that is, finding highly relevant and exogenous instruments for multiple endogenous variables is challenging.
Given these econometric concerns, we use the Arellano–Bond generalized method of moments (GMM) estimator (Arellano and Bond, Reference Arellano and Bond1991), originally proposed by Holtz-Eakin et al. (Reference Holtz-Eakin, Newey and Rosen1988).Footnote 12 By taking first differences in the variables of interest, we eliminate country-specific effects. In addition, the estimator makes endogenous regressors pre-determined by using their lagged values, which also allows us to exploit the in-sample information as much as possible. In particular, Carkovic and Levine (Reference Carkovic, Levine, Graham, Moran and Blomström2005), who examines the growth-accelerating effect of FDI, provide a useful starting point for the econometric framework.
Consider the following growth equation first:
 $$\eqalign{{\rm \Delta GD}{\rm P}_{i,t} =\; &{\rm GD}{\rm P}_{i,t}-{\rm GD}{\rm P}_{i,t-1} \cr =\; &\lpar {\alpha -1} \rpar {\rm GD}{\rm P}_{i,t-1} + \beta x_{i,t} + \gamma {\rm CONTRO}{\rm L}_{i,t-1} + \tau {\rm YEA}{\rm R}_t + \eta \lambda _i + \epsilon _{i,t}} $$
where the dependent variable, GROWTH, is real GDP per capita growth. x refers to a set of endogenous variables that include FDI inflows (FDI), ATH, and the multiplicative interaction term (FDI × ATH). CONTROL is a set of control variables, YEAR refers to year-specific effects (year dummies), λ represents country-specific fixed effects, and ε shows the error term.
Rearranging the above equation gives
 $${\rm GD}{\rm P}_{i,t} = \alpha {\rm GD}{\rm P}_{i,t-1} + \beta x_{i,t} + \gamma {\rm CONTRO}{\rm L}_{i,t-1} + \tau {\rm YEA}{\rm R}_t + \eta \lambda _i + \epsilon _{i,t}$$
To swipe away the country-specific effects, we take first differences of the above, and get the following dynamic panel equation:
 $${\rm GD}{\rm P}_{i,t}-{\rm GD}{\rm P}_{i,t-1} = \alpha \lpar {{\rm GD}{\rm P}_{i,t-1}-{\rm GD}{\rm P}_{i,t-2}} \rpar + \beta \lpar {x_{i,t}-x_{i,t-1}} \rpar + \gamma \lpar {{\rm CONTRO}{\rm L}_{i,t}-{\rm CONTRO}{\rm L}_{i,t-1}} \rpar + \tau {\rm YEA}{\rm R}_t + \lpar {\epsilon_{i,t}-\epsilon_{i,t-1}} \rpar $$
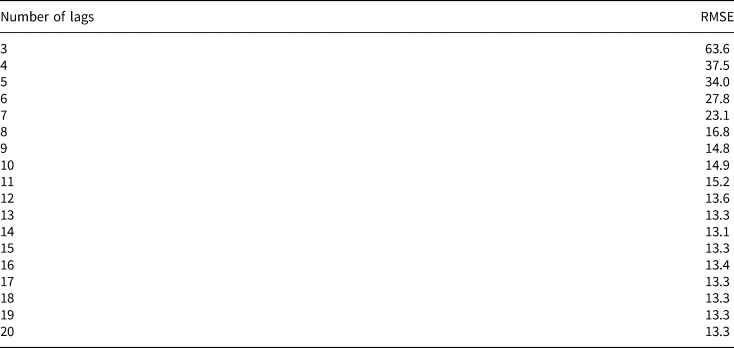
This differential equation is required to meet moment conditions to ensure the weak exogeneity of the instruments; e.g., E[x i,t−m(m > 1)(ε i,t − ε i,t−1)] = 0, and E[GDPi,t−m(m > 1)(ε i,t − ε i,t−1)] = 0. Differencing may make the lagged levels of the endogenous regressors weak instruments for differences, thus making the model inefficient and biased (Blundell and Bond, Reference Blundell and Bond1998). This concern looms large ‘when the explanatory variables are persistent over time’ (Carkovic and Levine, Reference Carkovic, Levine, Graham, Moran and Blomström2005, 200), such as FDI and ATH in our models. Thus, as a robustness check, we also use the system GMM estimator that incorporates the level equations using lagged differences of explanatory variables as additional instruments (Blundell and Bond, Reference Blundell and Bond1998). To ensure the validity of the instruments, we check the Hansen-J over-identification test.Footnote 13 Roodman (Reference Roodman2009) warns that too many instruments can weaken the Hansen test, which is signified by the P-values of 1.000. Roodman (Reference Roodman2009) suggests that ‘Researchers should also test for robustness to severely reducing the instrument count’ (129). To address this issue, we report the number of instruments, and perform several robustness checks. First, we determine the optimal number of lags such that the root mean squared error is minimized (reported in the appendix). In addition, we reduce the number of instruments significantly using a single instrument for each variable and lag distance rather than using all lagged values as instruments, and replacing the GMM instruments with their principal components. We also check the potential second-order autocorrelation in first differences.Footnote 14 Finally, we use robust standard errors that are consistent against heteroskedasticity and autocorrelation within panels.
3.2 Variables and measurement
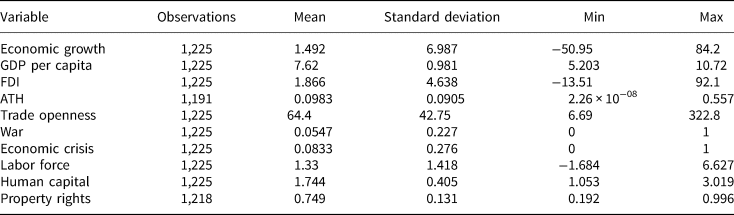
In this section, we discuss how we measure the variables included in the regression. The in-sample summary statistics for all variables is presented in the appendix.
3.2.1 FDI
FDI is foreign direct investment inflows as a share of GDP, taken from the UNCTAD FDI database (UNCTAD, 2010). This particular measure of FDI is not only common in recent cross-country FDI-growth studies (e.g., Jong Il, Reference Jong Il2003; Alfaro et al., Reference Alfaro, Chanda, Kalemli-Ozcan and Sayek2004; Carkovic and Levine, Reference Carkovic, Levine, Graham, Moran and Blomström2005; Li and Liu, Reference Li and Liu2005; Duttaray et al., Reference Duttaray, Dutt and Mukhopadhyay2008), but also well-suited for our theory for the following reasons. First, the absolute amount of FDI inflows may not be able to capture the relative importance of FDI for a country's economy. Since our theory posits that FDI is a significant determinant of a country's economic growth, the FDI measure should be able to capture how much the host country's economy is reliant upon FDI, as also demonstrated in Li (Reference Li2009b). Second, Kerner (Reference Kerner2014) shows that FDI stock is appropriate when a researcher is interested in the determinants of MNCs' commercial activities. While the MNC performance may contribute to the host country's economic growth, we are more interested in the stimulating effect of FDI flows than that of the underlying FDI stock.
3.2.2 Autocratic time horizon (ATH)
ATH refers to an autocratic leader's expectation of how long (s)he is going to stay in office, which is a latent concept neither directly observable nor measurable. To measure ATH, researchers may use individual proxies to capture the underlying level of leadership (in)stability, such as the number of past leadership turnovers or changes in the chief executive, the number of past coups, regime durability, or the age of the regime (Clague et al., Reference Clague, Keefer, Knack and Olson1996). However, an important shortcoming of this approach is that these indicators do not capture time-varying aspects of ATH within an autocratic country spell or an autocratic leadership spell. For example, the number of past government turnovers and regime age are unable to delineate annual levels of leadership (in)stability because these measures assume that ‘every regime within a particular autocratic spell has the same amount of instability, which is unlikely’ (Wright, Reference Wright2008, 979).Footnote 15
An alternative method is to estimate the probability of autocratic leadership failure for a given leader-year using multiple indicators of leadership (in)stability as explanatory variables (Wright, Reference Wright2008; Blake, Reference Blake2013; Moon, Reference Moon2015). While utilizing more relevant information, this approach relies on a critical assumption that ‘autocrats themselves are attuned to the same predictors of leadership survival as researchers’ (Wright, Reference Wright2008, 980). Researchers as outside observers may not be able to fully access private information held by autocratic regimes and leaders themselves. Furthermore, ATH estimates inherently contain fundamental uncertainties about leaders' self-assessment of their time horizons and estimation uncertainties around point estimates of ATH, both of which are not easily captured in the estimated measure of ATH (i.e., probability of leadership failure). Despite these theoretical and methodological challenges, we prefer this approach to using time-invariant individual proxies for several reasons. First, the predicted probability of leadership failure captures temporal variations in ATH over the course of multiple regime changes within an autocratic country. Second, it utilizes more information in the data. Third, it reveals annual variations within an autocratic leadership spell.
To address the issue about estimated uncertainties around the point estimates of ATH, we also report the results of a bootstrapping model in the appendix. In this model, we run the system of equations, both the ATH and growth equations, using 1,000 bootstrapped samples.Footnote 16
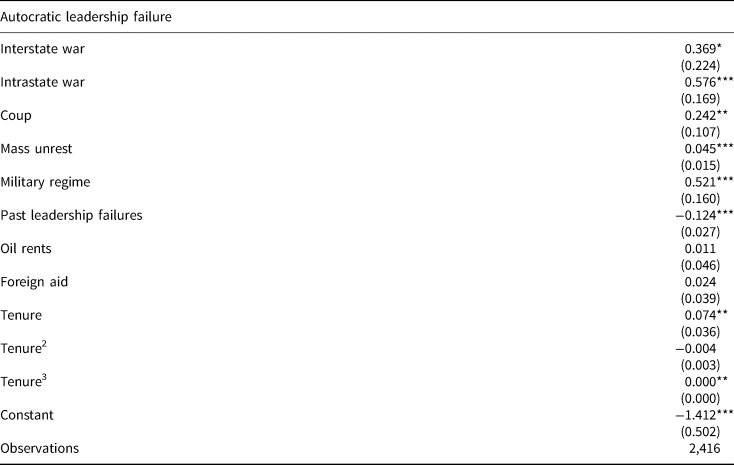
To estimate ATH, we run a probit regression of autocratic leadership failure as the dependent variable. We use the Archigos database (Goemans et al., Reference Goemans, Gleditsch and Chiozza2009) to identify leadership-failure years. The ATH equation also includes multiple predictors of leadership failure: interstate war and intrastate war using the UCDP armed conflict data (Gleditsch et al., Reference Gleditsch, Wallensteen, Eriksson, Sollenberge and Strand2002), the number of coup attempts (Powell and Thyne, Reference Powell and Thyne2011), the amount of mass unrest from the Cross-National Time-Series Data Archive (CNTS) (Banks and Wilson, Reference Banks and Wilson2013),Footnote 17 unrest includes strikes, riots, and demonstrations, military regime (Geddes et al., Reference Geddes, Wright and Frantz2014),Footnote 18 the number of past leadership failures (Goemans et al., Reference Goemans, Gleditsch and Chiozza2009),Footnote 19 the natural logarithm of oil rents (Ross, Reference Ross2012), the natural logarithm of official development assistance as a share of GDP (OECD, 2015),Footnote 20 and leadership tenure and its squared and cubed terms (Goemans et al., Reference Goemans, Gleditsch and Chiozza2009).Footnote 21 In addition, region-specific and country-specific effects are included.Footnote 22
Table A3 in the appendix reports the results from the ATH equation. We find that interstate war, intrastate war, coup, mass unrest, and military regime have positive effects on leadership failure. However, the leadership-stabilizing effect of oil and aid appears to be minimal. The higher the estimated probability of leadership failure, the shorter time horizon a leader has in a given year: that is, the higher Pr(leadership failure), the shorter ATH.
3.2.3 Control variables
We include several control variables without which omitted variable bias is suspected. First, we control for the initial level of economic development (initial gdp) measured by the natural logarithm of GDP per capita, and trade openness using the Penn World Tables v.7.1 (Heston et al., Reference Heston, Summers and Aten2011). We also include an index for the level of property rights protection using the contract-intensive money (cim) indicator (Clague et al., Reference Clague, Keefer, Knack and Olson1999). Recent experiences of war can severely damage the prospect of economic growth, so our control for war indicates whether a country has experienced interstate or intrastate war in a given year using the UCDP armed conflict data (Gleditsch et al., Reference Gleditsch, Wallensteen, Eriksson, Sollenberge and Strand2002). In addition, the presence of economic crisis is controlled for using the Reinhart–Rogoff financial crisis database (Reinhart and Rogoff, Reference Reinhart and Rogoff2011).Footnote 23 Finally, two additional control variables (the quantity and quality of labor forces) are includedFootnote 24: (1) the logarithm of the number of active labor forces in millions, and (2) the human capital index.Footnote 25 All control variables are lagged by 1 year.Footnote 26
4. Results
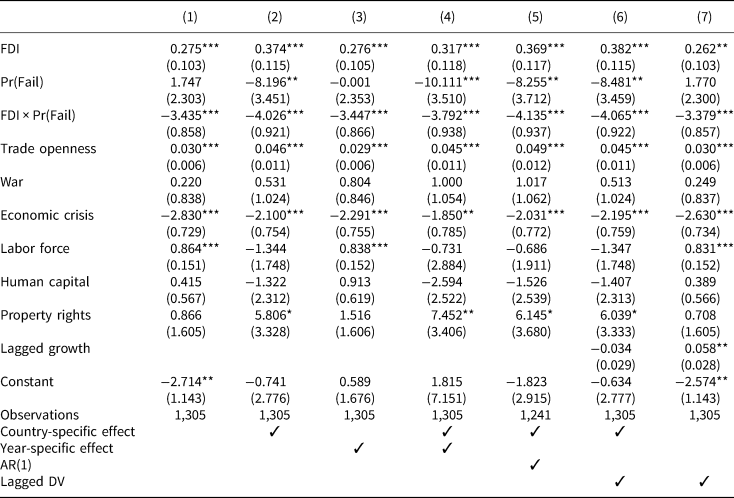
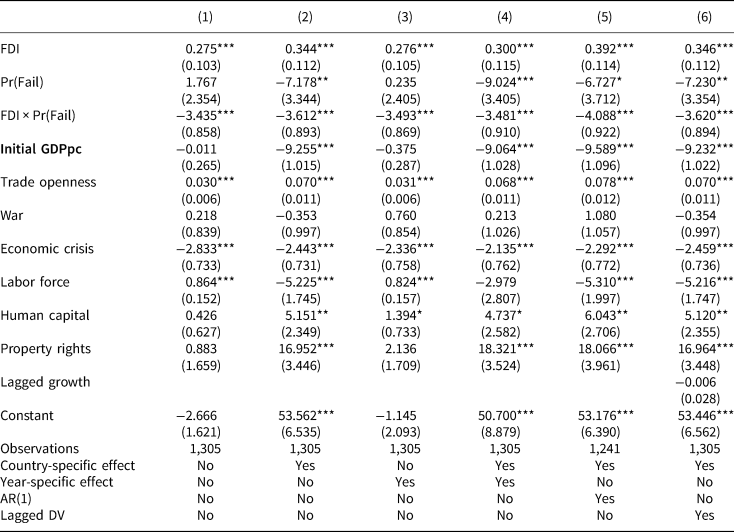
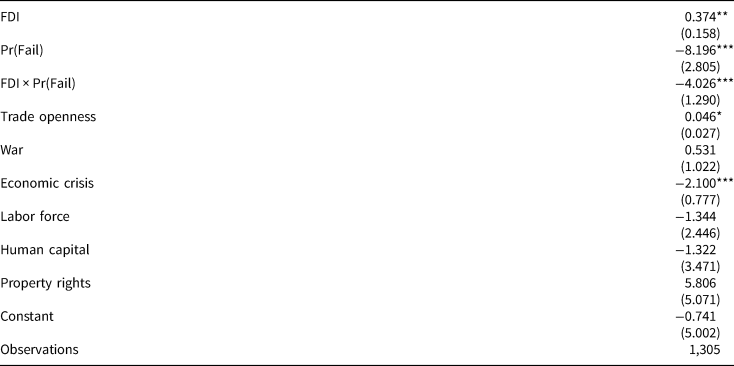
Table 1 shows the results from the OLS regressions. In a nutshell, FDI appears to have a significant and positive effect on growth when the expected probability of leadership failure is quite low. Conversely, FDI's positive effect on growth remains significant when ATH is substantially long, approximately less than 0.04. In spite of the short range of FDI's positive effect, the conditioning effect of ATH is not negligible because about 29% of the observations within the regression sample lie below 0.04 in ATH. This finding indicates that FDI is expected to improve economic growth only when autocratic host countries' leadership time horizons are sufficiently long. However, the validity of these results is suspected due to the econometric problems pertaining to OLS.
Effect of FDI on economic growth: OLS

Note: Pr(Fail) indicates the probability of leadership failure. All variables are lagged by 1 year. The number of countries is 64. Standard errors are presented in parentheses. *P < 0.10; **P < 0.05; ***P < 0.01 (two-tailed tests).
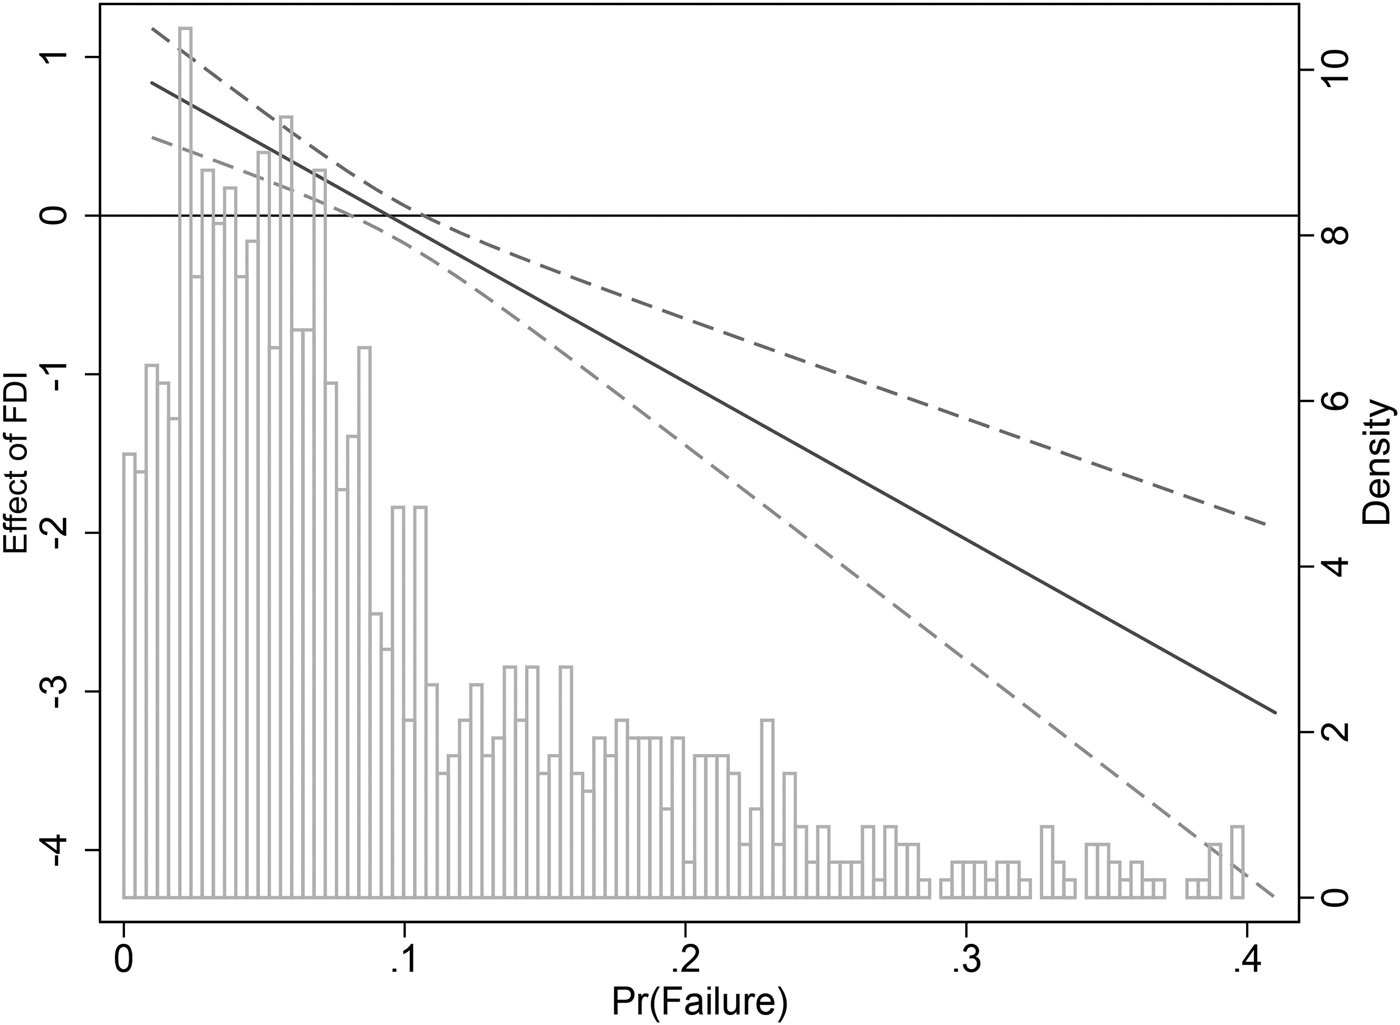
In Table 2, we present the results from the dynamic panel GMM models. The first five models feature the results from the difference-GMM models, and the last column shows the results from the system-GMM model. In all models, we find that FDI's positive effect on growth is significantly conditioned by ATH. Although this finding indicates robust empirical evidence in support of our hypothesis, we find a warning sign from some of these models. In four models, the P-value of the Hansen-J statistics is 1; this is a worrisome symptom of an excessive number of instruments (Roodman, Reference Roodman2009). However, model 4 shows that the number of instruments is very close to the number of countries, and the Hansen-J P-value is 0.608, which indicates that model 4 suffers least from the ‘too many instruments’ problem. Thus, we present our results graphically in Figure 2, based on model 4.
Effect of FDI on economic growth: dynamic panel GMM

Note: Pr(Fail) indicates the probability of leadership failure. Collapse means that the model uses a single instrument for each variable and lag distance instead of using all lagged values as instruments. The model with PCA replaces the GMM instruments with their principal components. In model 2, the optimal lag structure (15) is determined by the minimum RMSE. All variables are lagged by 1 year. All columns include year dummies (not reported). Robust standard errors are presented in parentheses. *P < 0.10; **P < 0.05; ***P < 0.01 (two-tailed tests).
Effect of FDI on growth. Note: The graph is based on the estimates in model 4 of Table 2. The dotted lines show the 95% confidence intervals. The upper bound of the x-axis marks the 99th percentile of the ATH distribution within the regression sample. The histogram shows the distribution of ATHs within the regression sample.

The graph shows that the lower bound of the marginal effect of FDI remains positive when the probability of leadership failure is below 0.09. Approximately 62% of observations within the regression sample have the probability of leadership failure lower than 0.09. Conversely, FDI appears to promote economic growth in autocratic host countries for more than half of the autocratic country-years in our regression sample, in which leadership time horizons are sufficiently long. Another interesting finding is that FDI appears to have a negative effect on autocratic countries' economic growth when autocrats have short time horizons, which casts doubt on the widely-held belief in the growth-enhancing effect of FDI. The average probability of leadership failure is approximately 0.1 in our sample, which indicates that on average FDI does not appear to significantly accelerate economic growth in autocratic host countries.
Substantively, for example, when the in-sample probability of leadership failure is at the 25th percentile of ATH (0.04), we expect that 1% increase in FDI/GDP is on average associated with 0.54% increase in growth. On the other hand, when the probability of failure is at the 75th percentile (0.14), 1% increase in FDI/GDP is expected to decrease economic growth by 0.44%. Similarly, the result suggests that increase in Pr.(Failure) from the mean by one standard deviation (0.1) results in approximately 0.98% decrease in autocratic host countries' economic growth that is associated with 1% increases in FDI/GDP.
Regarding the performance of control variables, we find some consistent results across models. First, the higher is the level of property rights protection, the higher rate economic growth expected. economic crisis appears to have a negative effect on economic growth in most of the models. trade openness affects economic growth positively in all models. In some models, we also find that labor force has a positive effect on growth.
5. Tests of theoretical mechanism
The theoretical mechanism indicates that FDI induces economic growth when an autocratic country strongly protects property rights. We examine this mechanism empirically in two steps.
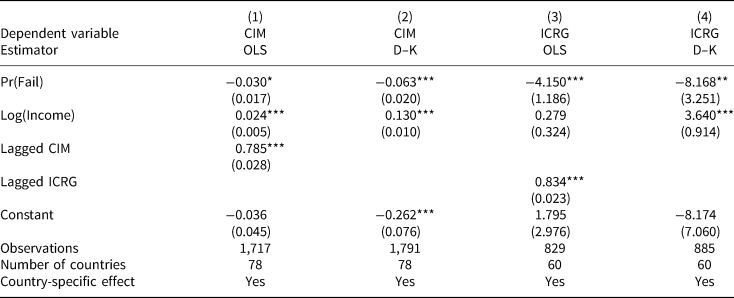
First, we replicate an empirical model in Clague et al. (Reference Clague, Keefer, Knack and Olson1996) in which the authors examine the impact of leadership time horizons on the level of property rights protection. Using our measure of ATH and their model specifications, we find similar results. Using models 1 and 2 in Table 3, we examine how ATH affects the level of contract-intensive money (CIM). For a robustness check, although the temporal dimension is limited, we use the property rights index from the International Country Risk Guide (ICRG) (PRS, 2007) as the dependent variable in models 3 and 4. The estimator of models 1 and 3 is OLS with a lagged dependent variable and country fixed effects, while models 2 and 4 use Driscoll and Kraays' (1998) covariance matrix estimator (D–K) with fixed effects and AR(1) autocorrelation error structure. In all models, we find that as ATH decreases or Pr.(Leadership Failure) increases, the level of CIM significantly decreases, which is consistent with our theoretical argument as well as the finding of Clague et al. (Reference Clague, Keefer, Knack and Olson1996).
Effect of ATH on property rights protection

Note: D–K stands for Driscoll and Kraays (1998) covariance matrix estimator with fixed effects. All models include country-fixed effects. D–K models 2 and 4 use the first-order autocorrelation structure of error. Robust standard errors are presented in parentheses. *P < 0.10; **P < 0.05; ***P < 0.01 (two-tailed tests).
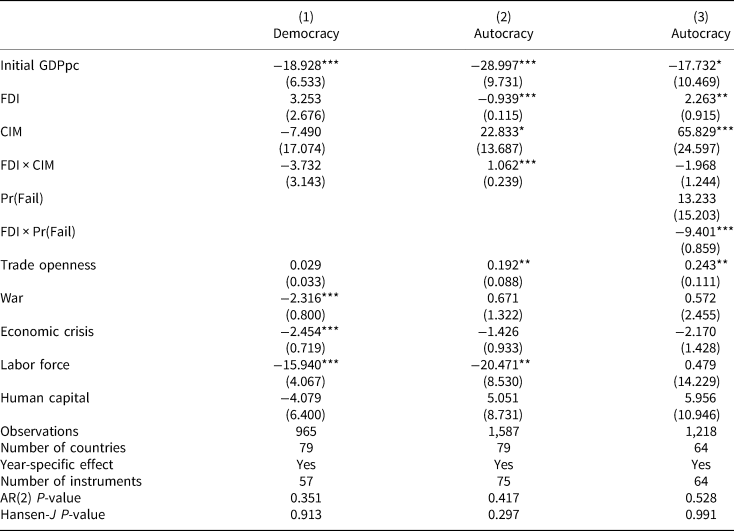
Next, we examine whether FDI has positive effect on growth only when CIM is sufficiently high, using an interaction term between FDI and CIM. Using the same dynamic panel GMM, excluding information about ATH, the results in model 2 of Table 4 show that property rights is a significant factor that moderates the relationship between FDI and economic growth. Interestingly enough, such an empirical pattern does not hold in democracies. This finding implies that our theoretical mechanism is likely to be unique to autocratic countries. Additional evidence for our mechanism is found in model 3, in which we include ATH and FDI × ATH, in order to see how the conditioning effect of CIM changes when we include the political variable (ATH) that is expected to determine the level of property rights protection. The results show that the moderating effect of CIM is absorbed by ATH, while the moderating effect ATH remains significant.
Effect of FDI on growth conditioned by property rights protection

Note: Pr(Fail) indicates the probability of leadership failure. All models use a single instrument for each variable and lag distance instead of using all lagged values as instruments, replacing the GMM instruments with their principal components. All variables are lagged by 1 year. All columns include year dummies (not reported). Robust standard errors are presented in parentheses. *P < 0.10; **P < 0.05; ***P < 0.01 (two-tailed tests).
6. Conclusion
This paper provides partial answer to the puzzling question of why FDI induces significant economic growth in only some autocratic host countries. Our findings suggest that political determinants of FDI-led growth are heterogeneous depending on autocratic leadership time horizons. Autocrats with relatively long-time horizons, compared with more predatory and short-sighted autocrats, are found to utilize FDI inflows more productively and efficiently for economic development. An implication is that autocratic host countries that appear to have an aggressive policy of inviting FDI are not always committed to taking advantage of positive spillovers for economic development. Rather, myopic autocrats may be more interested in lucrative rent-seeking opportunities that FDI brings to the host government.
In particular, our finding that FDI has a negative effect on growth in host countries with short leadership time horizons indicates that foreign investors should not take it for granted that much-needed foreign capital is always a blessing for host countries' economic development. Only those countries with economic preconditions conducive to FDI-led growth may benefit. This paper emphasizes that these promotive economic conditions are likely to be observed in autocratic countries with relatively long leadership time horizons.
Given FDI's role as one of the most vibrant economic engines of growth over the past few decades, the mixed findings about its growth-accelerating effect have been puzzling. Our findings indicate that FDI is not a panacea for the problems faced by sluggish and depressed authoritarian economies. Particularly in autocracies, political leadership with significant discretion over economic policy is likely to exert influence on how FDI contracts are made and how potential positive spillovers are distributed to domestic economic actors. Thus, this paper highlights the importance of autocratic leaders' policy preferences shaped by their time horizons, demonstrating that self-interested autocrats with long-time horizons are more committed to promoting positive FDI spillovers and long-run economic productivity.
Acknowledgments
For helpful comments, we are grateful to Joseph Wright, Hoon Lee, and Toby Rider, as well as the editor and anonymous reviewers of JJPS. This work was supported by the National Research Foundation of Korea funded by the Korean Minstry of Education (NRF-2016-S1A3A2924409) and Chung-Ang University Research Grants in 2018.
Supplementary material
The supplementary material for this article can be found at https://dataverse.harvard.edu/dataset.xhtml?persistentId=doi:10.7910/DVN/3DWMM6.
Daehee Bak is an assistant professor of Political Science at Texas Tech University. He is interested in examining the linkage between leadership tenure and survival on the one hand, and interstate conflict and international political economy on the other hand, especially focusing on leaders' foreign policy incentives and domestic constraints across different regime types.
Chungshik Moon is an assistant professor of Political Science and International Relations at Chung-Ang University. His research deals with the interactions between domestic and international institutions, with particular interest in the politics of international investment, development and authoritarian regimes.
Appendix
Summary statistics

Effect of FDI on economic growth: OLS with initial GDPpc

Autocratic time horizon

Root mean squared error depending on number of lags

Effect of FDI on economic growth: bootstrapping

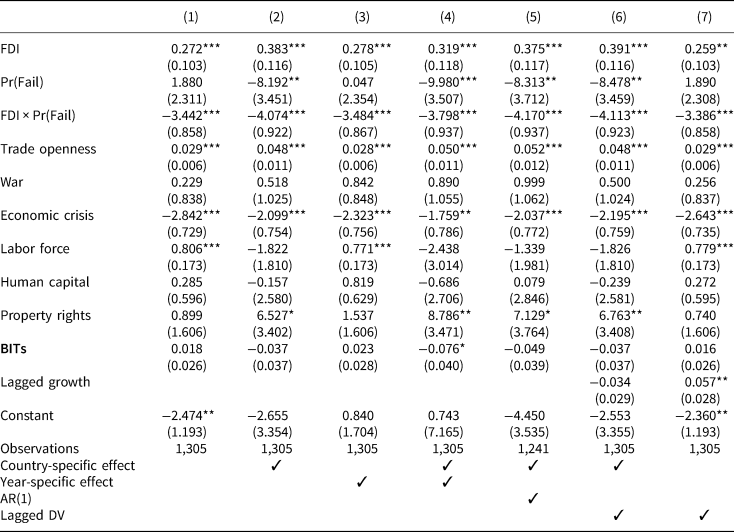
Effect of FDI on economic growth: controlling for BITs