



1 Introduction
Research on flows in pipes, channels and boundary-layer flows are areas of much recent activity. Of particular interest are travelling wave (TW) states at large Reynolds number
 $R$
in channel (Nagata Reference Nagata1990; Waleffe Reference Waleffe1995, Reference Waleffe1997, Reference Waleffe1998, Reference Waleffe2001, Reference Waleffe2003; Wang, Gibson & Waleffe Reference Wang, Gibson and Waleffe2007; Gibson, Halcrow & Cvitanovic Reference Gibson, Halcrow and Cvitanovic2009; Blackburn, Hall & Sherwin Reference Blackburn, Hall and Sherwin2013) and pipe geometries (Faisst & Eckhardt Reference Faisst and Eckhardt2003; Fitzerald Reference Fitzerald2004; Hof et al.
Reference Hof, van Doorne, Westerweel, Nieuwstadt, Faisst, Eckhardt, Wedin, Kerswell and Waleffe2004; Wedin & Kerswell Reference Wedin and Kerswell2004; Kerswell & Tutty Reference Kerswell and Tutty2007; Pringle & Kerswell Reference Pringle and Kerswell2007; Viswanath Reference Viswanath2007) with different degrees of symmetry. These states do not arise from finite
 $R$
bifurcation of plane Couette or Hagen–Poiseuille flow in a pipe, though they come increasingly close as
 $R\rightarrow \infty$
. Nonetheless, the existence and stability of these states, and their connection in phase space, play important roles in understanding both transition and large
 $R$
behaviour of channel and pipe flows. There is also some evidence to suggest that these vortex wave interacting (VWI) states are edge states (Schneider & Eckhardt Reference Schneider and Eckhardt2009) for large Reynolds numbers in the sense that they separate the initial conditions in phase space between those that return to laminar flow from those that do not. Furthermore, when the unstable manifold of these states are low dimensional and slow, as suggested by earlier numerical calculations (Viswanath & Cvitanovic Reference Viswanath and Cvitanovic2009) of one of these states in pipe geometry, they correspond to coherent flows that are experimentally observable (Hof et al.
Reference Hof, van Doorne, Westerweel, Nieuwstadt, Faisst, Eckhardt, Wedin, Kerswell and Waleffe2004) in intermediate
 $R$
turbulence with the flow drifting slowly from one TW state to another. These nonlinear TW states are also of potential technological importance if suitable controls can be inserted to stabilize a coherent state with a significantly smaller drag than an uncontrolled turbulent flow.
The physical mechanism to sustain such steady states for large Reynolds number is now well understood. In the context of pipe flow, if we use cylindrical coordinates
 $(r,{\it\theta},z)$
with the cylinder axis aligned along the
 $z$
-axis, and non-dimensionalization with a domain corresponding to
 $r<1$
, the nonlinear states are Navier–Stokes travelling wave solutions of the form
 $$\begin{eqnarray}\boldsymbol{u}=\boldsymbol{v}_{P}(r)+\boldsymbol{U}(r,{\it\theta})+\boldsymbol{v}_{w}(r,{\it\theta},z-ct),\end{eqnarray}$$
where
 $\boldsymbol{v}_{P}(r)=(1-r^{2})\hat{\boldsymbol{z}}$
is Hagen–Poiseuille flow, and
 $\boldsymbol{v}_{w}$
is
 $2{\rm\pi}$
periodic in both
 ${\it\theta}$
and in
 $\tilde{z}:={\it\alpha}(z-ct)$
, with zero axial average over a period, denoted by
 $\langle \boldsymbol{v}_{w}\rangle =0$
. If we write
 $\boldsymbol{U}(r,{\it\theta})=(U(r,{\it\theta}),V(r,{\it\theta}),W(r,{\it\theta}))$
in cylindrical coordinates,
 $(U(r,{\it\theta}),V(r,{\it\theta}),0)$
is referred to as the roll part of the flow and represents streamwise vortices;
 $(0,0,W(r,{\it\theta}))$
is termed the streak while
 $\boldsymbol{v}_{w}(r,{\it\theta},z-ct)$
represents the wave part of the flow. A similar decomposition is possible for Couette flow and indeed for any predominantly unidirectional shear flow. In a boundary-layer study by Hall & Smith (Reference Hall and Smith1991) for large Reynolds number
 $R$
, it was for the first time recognized in a general shear flow context that an
 $O(R^{-1})$
streamwise perturbation vorticity can produce an
 $O(1)$
streak, thereby significantly altering the linear stability features of unperturbed flow, and that neutrally stable small-amplitude waves of the right magnitude through Reynolds stresses can sustain
 $O(R^{-1})$
streamwise vortices, which otherwise would have decayed in time. This is exactly the same self-sustaining process (SSP) discovered numerically later for channel (Waleffe Reference Waleffe1995, Reference Waleffe1997) and pipe flows (Faisst & Eckhardt Reference Faisst and Eckhardt2003; Wedin & Kerswell Reference Wedin and Kerswell2004).
The amplitudes of the rolls, streaks and waves have to be of just the right size to sustain this three way interaction between rolls, streaks and waves. This three way interaction has been described completely for channel flows asymptotically by Hall & Sherwin (Reference Hall and Sherwin2010) through numerical solutions of the rescaled parameter-free equations, and remarkable agreement found with direct numerical calculations (Wang et al.
Reference Wang, Gibson and Waleffe2007; Blackburn et al.
Reference Blackburn, Hall and Sherwin2013) even at moderate
 $R$
. Following Waleffe (Reference Waleffe1997), these states have been called SSP states in most of literature; we prefer to call them the VWI (vortex–wave interaction) states as it is descriptive of the physical mechanism that sustains such flows, as discovered originally by Hall & Smith (Reference Hall and Smith1991). As described by large
 $R$
asymptotics by Hall & Sherwin (Reference Hall and Sherwin2010), VWI states are characterized by small-amplitude linear waves driving the rolls through Reynolds stress. Another possibility for travelling waves is the occurrence of a fully nonlinear viscous core (NVC) similar to the one observed earlier in boundary-layer flows by Deguchi & Hall (Reference Deguchi and Hall2014a
). While NVC states are also characterized by a three-way interaction, as previously mentioned, there is no meaningful separation in scales between rolls, streaks and waves in this case, and the interaction between different axial wavenumber components is fully nonlinear as
 $R\rightarrow \infty$
, unlike the VWI states. We will use the terminology of TW to describe both VWI and NVC states.
This paper concerns primarily the calculation of two new TW solutions, called
 $C1$
and
 $C2$
, that collapse towards the centre of the pipe as
 $R\rightarrow \infty$
, which we identify as NVC states. Despite localization of rolls and waves over a shrinking core at the centre of the pipe, the streaks do not decay and remain the same size outside as inside the core, until wall effects become important. We also present scaling arguments to identify in general the asymptotic structure of the travelling wave solution as
 $R\rightarrow \infty$
for which the axial wavelength
 ${\it\alpha}$
is independent of
 $R$
. We also confirm that the so-called
 $S$
-antisymmetric state calculated in a pipe by Viswanath (Reference Viswanath2009) is a VWI state with scales in agreement with expected asymptotics. Instead of following previous approaches and trying to use numerical continuation of some fictitious forcing to determine a suitable initial guess for our Newton iteration procedure, which need not always result in convergence, we perturb the base Hagen–Poiseuille flow by introducing azimuthal suction–injection of small magnitude that is enough to cause instability of the base flow at large
 $R$
. Using the solution from the resulting Hopf-bifurcation as an initial guess for small-amplitude waves, we continue in wave amplitude before turning off the suction–injection. Our calculations, we believe, are also reasonably efficient and accurate and are valid at very large
 $R$
; this is helped by exploiting asymptotic scalings of wave amplitudes in the choice of preconditioners needed to solve the large linear systems of equations arising in Newton iteration.
The TW solutions we are looking for satisfy the Navier–Stokes equations
 $$\begin{eqnarray}\boldsymbol{u}_{t}+\boldsymbol{u}\boldsymbol{\cdot }\boldsymbol{{\rm\nabla}}\boldsymbol{u}=-\boldsymbol{{\rm\nabla}}p+\frac{1}{R}{\rm\Delta}\boldsymbol{u},\quad \boldsymbol{{\rm\nabla}}\boldsymbol{\cdot }\boldsymbol{u}=0\end{eqnarray}$$
in the form
 $$\begin{eqnarray}\boldsymbol{u}=\boldsymbol{v}_{B}(r,{\it\theta})+\boldsymbol{v}(r,{\it\theta},z-ct),\end{eqnarray}$$
where
 $\boldsymbol{v}_{B}$
is the base flow, while
 $(r,{\it\theta},z)$
are cylindrical coordinates with the pipe aligned along the
 $z$
-axis. We assume
 $\boldsymbol{v}$
to be
 $2{\rm\pi}$
periodic in
 ${\it\theta}$
and
 $\tilde{z}:={\it\alpha}(z-ct)$
and satisfies boundary condition on the wall
 $$\begin{eqnarray}\boldsymbol{v}(1,{\it\theta},z-ct)=0.\end{eqnarray}$$
We take the base flow
 $\boldsymbol{v}_{B}=\boldsymbol{v}_{B}(r,{\it\theta})$
to be the steady Navier–Stokes solution with only non-zero radial and azimuthal components satisfying a periodic suction–injection boundary condition at the wall:
 $$\begin{eqnarray}\boldsymbol{v}_{B}(1,{\it\theta})=\frac{s}{R}\cos (k_{0}{\it\theta})\hat{\boldsymbol{r}}\end{eqnarray}$$
with the same average pressure gradient
 $-4/R\hat{\boldsymbol{z}}$
as for Hagen–Poiseuille flow
 $\boldsymbol{v}_{P}=(1-r^{2})\hat{\boldsymbol{z}}$
.
Solutions to (1.2) in the form (1.3) have been computed before for
 $s=0$
, i.e. when
 $\boldsymbol{v}_{B}=\boldsymbol{v}_{P}$
, through an initial guess determination procedure (Wedin & Kerswell Reference Wedin and Kerswell2004) that mimics the three-way interaction between rolls, streaks and waves and/or introduction of forcing (Faisst & Eckhardt Reference Faisst and Eckhardt2003). Our procedure is different; we first study the linear stability of the base flow
 $\boldsymbol{v}_{B}$
for
 $s\neq 0$
and determine
 $({\it\alpha},R)$
at which the flow becomes unstable. A finite-amplitude solution from a Hopf bifurcation at a neutrally stable point is then used to determine the initial guess in the Newton iteration procedure for travelling wave solutions in the form (1.3); at finite wave amplitude far from the bifurcation point, the solution is then continued to
 $s=0$
to determine a TW state without suction/injection. We used this to recalculate the TW states of Wedin & Kerswell (Reference Wedin and Kerswell2004) in a more efficient manner. We also find new states, which we later identify as finite
 $R$
realizations of NVC asymptotic states, that are concentrated in the centre of the pipe as
 $R\rightarrow \infty$
. We make no attempt to determine all possible TW states numerically; we focus mainly on the properties of these new centre modes that are concentrated at the centre of the pipe. Investigation of the scaling properties of these states, both numerically and through asymptotic arguments, constitutes the most significant part of this paper. We also present more general arguments to identify all possible consistent
 $R\rightarrow \infty$
asymptotic scalings of roll, streak and wave components of a TW state when the axial wavenumber
 ${\it\alpha}$
is independent of
 $R$
. It is to be noted that these states differ from the spiralling centre modes of Smith & Bodonyi (Reference Smith and Bodonyi1982) and Deguchi & Walton (Reference Deguchi and Walton2013).
2 Computational method
Our computational method is based on Galerkin truncation in Fourier modes in
 ${\it\theta}$
and
 $z-ct$
and a Chebyshev representation in
 $r$
similar to Wedin & Kerswell (Reference Wedin and Kerswell2004) which automatically accounts for the boundary condition. However, we found it more efficient to eliminate pressure using the Poisson equation. In the following subsections, we give some details.
2.1 Basic state calculation
For the basic state calculation for
 $s\neq 0$
, we find it convenient to decompose
 $$\begin{eqnarray}\boldsymbol{v}_{B}=\boldsymbol{g}_{S}+\boldsymbol{v}_{S},\end{eqnarray}$$
where
 $$\begin{eqnarray}\boldsymbol{g}_{S}=\frac{s}{R}\left(r(2-r^{2})\cos (k_{0}{\it\theta}),-\frac{4}{k_{0}}r(1-r^{2})\sin (k_{0}{\it\theta}),0\right)\end{eqnarray}$$
is a smooth divergence-free function chosen to satisfy the boundary condition at the wall, which allows
 $\boldsymbol{v}_{S}=(u_{S}(r,{\it\theta}),v_{S}(r,{\it\theta}),w_{S}(r,{\it\theta}))$
to have the similar truncated basis representation as TW states:
 $$\begin{eqnarray}\left(\begin{array}{@{}c@{}}u_{S}\\ v_{S}\\ w_{S}\end{array}\right)=\left(\begin{array}{@{}c@{}}0\\ 0\\ 1-r^{2}\end{array}\right)+\mathop{\sum }_{\substack{ 0\leqslant j\leqslant N \\ 0\leqslant k\leqslant M}}\left(\begin{array}{@{}c@{}}u_{jk}{\it\Phi}_{j}(r;kk_{0})\cos kk_{0}{\it\theta}\\ v_{jk}{\it\Phi}_{j}(r;kk_{0})\sin kk_{0}{\it\theta}\\ w_{jk}{\it\Psi}_{j}(r;kk_{0})\cos kk_{0}{\it\theta}\end{array}\right),\end{eqnarray}$$
where
 ${\it\Phi}_{j}$
,
 ${\it\Psi}_{j}$
is given in terms of Tchebyshev polynomials
 $T_{j}$
as follows:
 $$\begin{eqnarray}\displaystyle & {\it\Phi}_{j}(r;k)=\left\{\begin{array}{@{}ll@{}}T_{2j+2}(r)-T_{2j}(r)\quad & \text{for }k\text{ odd},\\ T_{2j+3}(r)-T_{2j+1}(r)\quad & \text{for }k\text{ even}\end{array}\right. & \displaystyle\end{eqnarray}$$
 $$\begin{eqnarray}\displaystyle & {\it\Psi}_{j}(r;k)=\left\{\begin{array}{@{}ll@{}}T_{2j+3}(r)-T_{2j+1}(r)\quad & \text{for }k\text{ odd},\\ T_{2j+2}(r)-T_{2j}(r)\quad & \text{for }k\text{ even}.\end{array}\right. & \displaystyle\end{eqnarray}$$
We decompose
 $p_{S}=-4z/R+q_{S}$
where
 $q_{S}$
satisfies the Poisson equation
 $$\begin{eqnarray}{\rm\Delta}q_{S}=-\boldsymbol{{\rm\nabla}}\boldsymbol{\cdot }(\boldsymbol{v}_{S}\boldsymbol{\cdot }\boldsymbol{{\rm\nabla}}\boldsymbol{v}_{S}+\boldsymbol{g}_{S}\boldsymbol{\cdot }\boldsymbol{{\rm\nabla}}\boldsymbol{v}_{S}+\boldsymbol{v}_{S}\boldsymbol{\cdot }\boldsymbol{{\rm\nabla}}\boldsymbol{g}_{S}+\boldsymbol{f}_{S}):=\mathscr{N}[\boldsymbol{v}_{s}],\end{eqnarray}$$
subject to compatible Neumann boundary conditions at
 $r=1$
:
 $$\begin{eqnarray}\frac{\partial q_{S}}{\partial r}=\hat{\boldsymbol{r}}\boldsymbol{\cdot }\left(\frac{1}{R}{\rm\Delta}\boldsymbol{v}_{s}-\boldsymbol{f}_{S}\right),\end{eqnarray}$$
where
 $$\begin{eqnarray}\boldsymbol{f}_{S}=-\frac{1}{R}{\rm\Delta}\boldsymbol{g}_{S}+\boldsymbol{g}_{S}\boldsymbol{\cdot }\boldsymbol{{\rm\nabla}}\boldsymbol{g}_{S}.\end{eqnarray}$$
We solve (2.6) with the boundary condition (2.7) (see Ozcakir (Reference Ozcakir2014) for details). This allows computation of
 $-\boldsymbol{{\rm\nabla}}q_{S}=-\boldsymbol{{\rm\nabla}}{\it\Delta}^{-1}\mathscr{N}[\boldsymbol{v}_{S}]$
for given
 $\boldsymbol{v}_{S}$
in the following equation:
 $$\begin{eqnarray}\boldsymbol{v}_{S}\boldsymbol{\cdot }\boldsymbol{{\rm\nabla}}\boldsymbol{v}_{S}+\boldsymbol{g}_{S}\boldsymbol{\cdot }\boldsymbol{{\rm\nabla}}\boldsymbol{v}_{S}+\boldsymbol{v}_{S}\boldsymbol{\cdot }\boldsymbol{{\rm\nabla}}\boldsymbol{g}_{S}=-\frac{4}{R}\hat{\boldsymbol{z}}-\boldsymbol{{\rm\nabla}}q_{S}+\frac{1}{R}{\rm\Delta}\boldsymbol{v}_{S}-\boldsymbol{f}_{S}.\end{eqnarray}$$
Using a Galerkin approximation
 $0\leqslant k\leqslant K$
in
 ${\it\theta}$
and collocation at the radial points
 $\{r_{j^{\prime }}\}_{j^{\prime }=0}^{N}$
we obtain a system of
 $3\times (K+1)\times (N+1)$
algebraic equations for as many unknowns
 $\{u_{k,j},v_{k,j},w_{k,j}\}_{k=0,\ldots ,K,j=0,\ldots ,N}$
that is solved through Newton iteration. The initial guess is obtained through a continuation process, starting at
 $s=0$
, when
 $\boldsymbol{v}_{S}=\boldsymbol{v}_{P}$
is an exact solution.
A similar representation was used for linear stability of the basic state (see Ozcakir Reference Ozcakir2014).
2.2 TW calculations
As mentioned in the introduction, TW states correspond to solutions of Navier–Stokes in the form
 $\boldsymbol{u}=\boldsymbol{v}_{B}(r,{\it\theta})+\boldsymbol{v}(r,{\it\theta},z-ct)$
where
 $c$
is now real. It is clear that
 $\boldsymbol{v}$
satisfies
 $$\begin{eqnarray}-\!c\frac{\partial \boldsymbol{v}}{\partial z}+(\boldsymbol{v}\boldsymbol{\cdot }\boldsymbol{{\rm\nabla}})\boldsymbol{v}=-\boldsymbol{{\rm\nabla}}{\it\Delta}^{-1}\mathscr{N}[\boldsymbol{v}]+\frac{1}{R}{\rm\Delta}\boldsymbol{v}-\boldsymbol{v}_{B}\boldsymbol{\cdot }\boldsymbol{{\rm\nabla}}\boldsymbol{v}_{B}-\boldsymbol{v}_{B}\boldsymbol{\cdot }\boldsymbol{{\rm\nabla}}\boldsymbol{v}-\boldsymbol{v}\boldsymbol{\cdot }\boldsymbol{{\rm\nabla}}\boldsymbol{v}_{B},\end{eqnarray}$$
where
 ${\it\Delta}^{-1}$
is defined with consistent Neumann boundary conditions
 $\mathscr{N}_{b}[\boldsymbol{v}]$
. (We make an implicit choice of the arbitrary constant arising in the Neumann problem in the choice of basis for
 ${\it\Delta}^{-1}\mathscr{N}[\boldsymbol{v}]$
; this choice is immaterial because of the
 $\boldsymbol{{\rm\nabla}}$
operator in (2.10).) Here, the operators
 $\mathscr{N}$
and
 $\mathscr{N}_{b}$
are defined as:
 $$\begin{eqnarray}\displaystyle & \mathscr{N}[\boldsymbol{v}]:=\boldsymbol{{\rm\nabla}}\boldsymbol{\cdot }[-\boldsymbol{v}_{B}\boldsymbol{\cdot }\boldsymbol{{\rm\nabla}}\boldsymbol{v}_{B}-\boldsymbol{v}_{B}\boldsymbol{\cdot }\boldsymbol{{\rm\nabla}}\boldsymbol{v}-\boldsymbol{v}\boldsymbol{\cdot }\boldsymbol{{\rm\nabla}}\boldsymbol{v}_{B}], & \displaystyle\end{eqnarray}$$
 $$\begin{eqnarray}\displaystyle & \displaystyle \mathscr{N}_{b}[\boldsymbol{v}]:=\hat{\boldsymbol{r}}\boldsymbol{\cdot }\left[\frac{1}{R}{\rm\Delta}\boldsymbol{v}-\boldsymbol{v}_{B}\boldsymbol{\cdot }\boldsymbol{{\rm\nabla}}\boldsymbol{v}_{B}-\boldsymbol{v}_{B}\boldsymbol{\cdot }\boldsymbol{{\rm\nabla}}\boldsymbol{v}-\boldsymbol{v}\boldsymbol{\cdot }\boldsymbol{{\rm\nabla}}\boldsymbol{v}_{B}\right]. & \displaystyle\end{eqnarray}$$
 $$\begin{eqnarray}\boldsymbol{v}(1,{\it\theta},z-ct)=0.\end{eqnarray}$$
Similar to Wedin & Kerswell (Reference Wedin and Kerswell2004), we use
 $$\begin{eqnarray}\displaystyle \left(\begin{array}{@{}c@{}}u\\ v\\ w\end{array}\right) & = & \displaystyle \mathop{\sum }_{\substack{ 0\leqslant j\leqslant N \\ 0\leqslant k\leqslant M \\ 0\leqslant l\,\mathit{even }\,\leqslant P}}\left(\begin{array}{@{}c@{}}(u_{jkl}^{(1)}\cos l\tilde{z}+u_{jkl}^{(2)}\sin l\tilde{z}){\it\Phi}_{j}(r;kk_{0})\cos kk_{0}{\it\theta}\\ (v_{jkl}^{(1)}\cos l\tilde{z}+v_{jkl}^{(2)}\sin l\tilde{z}){\it\Phi}_{j}(r;kk_{0})\sin kk_{0}{\it\theta}\\ (w_{jkl}^{(1)}\sin l\tilde{z}+w_{jkl}^{(2)}\cos l\tilde{z}){\it\Psi}_{j}(r;kk_{0})\cos kk_{0}{\it\theta}\end{array}\right)\nonumber\\ \displaystyle & & \displaystyle +\,\mathop{\sum }_{\substack{ 0\leqslant j\leqslant N \\ 0\leqslant k\leqslant M \\ 1\leqslant l\,\mathit{odd }\,\leqslant P}}\left(\begin{array}{@{}c@{}}(u_{jkl}^{(1)}\cos l\tilde{z}+u_{jkl}^{(2)}\sin l\tilde{z}){\it\Phi}_{j}(r;kk_{0})\sin kk_{0}{\it\theta}\\ (v_{jkl}^{(1)}\cos l\tilde{z}+v_{jkl}^{(2)}\sin l\tilde{z}){\it\Phi}_{j}(r;kk_{0})\cos kk_{0}{\it\theta}\\ (w_{jkl}^{(1)}\sin l\tilde{z}+w_{jkl}^{(2)}\cos l\tilde{z}){\it\Psi}_{j}(r;kk_{0})\sin kk_{0}{\it\theta}\end{array}\right).\end{eqnarray}$$
This is a basis representation suitable at
 $r=0$
for the so-called
 $S$
-symmetric states discussed in Wedin & Kerswell (Reference Wedin and Kerswell2004); note Viswanath & Cvitanovic (Reference Viswanath and Cvitanovic2009) calculates
 $S$
antisymmetric states which have a representation different from (2.13). (Though we did not explicitly impose the regularity condition at
 $r=0$
of Batchelor & Gill (Reference Batchelor and Gill1962), we checked that it was satisfied to a numerical accuracy sufficient for the reported calculation.) This representation fixes the origin in
 ${\it\theta}$
. In addition, to fix the origin in
 $z$
, we impose
 $$\begin{eqnarray}\mathop{\sum }_{j=0}^{N}u_{j,1,1}^{(1)}=0.\end{eqnarray}$$
We use representation (2.13) and equate coefficients of
 $\cos (kk_{0}{\it\theta})\cos (l\tilde{z})$
,
 $\sin (kk_{0}{\it\theta})\cos (l\tilde{z})$
,
 $\cos (kk_{0}{\it\theta})\sin (l\tilde{z})$
, and
 $\sin (kk_{0}{\it\theta})\sin (l\tilde{z})$
for
 $0\leqslant k\leqslant M$
,
 $0\leqslant l\leqslant P$
on both sides of (2.10) and evaluate the resulting expressions at the collocation points
 $\{r_{j^{\prime }}\}$
. This, together with the scalar equation (2.14), results in a nonlinear algebraic system for
 $(\boldsymbol{X},c)$
 $$\begin{eqnarray}\boldsymbol{G}(\boldsymbol{X},c;{\bf\beta})=0,\end{eqnarray}$$
where
 $\boldsymbol{X}=\{u_{jkl}^{(i)},v_{jkl}^{(i)},w_{jkl}^{(i)}\}_{j,k,l,i}$
and
 ${\bf\beta}=(R,{\it\alpha},s)$
are the set of specified parameters. More details about inversion of
 ${\it\Delta}^{-1}$
subject to Neumann conditions, calculation of the corresponding Jacobian
 $\boldsymbol{J}$
that arises in Newton iteration and its efficient inversion through use of a preconditioner and GMRES are described elsewhere (Ozcakir Reference Ozcakir2014). In the vicinity of neutral stability points
 ${\it\alpha}={\it\alpha}_{N}(R)$
, we use the eigenfunction at
 ${\it\alpha}={\it\alpha}_{N}$
of the stability problem summed with its complex conjugate, re-expressed in the real form (2.13) to determine a suitable initial guess for travelling wave calculations. Sufficiently far from the bifurcation point, we continue to
 $s\rightarrow 0$
to determine a TW state. Note that the azimuthal symmetry (
 $k_{0}=2$
) of the suction–injection profile is reflected in the ultimate symmetry of the travelling wave solutions. The matrix inversion process is similar to Viswanath (Reference Viswanath2009), though our choice of preconditioner exploits the knowledge (Hall & Sherwin Reference Hall and Sherwin2010) of weak nonlinear wave interaction for large
 $R$
.
3 Numerical results for TW calculations
The calculations described thus far are limited to
 $k_{0}=2$
; i.e. 2-fold azimuthally symmetric TW states. Unless otherwise stated, in our figures we used
 $(N,M,P)=(85,12,5)$
when
 $R>5000$
and
 $(N,M,P)=(45,8,5)$
when
 $R<5000$
. Significantly increasing each of
 $N$
,
 $M$
and
 $P$
for a particular Reynolds number in this range and comparing with the baseline calculations suggested that the calculation for
 $c$
was accurate to four significant digits, whereas the velocity was accurate to at least three digits. We display with cross marks results from a higher resolution calculation that resulted in the largest deviation from the baseline calculations shown by solid or dashed lines.
We reproduced the
 $S$
-symmetric solution of Wedin & Kerswell (Reference Wedin and Kerswell2004) for
 $k_{0}=2$
. The comparison of
 $c$
versus
 $R$
curve for
 ${\it\alpha}=1.55$
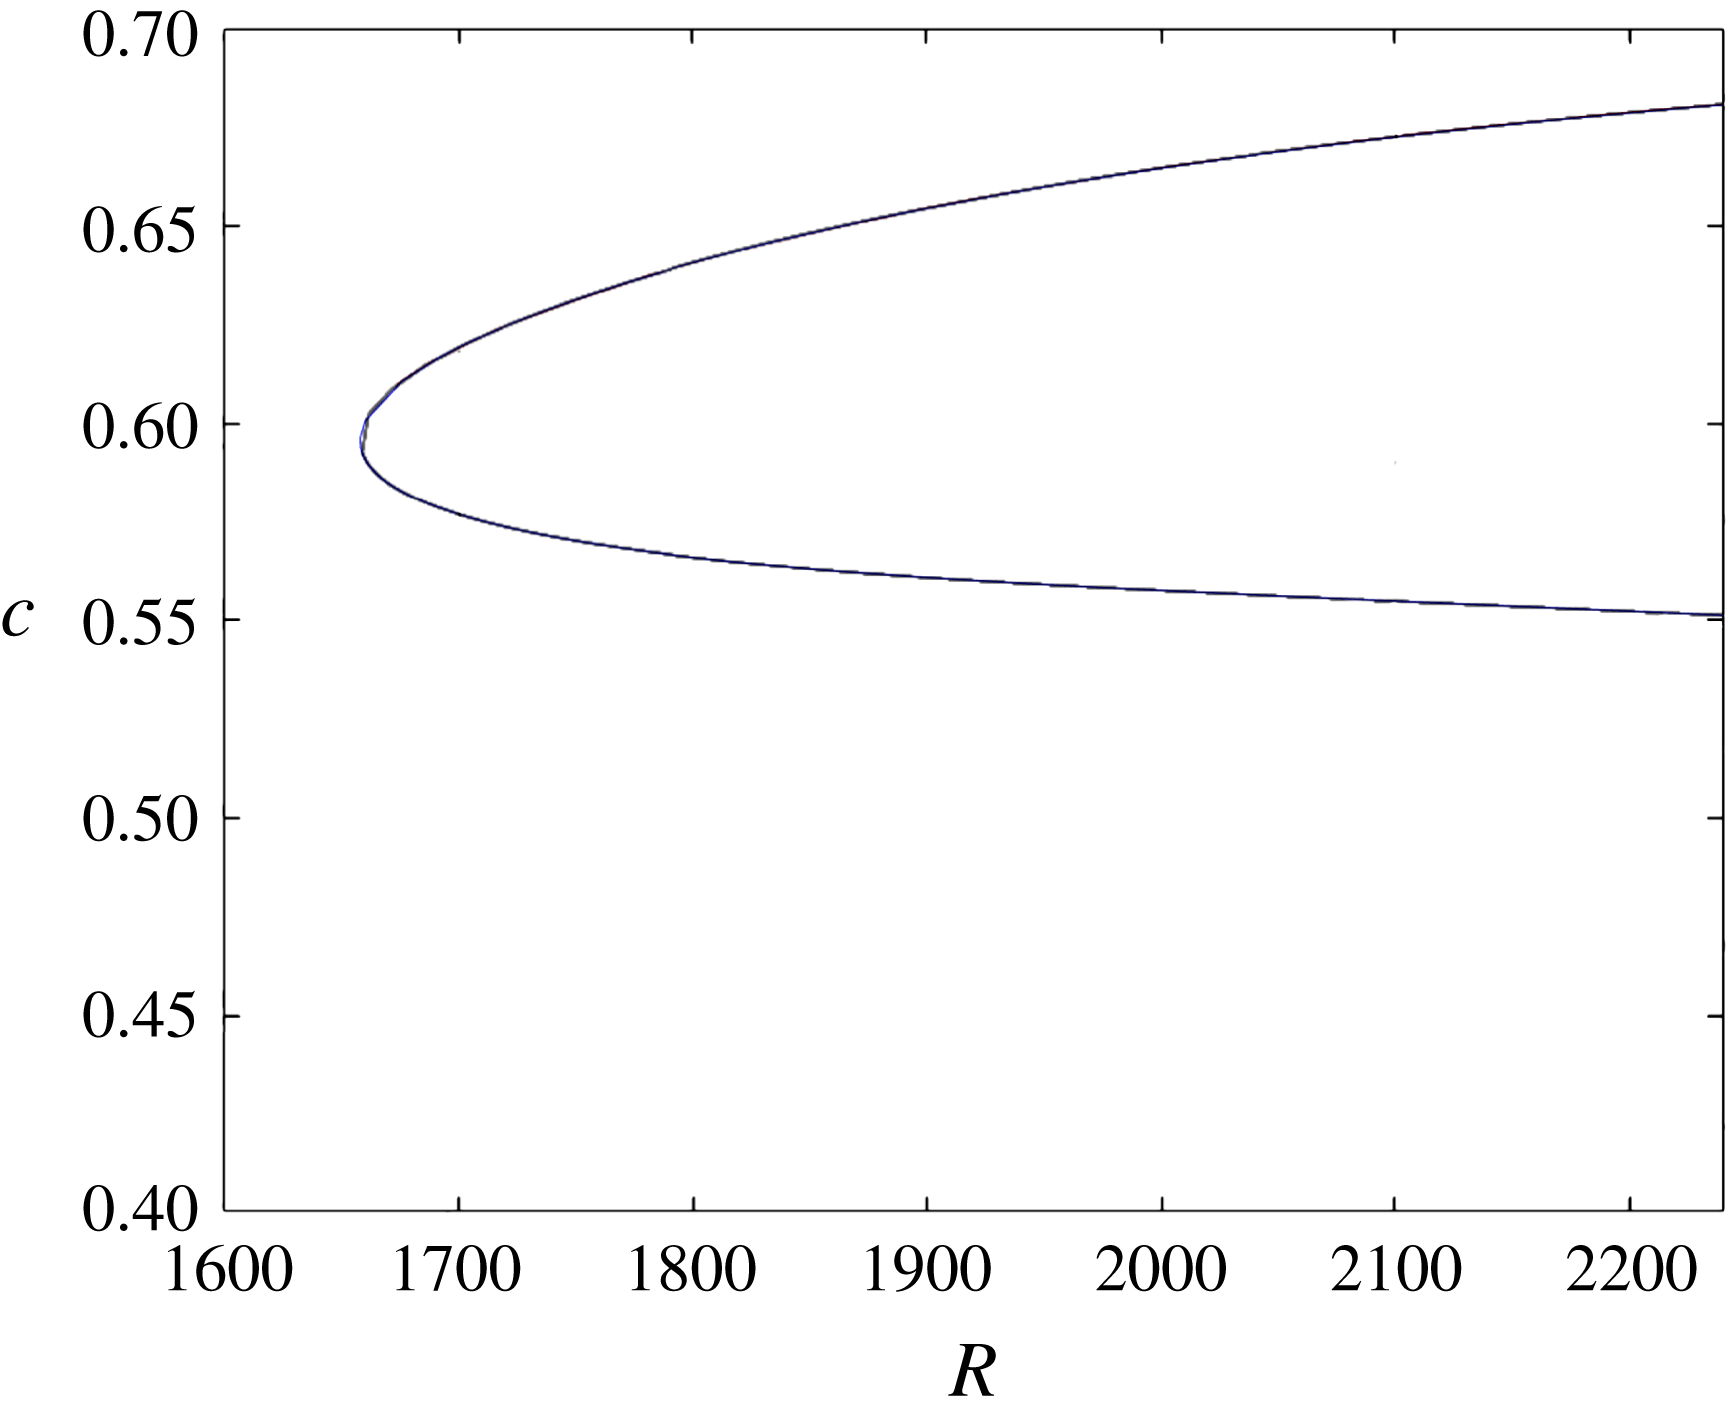
is shown in figure 1. Our calculations for
 $(N,M,P)=(45,8,5)$
(shown in blue) are indistinguishable from the grey curve of Wedin & Kerswell (Reference Wedin and Kerswell2004). The black curve, which sits on top of the blue curve, corresponds to higher resolution
 $(N,M,P)=(85,12,5)$
. More on comparisons with Wedin & Kerswell (Reference Wedin and Kerswell2004) appear in Ozcakir (Reference Ozcakir2014).
 $c$
versus
 $R$
for WK branch at
 ${\it\alpha}=1.55$
: grey curve: Wedin & Kerswell (Reference Wedin and Kerswell2004) calculations, blue curve: our
 $(N,M,P)=(45,8,5)$
calculations, black curve
 $(N,M,P)=(85,12,5)$
.
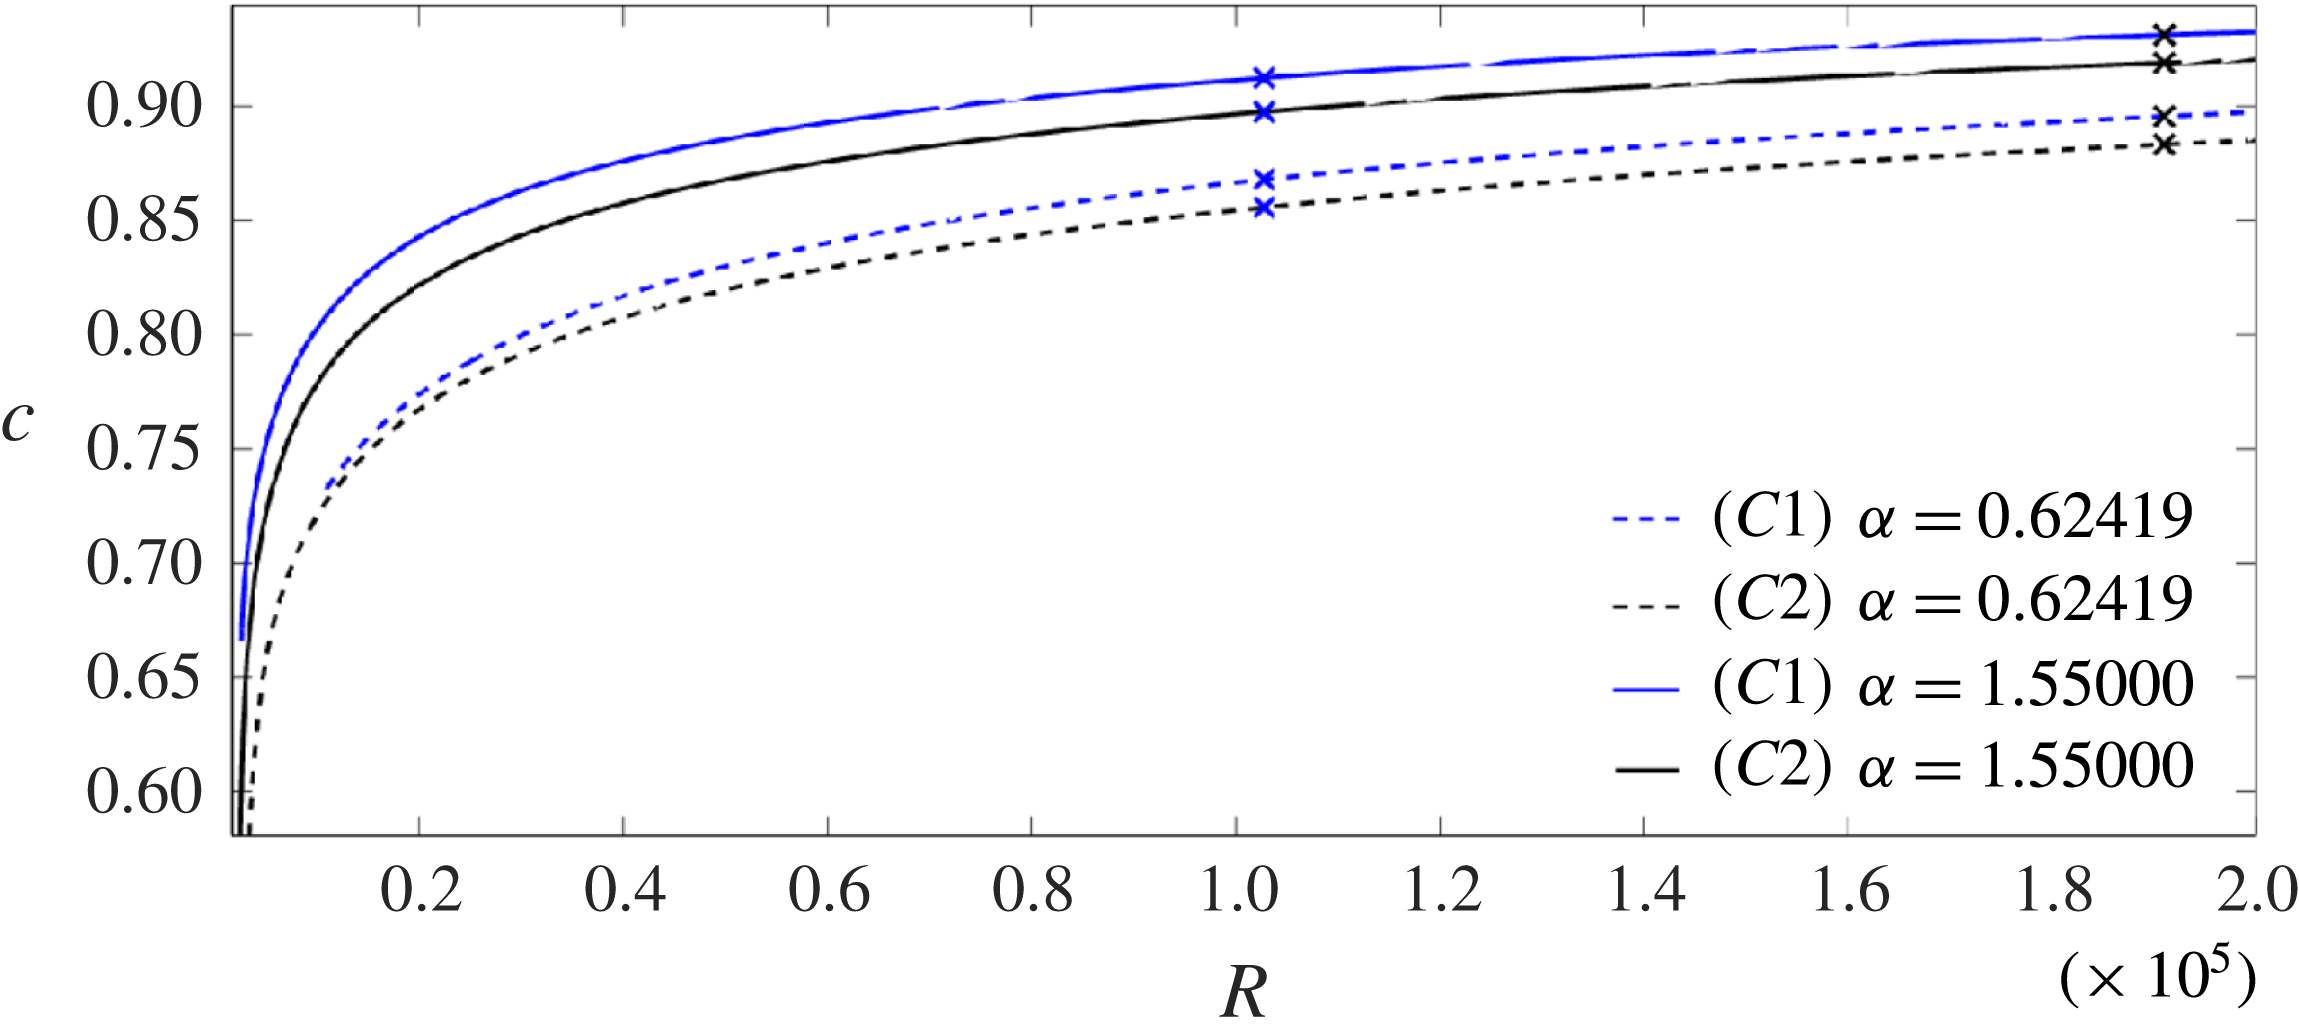
 $c$
versus
 $R$
for different solution branches
 $C1$
,
 $C2$
for different axial wavelength
 ${\it\alpha}$
.
The scaling of rolls, streaks and waves for the computed WK solutions are roughly in agreement with the expected VWI scales for
 ${\it\delta}=1$
(see § 4.2), which is the same as the Hall & Sherwin (Reference Hall and Sherwin2010) scaling in channel flows, though our inability to continue the WK solution past about
 $R=11\,000$
hampered a more precise comparison between numerical results and
 $R\rightarrow \infty$
scaling results.
In addition, two new branches of travelling wave solutions have been found, which we denote as
 $C1$
and
 $C2$
. Besides the
 $S$
-symmetry (shift-and-reflect) the
 $C2$
branch also has
 ${\it\Omega}_{2}$
-symmetry (shift-and-rotate) as defined in Pringle, Duguet & Kerswell (Reference Pringle, Duguet and Kerswell2009), though this additional symmetry was not imposed in the numerical code. As pointed out earlier, in the representation (2.13), this corresponds to non-zero contributions only for even
 $k+l$
. For
 $k_{0}=2$
, this results in rolls and streaks having 4-fold azimuthal symmetry.
However, unlike other states calculated before, these new branches appear to have a collapsing vortex–wave structure toward the centre of the pipe as
 $R\rightarrow \infty$
, which will be quantified. These states are also different from the helical centre modes of Smith & Bodonyi (Reference Smith and Bodonyi1982) (confirmed for finite
 $R$
by Deguchi & Walton Reference Deguchi and Walton2013) where the dependence in
 ${\it\theta}$
and
 $z$
are linked; these spiral modes are special to
 $k_{0}=1$
. In figure 2 the phase speed
 $c$
is shown as a function of
 $R$
for the two wavenumbers
 ${\it\alpha}$
for
 $C1$
and
 $C2$
solutions for the lower branch. For
 $C1$
and
 $C2$
, we were able to compute solutions indefinitely with increasing
 $R$
, though resolution checks were limited to
 $R<2\times 10^{5}$
. In order to understand the asymptotic scaling of the new centre modes
 $C1$
and
 $C2$
, in figure 3,
 $1-c$
is plotted against
 $R$
on a log–log scale for large
 $R$
for two different values of
 ${\it\alpha}$
, with slopes
 $m$
ranging from
 $-0.32$
to
 $-0.38$
. This does not change much with higher resolution calculations shown by cross marks. In all the figures, slopes are quoted to two significant figures. A linear least square fit using data in the range
 $5\times 10^{4}<R<2\times 10^{5}$
is shown in dotted lines. We also noted that the slope in the regime
 $10^{5}<R<2\times 10^{5}$
is about three percent larger than the quoted value, suggesting that the solution may not have reached an ultimate asymptotic scale. Also, we noted a consistent tendency for the
 $1-c$
versus
 $R$
curve to steepen slightly with increasing
 ${\it\alpha}$
. For instance, the linear fit based on limited calculations for
 ${\it\alpha}=2.51$
in a large
 $R$
regime for the
 $C1$
solution shows
 $(1-c)\sim R^{-0.39}$
. (The notation ‘
 ${\sim}$
’ here and in the rest of the paper is not in the usual asymptotic sense; instead it is to be interpreted as the scaling.)
 $1-c$
versus
 $R$
in a log–log scale for different
 ${\it\alpha}$
for
 $C1$
and
 $C2$
solutions. Dotted lines are linear approximations to each curve using larger
 $R$
.

Roll and streak profiles at
 $R=3940$
for
 ${\it\alpha}=1.55$
. (a)
 $C1$
; (b)
 $C2$
; (c) WK.

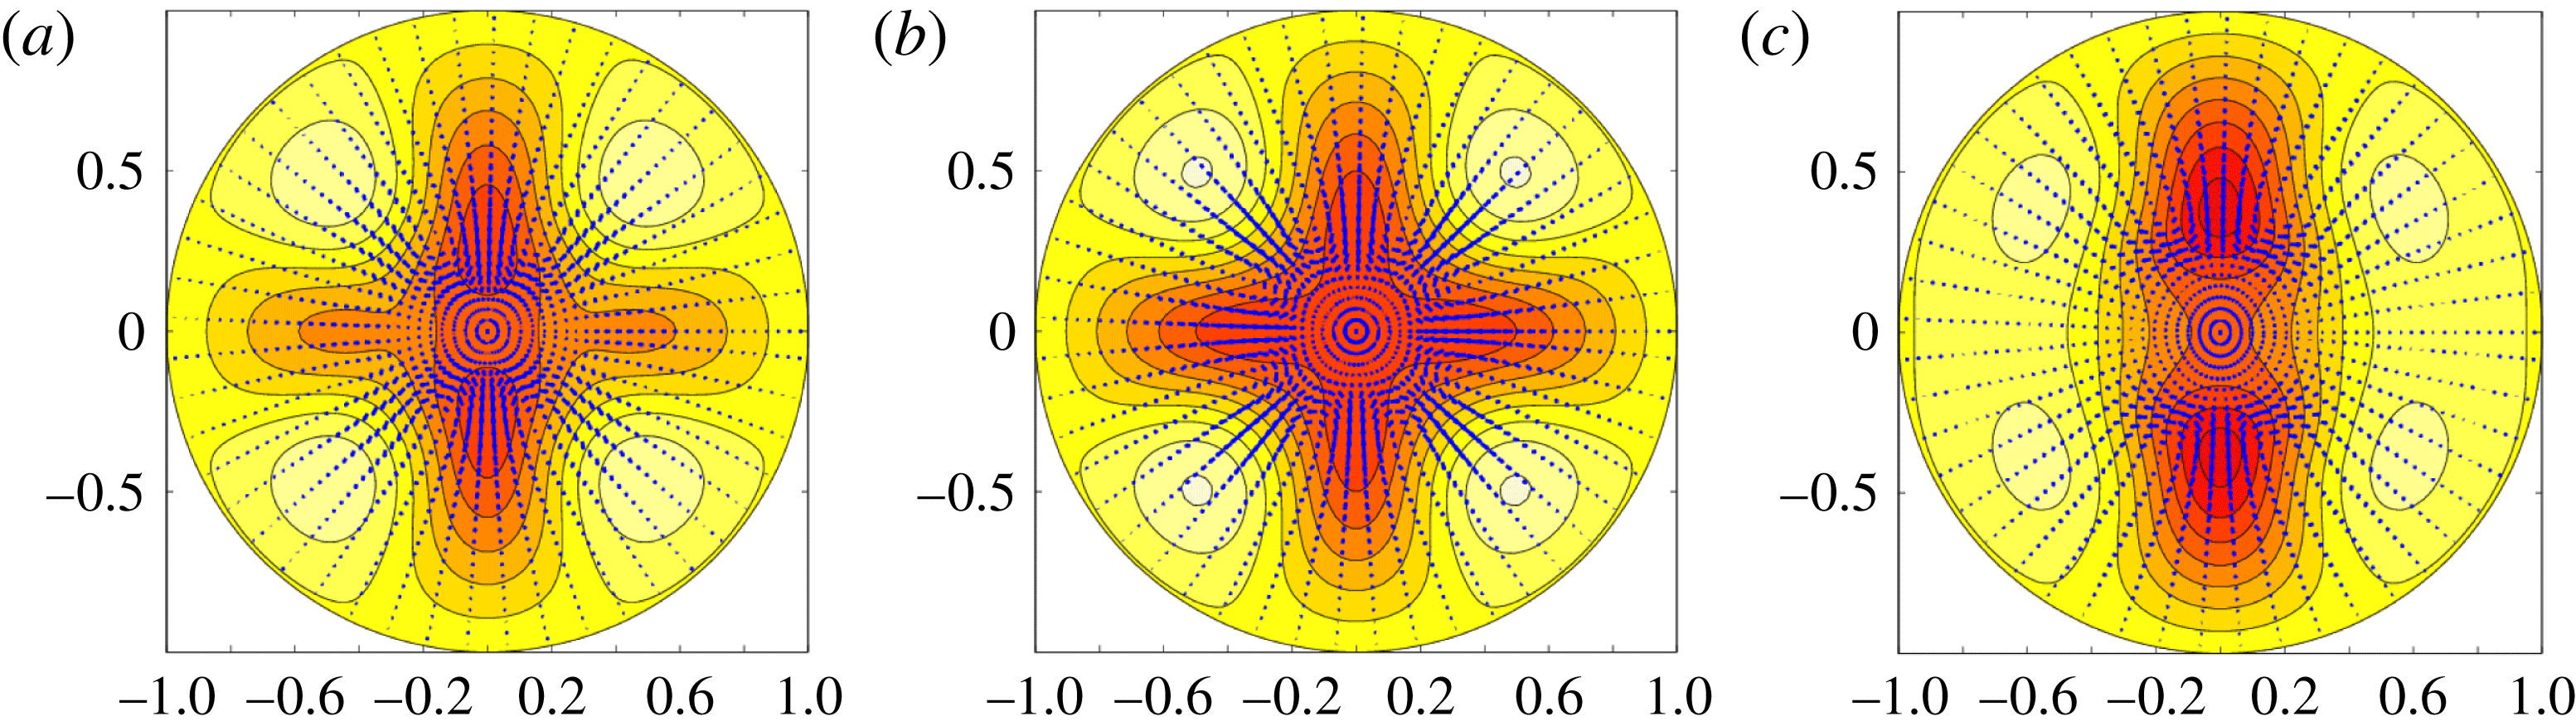
For these new states, the streamwise-averaged flows are displayed in a plane perpendicular to the pipe axis at several values of
 $R$
in figures 4–6 where the rolls
 $(U,V)$
are depicted using arrows whilst the streak velocity intensity is represented in colours, where the lighter colours correspond to positive values of streak
 $W$
, while darker colours correspond to negative
 $W$
. For comparison, we also present the WK solutions. (Note that Newton iteration failed to converge for the WK branch of solution for
 $R$
larger than about
 $11\,000$
, presumably because the solution approaches of a bifurcation point; this aspect was not pursued any further in this paper.) In all of the plots, the streak velocity ranges in the interval
 $[-0.4163,0.0963]$
. Note that the streaks get weaker as
 $R$
becomes larger, in accordance with asymptotic scaling results in § 4.
Roll and streak profiles at
 $R=10^{4}$
for
 ${\it\alpha}=1.55$
. (a)
 $C1$
; (b)
 $C2$
; (c) WK.
Roll and streak profiles at
 $R=10^{5}$
for
 ${\it\alpha}=1.55$
. (a)
 $C1$
; (b)
 $C2$
.

The grey surfaces in figures 7 and 8 show surfaces of constant magnitude of streamwise velocity, excluding Poiseuille, at a value of 0.8 times the maximal value for two different
 $R$
values for the
 $C2$
state for specific
 ${\it\alpha}=1.55$
. We observed similar patterns for other values of
 ${\it\alpha}$
and for the
 $C1$
state. The coloured surfaces in the corresponding figures denote iso-surfaces of 0.8 times the maximal or minimal streamwise vorticity, with blue corresponding to positive vorticity and red corresponding to negative vorticity. Note that while the vortex structures become closer to the origin with larger
 $R$
, the streamwise velocity magnitude iso-surface, which is dominated by the streak component, does not shrink noticeably towards the origin. This feature is explained theoretically in § 4.4 and owes its origin to the mechanism found by Deguchi & Hall (Reference Deguchi and Hall2014a
).
Streamwise velocity and vorticity iso-surfaces at 0.8 times extreme values at
 $R=50\,000$
for
 ${\it\alpha}=1.55$
for
 $C2$
.
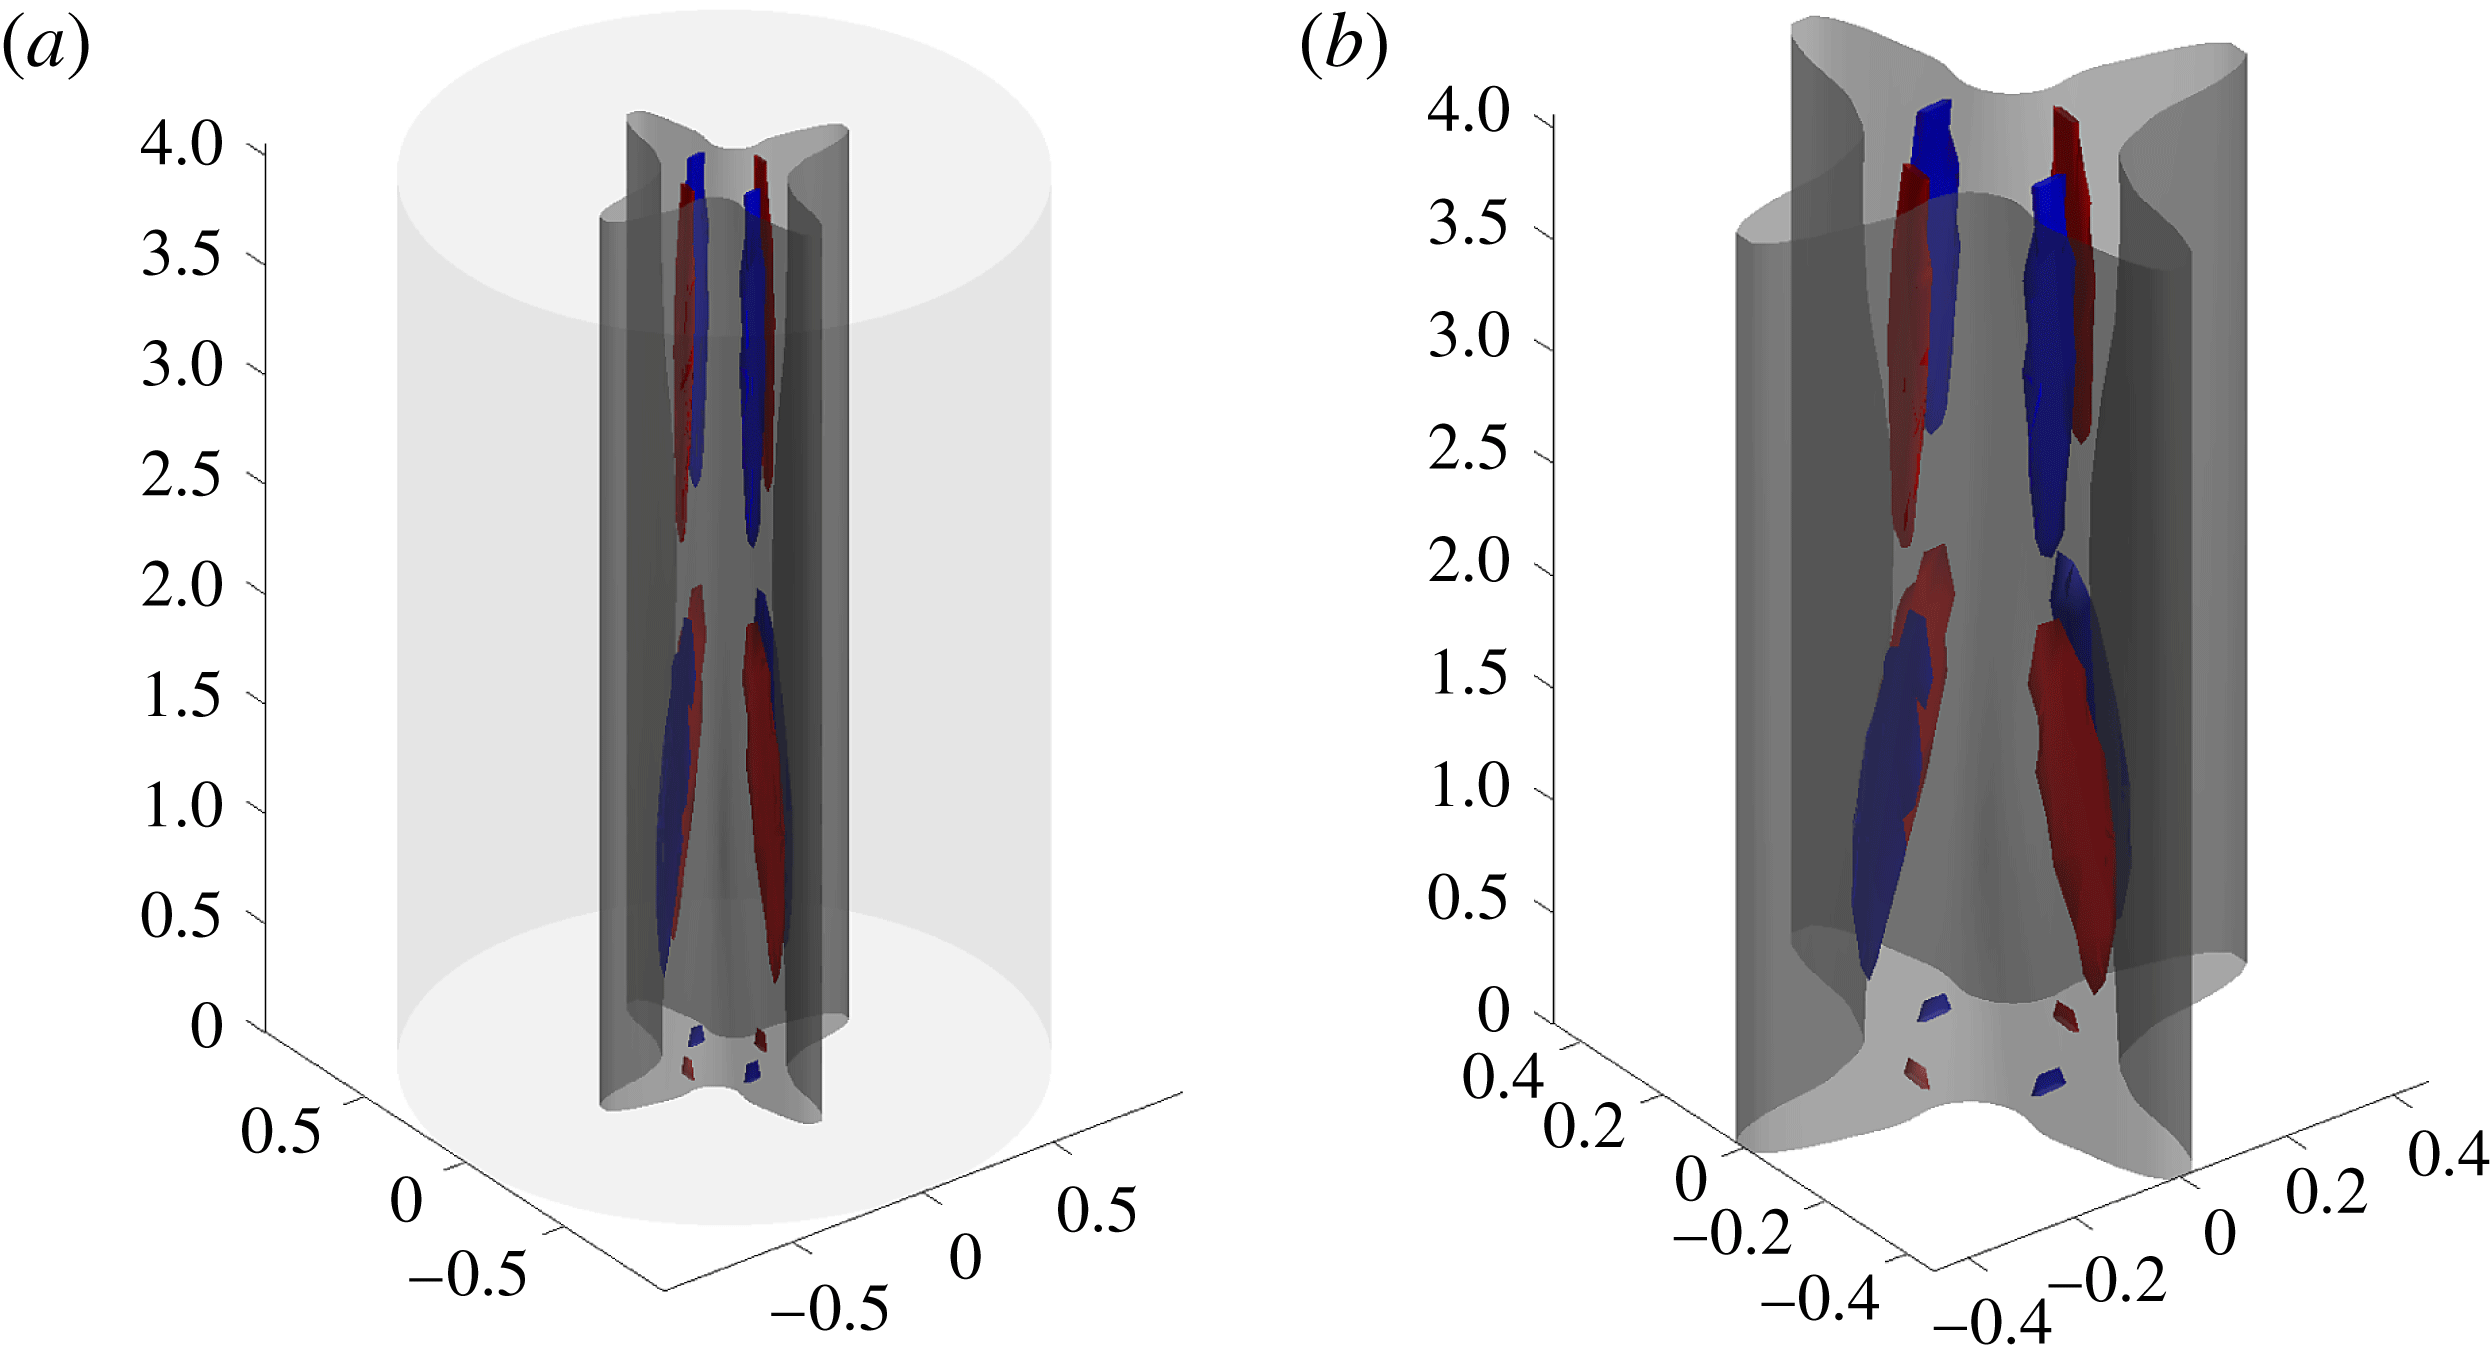
Streamwise velocity and vorticity iso-surfaces at 0.8 times extreme values at
 $R=191\,020$
for
 ${\it\alpha}=1.55$
for
 $C2$
.

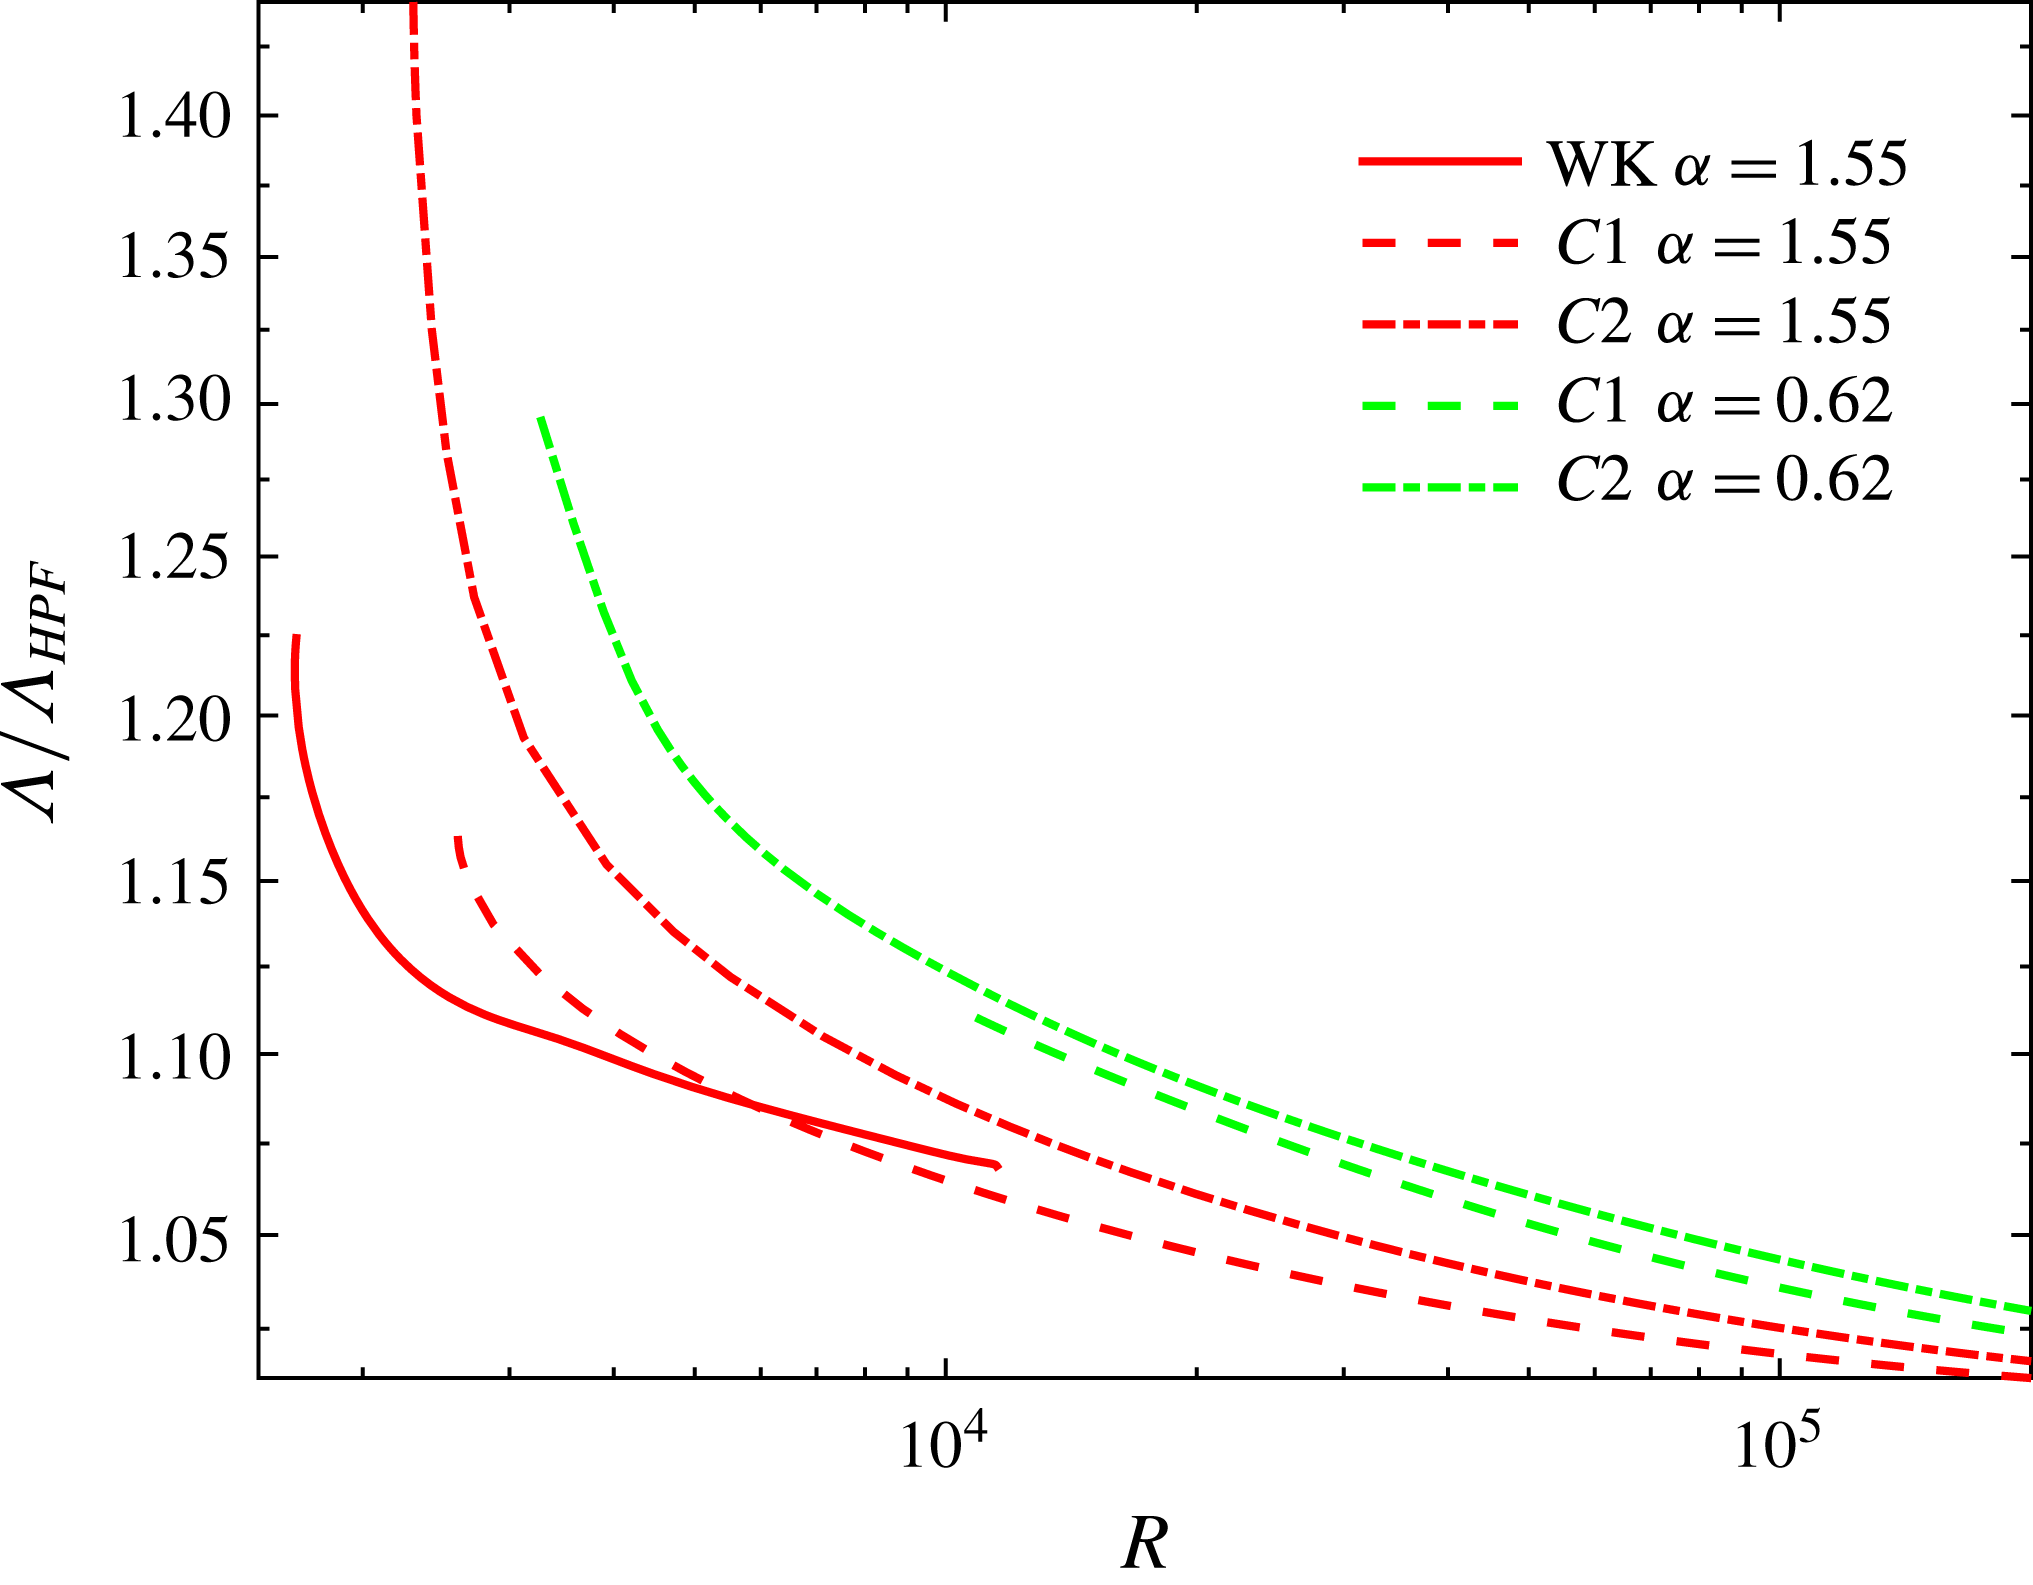
A quantity of general interest, which has some technological implications, is the friction factor
 ${\it\Lambda}$
associated with each of these states.
 ${\it\Lambda}$
is defined as
 $$\begin{eqnarray}{\it\Lambda}:=\frac{64R}{{R_{m}}^{2}},\quad \text{where }R_{m}:=2\overline{w}R\end{eqnarray}$$
and
 $\overline{w}$
is the non-dimensional mean streamwise velocity given by
 $$\begin{eqnarray}\overline{w}=2\int _{0}^{1}\left((1-r^{2})+\mathop{\sum }_{j=0}^{N}w_{j00}^{(2)}{\it\Psi}_{j}(r;0)\right)r\,\text{d}r\end{eqnarray}$$
 ${\it\Lambda}$
is plotted against
 $R$
for WK,
 $C1$
,
 $C2$
solutions for three different values of
 ${\it\alpha}$
and compared against the Hagen–Poiseuille value of
 $64/R$
in figure 9.
Friction factor ratio
 ${\it\Lambda}/{\it\Lambda}_{HPF}$
versus
 $R$
for lower branch WK,
 $C1$
and
 $C2$
solutions at
 ${\it\alpha}=1.55$
,
 ${\it\alpha}=0.624$
; note
 ${\it\Lambda}={\it\Lambda}_{HPF}=64/R$
for Hagen–Poiseuille flow.
Now we report on other scaling features of the
 $C1$
,
 $C2$
solutions for large
 $R$
, restricted to
 $R<2\times 10^{5}$
. These include the behaviour of rolls, streaks and waves, including the location and magnitude of their maximum. We will also consider the collapsing of these solutions towards the centre of the pipe. It is convenient to define
 $k$
th azimuthal-amplitude functions for rolls, streaks and waves and their maximums as follows:
 $$\begin{eqnarray}A_{k}^{U}(r)=\sqrt{\left(\mathop{\sum }_{n=0}^{N}u_{nk0}^{(1)}{\it\Phi}_{n}(r)\right)^{2}+\left(\mathop{\sum }_{n=0}^{N}u_{nk0}^{(2)}{\it\Phi}_{n}(r)\right)^{2}},\quad A_{k,m}^{U}:=\max _{r}A_{k}^{U}(r)=A_{k}^{U}(r_{m}),\end{eqnarray}$$
 $$\begin{eqnarray}A_{k}^{S}(r)=\sqrt{\left(\mathop{\sum }_{n=0}^{N}w_{nk0}^{(1)}{\it\Psi}_{n}(r)\right)^{2}+\left(\mathop{\sum }_{n=0}^{N}w_{nk0}^{(2)}{\it\Psi}_{n}(r)\right)^{2}},\quad A_{k,m}^{S}:=\max _{r}A_{k}^{S}(r)=A_{k}^{S}(r_{m}),\end{eqnarray}$$
 $$\begin{eqnarray}A_{l}^{w}(r,{\it\theta})=\sqrt{w_{l}^{(1)}(r,{\it\theta})^{2}+w_{l}^{(2)}(r,{\it\theta})^{2}},\end{eqnarray}$$
 $$\begin{eqnarray}A_{l}^{\bot }(r,{\it\theta})=\sqrt{u_{l}^{(1)}(r,{\it\theta})^{2}+v_{l}^{(1)}(r,{\it\theta})^{2}+u_{l}^{(2)}(r,{\it\theta})^{2}+v_{l}^{(2)}(r,{\it\theta})^{2}},\end{eqnarray}$$
where the
 $l$
th axial Fourier component of wave velocity is defined for
 $l$
even and odd as:
 $$\begin{eqnarray}\displaystyle \left(\begin{array}{@{}c@{}}u_{l}^{(i)}(r,{\it\theta})\\ v_{l}^{(i)}(r,{\it\theta})\\ w_{l}^{(i)}(r,{\it\theta})\\ \end{array}\right) & = & \displaystyle \mathop{\sum }_{\substack{ 0\leqslant j\leqslant N \\ 0\leqslant k\leqslant M}}\left(\begin{array}{@{}c@{}}u_{jkl}^{(i)}{\it\Phi}_{j}(r;kk_{0})\cos kk_{0}{\it\theta}\\ v_{jkl}^{(i)}{\it\Phi}_{j}(r;kk_{0})\sin kk_{0}{\it\theta}\\ w_{jkl}^{(i)}{\it\Psi}_{j}(r;kk_{0})\cos kk_{0}{\it\theta}\end{array}\right),\nonumber\\ \displaystyle & = & \displaystyle \mathop{\sum }_{\substack{ 0\leqslant j\leqslant N \\ 0\leqslant k\leqslant M}}\left(\begin{array}{@{}c@{}}u_{jkl}^{(i)}{\it\Phi}_{j}(r;kk_{0})\sin kk_{0}{\it\theta}\\ v_{jkl}^{(i)}{\it\Phi}_{j}(r;kk_{0})\cos kk_{0}{\it\theta}\\ w_{jkl}^{(i)}{\it\Psi}_{j}(r;kk_{0})\sin kk_{0}{\it\theta}\end{array}\right)\end{eqnarray}$$
 $$\begin{eqnarray}\displaystyle w_{k,l}(r) & = & \displaystyle \left\{\left(\mathop{\sum }_{j=0}^{N}w_{jkl}^{(1)}{\it\Psi}_{j}(r;kk_{0})\right)^{2}+\left(\mathop{\sum }_{j=0}^{N}w_{jkl}^{(2)}{\it\Psi}_{j}(r;kk_{0})\right)^{2}\right\}^{1/2},\end{eqnarray}$$
 $$\begin{eqnarray}\displaystyle w_{k,l,m} & = & \displaystyle \max _{r}w_{k,l}(r).\end{eqnarray}$$
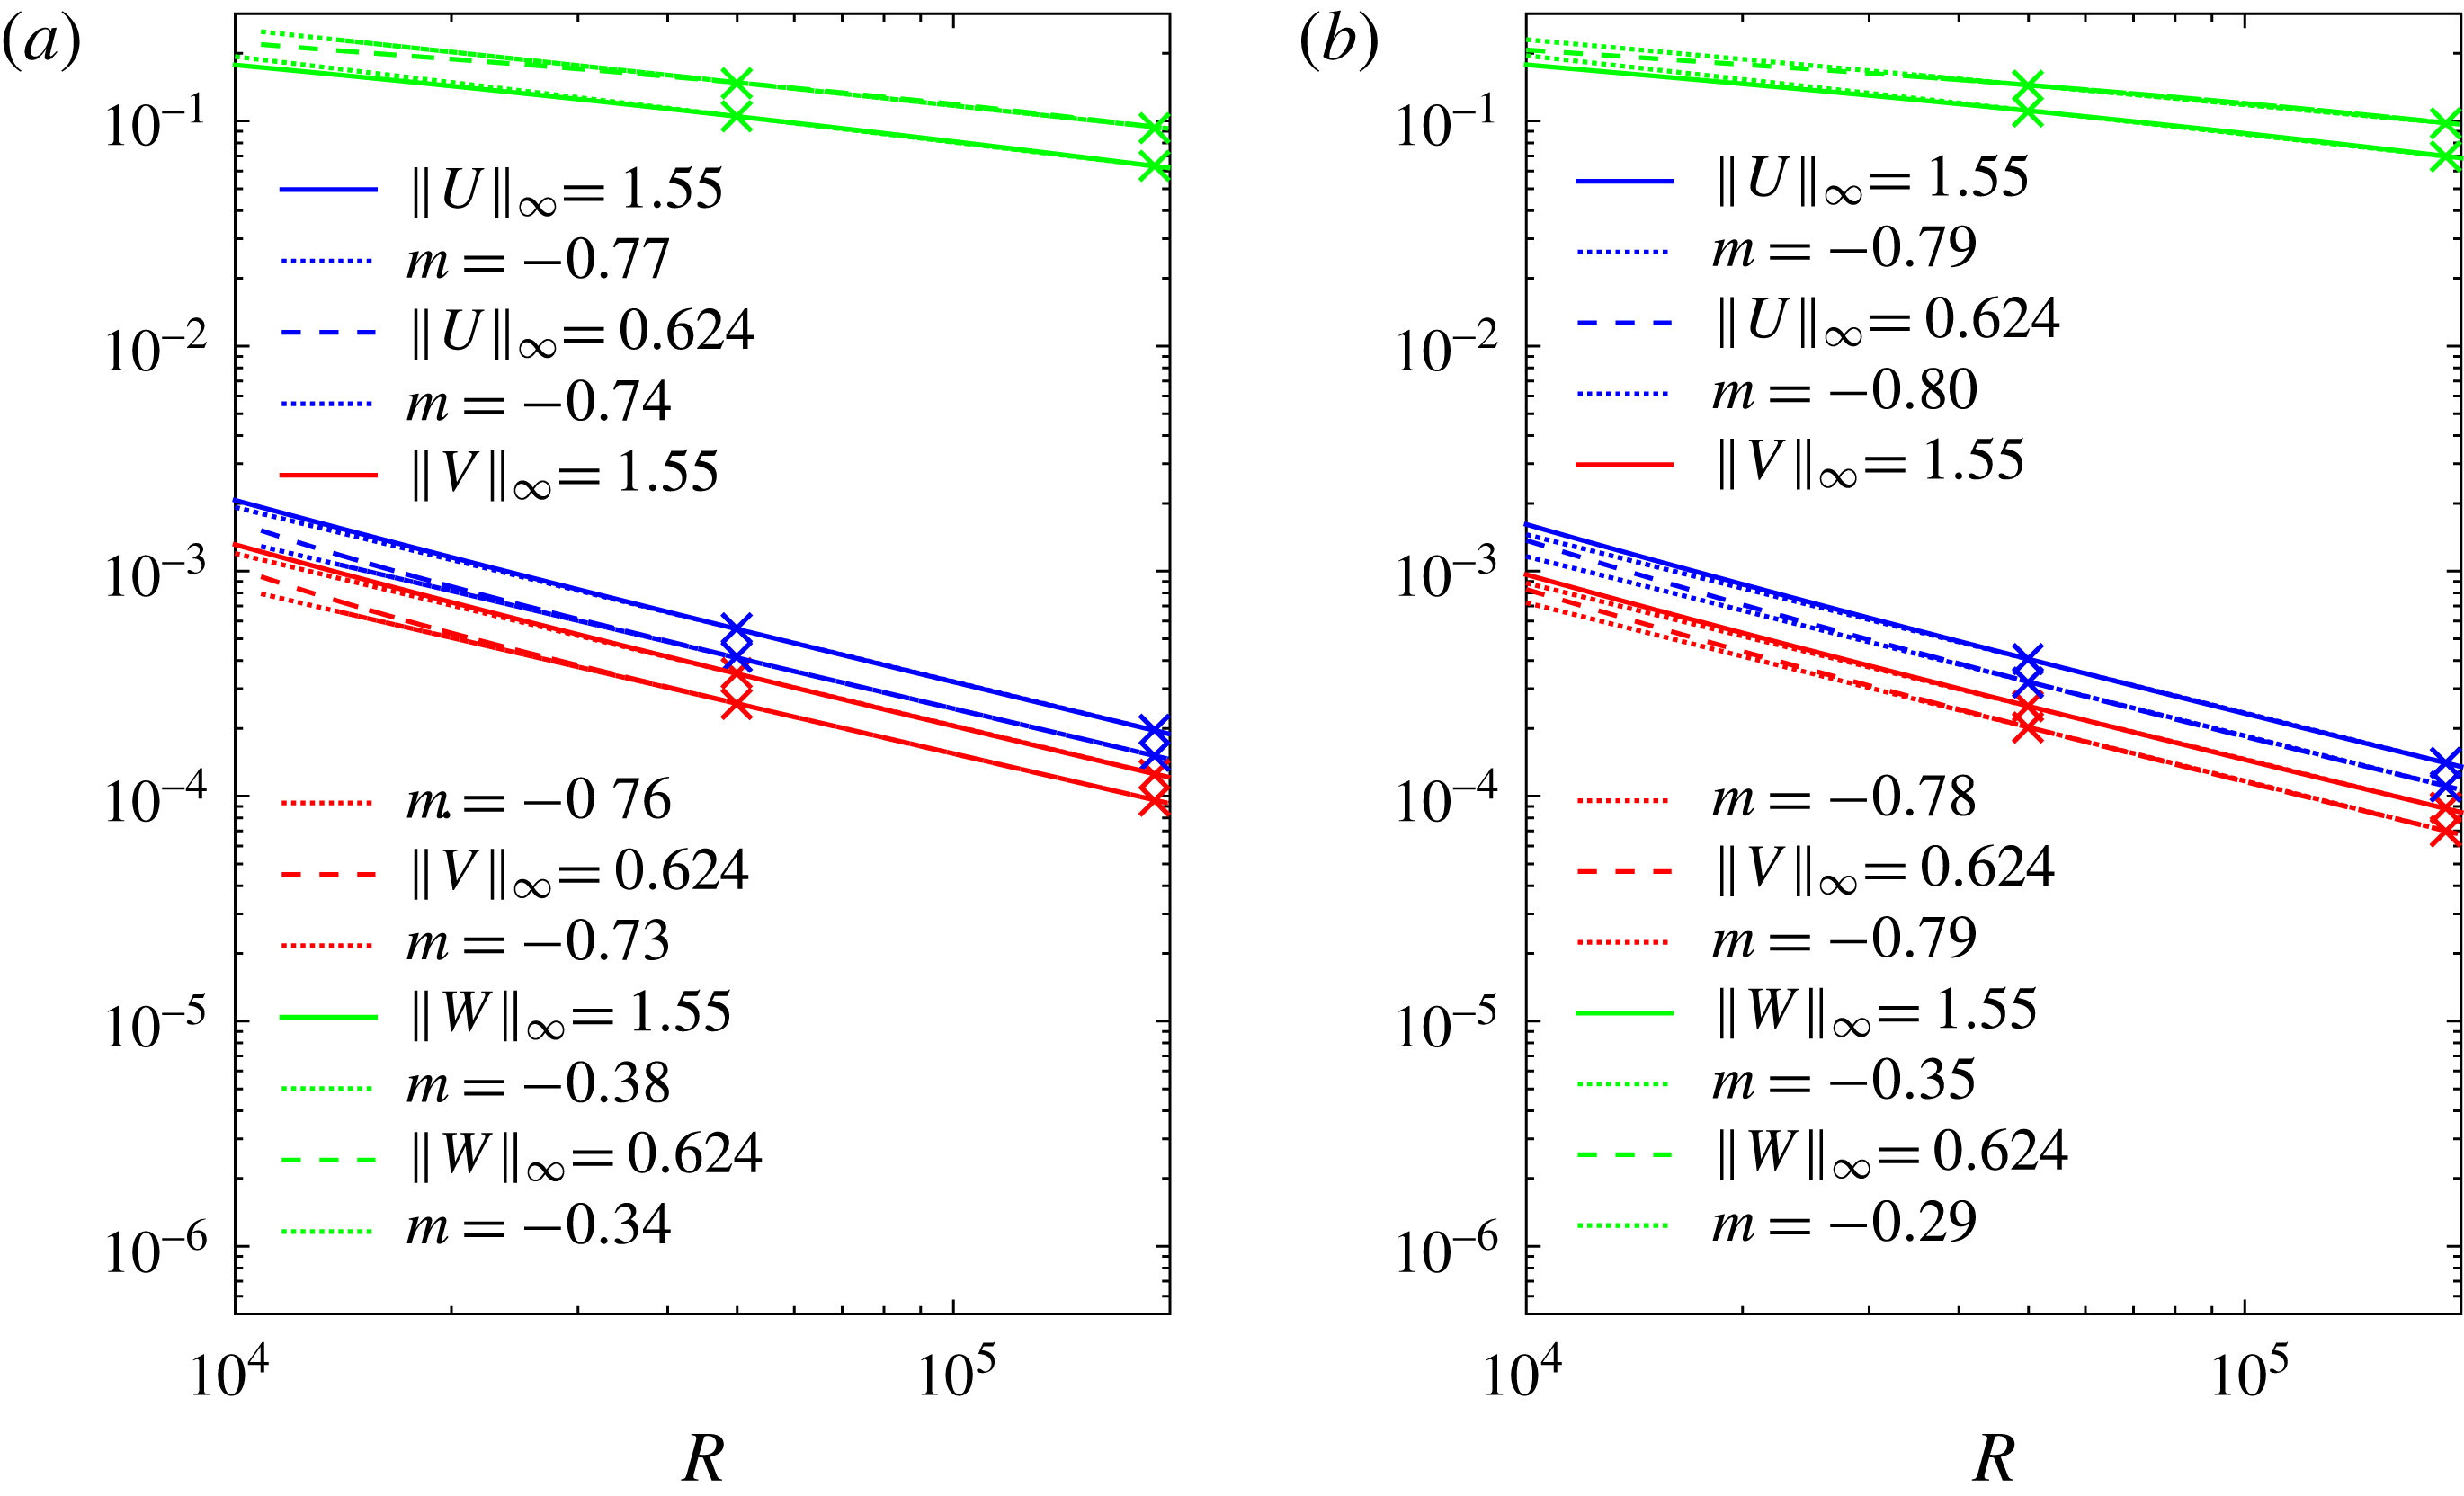
 $\Vert U\Vert _{\infty }$
and
 $\Vert V\Vert _{\infty }$
and streak sup-norms
 $\Vert W\Vert _{\infty }$
for two different
 ${\it\alpha}$
as a function of
 $R$
on a log–log scale. The linear fittings on a log–log scale are based on a best-fit estimate of the data in the regime
 $5\times 10^{4}<R<2\times 10^{5}$
. The scaling for rolls for
 $C1$
ranges between
 $R^{-0.74}$
and
 $R^{-0.77}$
; whilst the streak scaling ranges between
 $R^{-0.34}$
and
 $R^{-0.38}$
. We found a systematic trend for the slope to steepen slightly with increasing
 ${\it\alpha}$
. For instance, at
 ${\it\alpha}=2.51$
, the observed roll slope is close to
 $R^{-0.80}$
, while the streak slope is
 $R^{-0.40}$
. The roll scaling for
 $C2$
on the other hand ranges between
 $R^{-0.78}$
and
 $R^{-0.80}$
, whilst the streak size scaling ranges between
 $R^{-0.29}$
and
 $R^{-0.35}$
, again with slight dependence on
 ${\it\alpha}$
. At
 ${\it\alpha}=2.51$
, the observed roll slope is approximately
 $R^{-0.80}$
and the streak slope is
 $R^{-0.38}$
. The maximal streamwise wave amplitude for the
 $l$
mode,
 $\Vert A_{l}^{w}\Vert _{\infty }$
for
 $l=1,2,3$
is shown in figure 11(a,b) for two different values of
 ${\it\alpha}$
for both
 $C1$
and
 $C2$
. Note that the
 $l=1$
component for axial wave velocity scales somewhere between
 $R^{-0.50}$
and
 $R^{-0.52}$
for
 $C1$
, and
 $R^{-0.54}-R^{-0.55}$
for
 $C2$
, though the log–log scale also shows that the curves are yet to straighten completely for the larger
 $l$
range, and hence
 $R$
may not be large enough to reach the asymptotic regime for the larger
 $l$
cases. The mode dependence of the asymptotic trends is not unexpected since the effective Reynolds number is smaller for small scales, i.e. for larger
 $l$
or
 $k$
. For
 $l=2$
, the decay rate is approximately in the
 $R^{-0.51}-R^{-0.60}$
range. For
 $l=3$
the apparent scale is
 $R^{-0.5}$
for
 $C1$
at
 ${\it\alpha}=0.624$
, while it is
 $R^{-0.71}$
for
 $C2$
. Note that different
 $l$
modes have approximately the same decay rate in
 $R$
, suggesting that wave nonlinearity is important as
 $R\rightarrow \infty$
. In other words, the numerical results do not appear to be consistent with the VWI scenario of a dominating single wave mode.
Supremum norm of roll components
 $(U,V)$
and of streak
 $W$
versus
 $R$
for (a)
 $C1$
and (b)
 $C2$
solution.
Supremum over
 $(r,{\it\theta})$
of
 $A_{l}^{w}(r,{\it\theta})$
and
 $A_{l}^{\bot }(r,{\it\theta})$
at
 $l=1$
(blue lines), 2 (red lines), 3 (green lines) for (a,c)
 $C1$
and (b,d)
 $C2$
solutions for different
 ${\it\alpha}$
. Solid lines correspond to
 ${\it\alpha}=1.55$
, while dashed lines represent
 ${\it\alpha}=0.624$
. Dotted lines show linear fittings. Negative slopes of dotted lines (from top to bottom) are (a)
 $0.50,0.52,0.51,0.58,0.50,0.65$
, (b)
 $0.54,0.54,0.60,0.59,0.71,0.70$
, (c)
 $0.76,0.76,0.86,0.80,0.84,0.83$
, (d)
 $0.78,0.78,0.88,0.88,0.69,0.78$
.
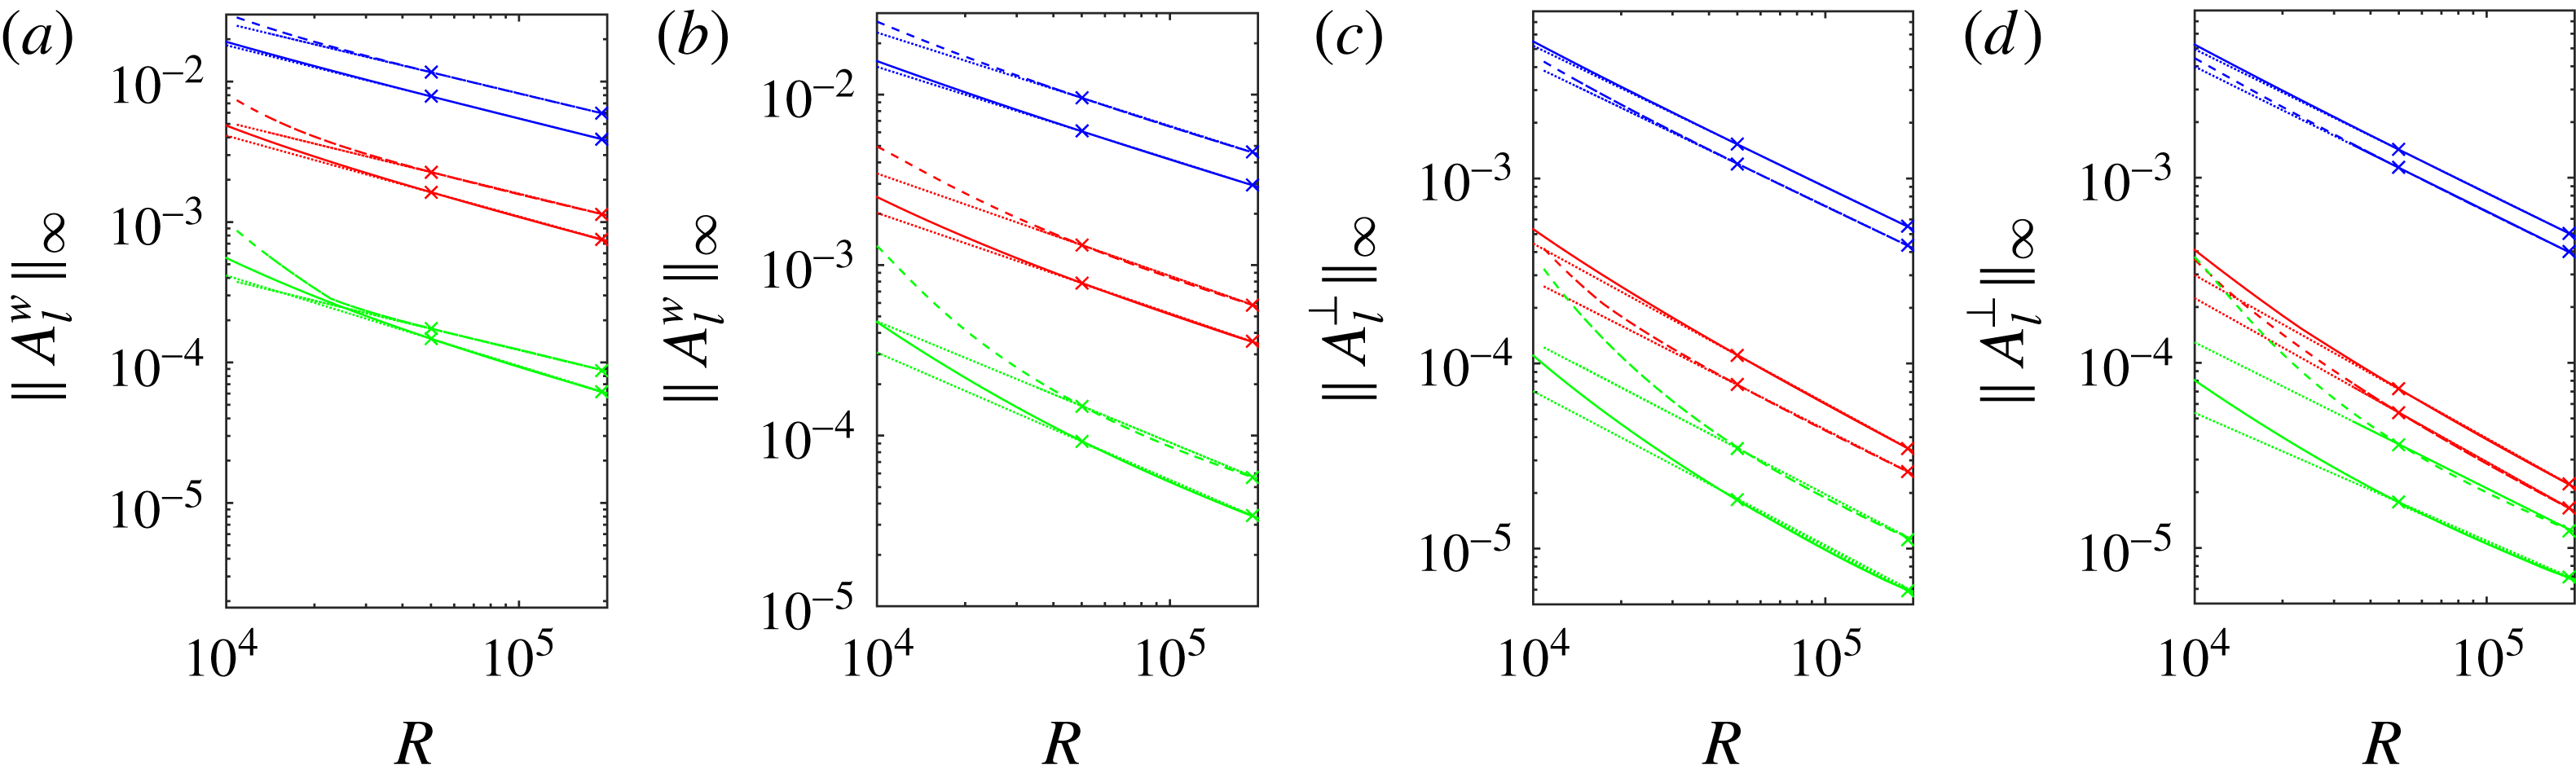
On the other hand, figure 11(c,d), show the scaling of the perpendicular wave amplitude
 $A_{l}^{\bot }(r,{\it\theta})$
for
 $C1$
and
 $C2$
. For
 $l=1$
, this scaling ranges between
 $R^{-0.76}$
and
 $R^{-0.78}$
for both
 $C1$
and
 $C2$
, while the
 $l=2$
mode corresponds to a faster decay rate in both cases; note
 $l=3$
curve is not as straight, suggesting it is further from reaching its asymptotic limit.
In figure 12, we plot
 $A_{k}^{U}(r)/A_{k,m}^{U}$
against
 $r/r_{m}$
for the
 $C1$
solution for two different values of
 ${\it\alpha}$
in (a,c,e) and (b,d,f). We notice that the curves have almost collapsed into a single graph, as might be expected if a single collapsing scale exists. The collapse is not as good for
 $k=3$
, apparently because the
 $R\rightarrow \infty$
asymptotic state has yet to be achieved for the smaller scales corresponding to larger
 $k$
. Note the decay of rolls in
 $r/r_{m}$
. This is explained asymptotically in § 4.3.
Scaled radial roll-amplitude function
 $A_{k}^{U}(r)/A_{k,m}^{U}$
versus
 $r/r_{m}$
for
 $C1$
solution for
 $k=1,2,3$
for different
 $R$
. (a,c,e)
 ${\it\alpha}=1.55$
, (b,d,f)
 ${\it\alpha}=0.624$
.

Figure 13(a,b) shows
 $A_{k,m}^{U}$
against
 $R$
on a log–log scale for different values of
 $k$
for two different values of
 ${\it\alpha}$
. The corresponding radial location (
 $r=r_{m}$
), where the max
 $A_{k,m}^{U}$
is attained, is shown in figure 13(c,d) through a log–log linear fitting in the range
 $7\times 10^{4}<R<2\times 10^{5}$
.
Maximal radial roll amplitude
 $A_{k,m}^{U}$
and its location
 $r_{m}$
for
 $k$
th azimuthal component versus
 $R$
for
 $C1$
solution for
 ${\it\alpha}=1.55$
(a,c) and
 ${\it\alpha}=0.624$
(b,d) when
 $k=1$
(cyan line), 2 (magenta line), 3 (green line). Dotted lines show linear fittings. Negative slopes of dotted lines (from top to bottom) are (a)
 $0.78,0.79,0.67$
, (b)
 $0.84,0.65,0.66$
, (c)
 $0.23,0.21,0.22$
, (d)
 $0.23,0.22,0.22$
.

Scaled radial roll-amplitude function
 $A_{k}^{U}(r)/A_{k,m}^{U}$
versus
 $r/r_{m}$
for
 $C2$
solution for
 $k=2,4,6$
for different
 $R$
. (a,c,e)
 ${\it\alpha}=1.55$
, (b,d,f)
 ${\it\alpha}=0.624$
.

We note that for the most dominant mode (
 $k=2$
), the scaling curves in (a,b) are close to straight lines in the range
 $5\times 10^{4}<R<2\times 10^{5}$
with the approximate behaviour
 $R^{-0.78}-R^{-0.84}$
, consistent with the decay rate of
 $\Vert U\Vert _{\infty }$
observed in figure 10. Beyond the most dominant mode, the graphs for other modes have not yet approached a straight line, suggesting that
 $R$
is not large enough to reach the asymptotic scaling regime for larger
 $k$
.
Notice in figure 13(c,d) that for the largest azimuthal component (
 $k=2$
), shown in magenta,
 $r_{m}$
scales approximately as
 $R^{-0.23}$
. This is nearly the same for other
 $k$
values (
 $k=1,3$
) though the curves become linear for larger
 $R$
.
Figures 14 and 15 give the same set of scaling results for the solution branch
 $C2$
. Note however that the odd values of
 $k$
are missing from the graph. This is because those components (within small calculation error) are zero since the corresponding solutions have the
 ${\it\Omega}_{2}$
-symmetry (shift-and-rotate) defined by Pringle et al. (Reference Pringle, Duguet and Kerswell2009).
Maximal radial roll amplitude
 $A_{k,m}^{U}$
and its location
 $r_{m}$
for
 $k$
th azimuthal component versus
 $R$
for
 $C2$
solution for
 ${\it\alpha}=1.55$
(a,c) and
 ${\it\alpha}=0.624$
(b,d) when
 $k=2$
(cyan line), 4 (magenta line), 6 (green line). Dotted lines show linear fittings. Negative slopes of dotted lines (from top to bottom) are (a) 0.79, 0.71, 0.73, (b) 0.79, 0.74, 0.75, (c) 0.23, 0.23, 0.22, (d) 0.23, 0.23, 0.23.

Figure 16 shows streak amplitude
 $A_{k}^{S}(r)$
for different
 $R$
and
 $k$
with
 ${\it\alpha}=1.55$
and
 ${\it\alpha}=0.624$
for the
 $C1$
solution. It is to be noted that for
 $k=0$
, we have a very flat profile (see § 4.4 for a theoretical explanation). Because the roll effect on the streak is more global,
 $A_{k}^{S}(r)$
does not collapse in the same way for different
 $R$
as do rolls, though for
 $k\neq 0$
, there is a slight tendency of the maximum of the pattern to shift towards the origin for large
 $R$
.
Profile of
 $C1$
-streak amplitude
 $A_{k}^{S}(r)$
versus
 $r$
for different
 $R$
and
 $k$
for given
 ${\it\alpha}$
. (a,c,e,g)
 ${\it\alpha}=1.55$
, (b,d,f,h)
 ${\it\alpha}=0.624$
.
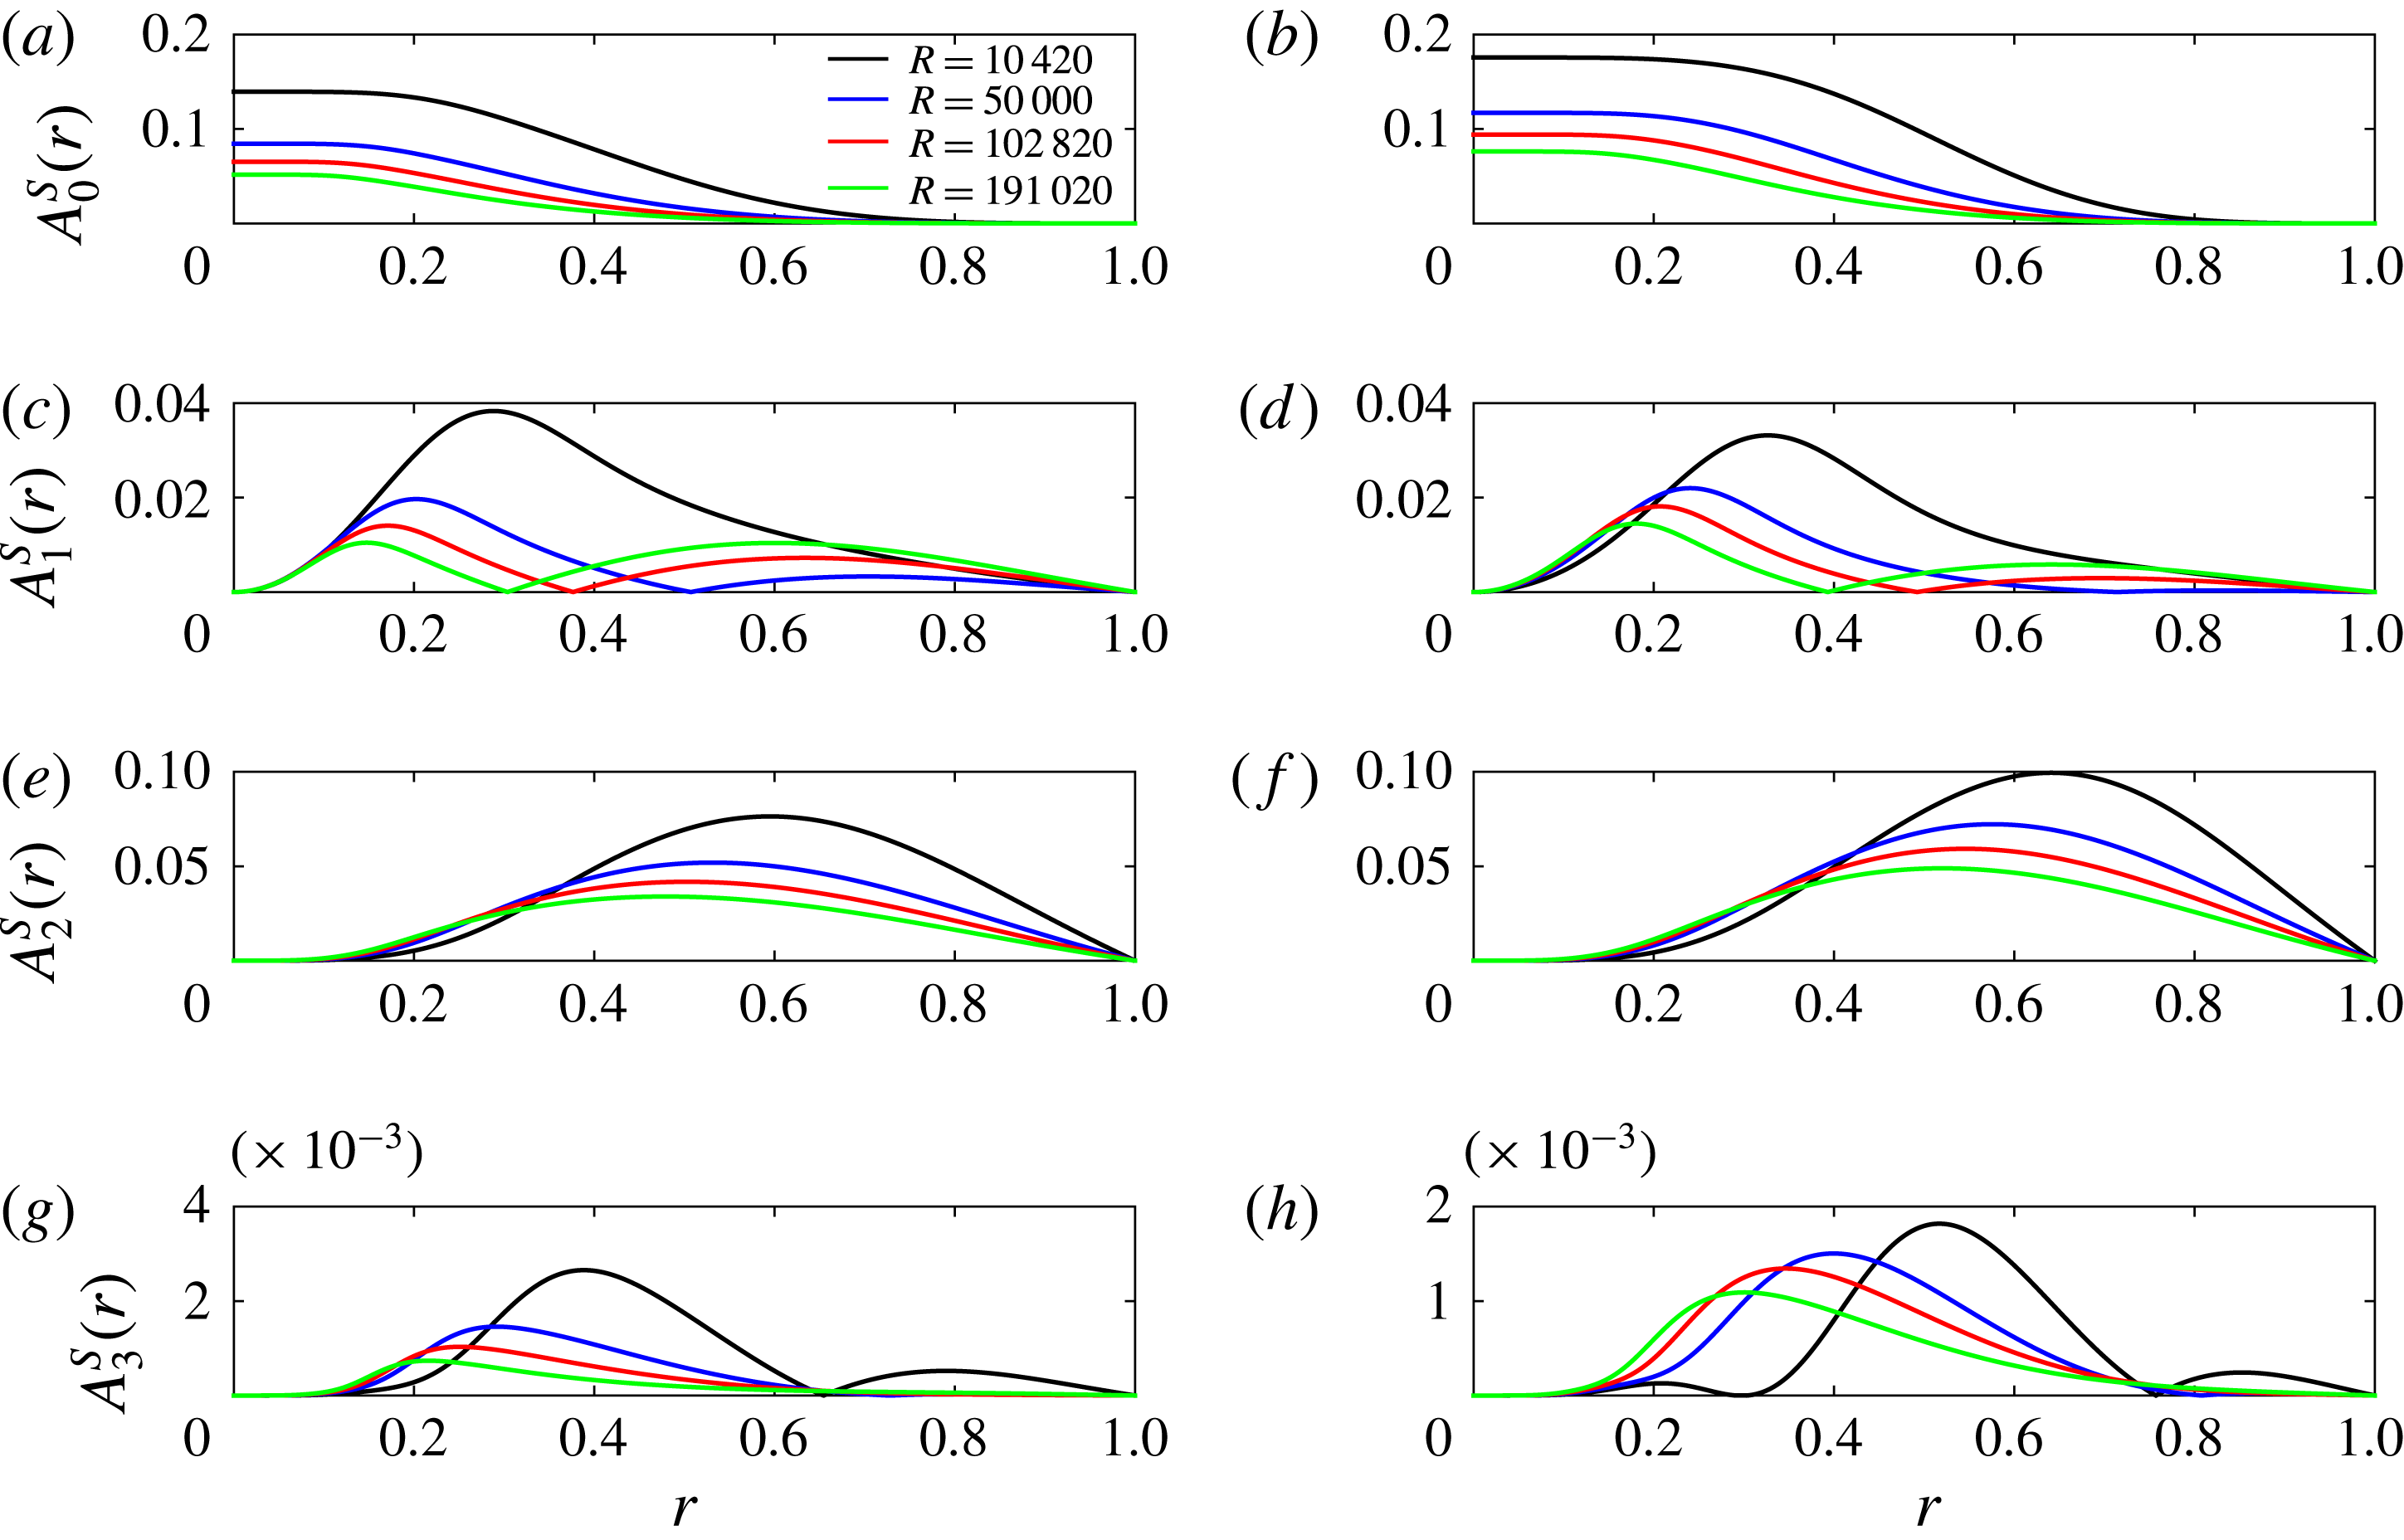
Figure 17(a,b) show the maximal streak amplitude
 $A_{k,m}^{S}$
against
 $R$
for different azimuthal wavenumber
 $k$
for
 $C1$
solution, while figure 17(c,d) show maximal radial location
 $r_{m}$
against
 $R$
. Note the
 $k=0$
curve is missing since
 $r_{m}$
is not well defined for a flat profile (see figure 16). The streak amplitude for the dominant
 $k=0$
mode scales as
 $R^{-0.37}-R^{-0.33}$
, close to the scaling of
 $\Vert W\Vert _{\infty }$
in figure 10.
Maximal
 $k$
th streak amplitude
 $A_{k,m}^{S}$
versus
 $R$
and its location
 $r_{m}$
versus
 $R$
for
 $C1$
solution for
 $k=0$
(cyan line), 1 (magenta line), 2 (green line), 3 (red line) for
 ${\it\alpha}=1.55$
(a,c) and
 ${\it\alpha}=0.624$
(b,d).
 $k=0$
is missing in (c,d) since it has a flat profile. Dotted lines show linear fittings. Negative slopes of dotted lines (from top to bottom) are (a) 0.37, 0.33, 0.47, 0.53, (b) 0.33, 0.29, 0.33, 0.28, (c) 0.07, 0.23, 0.24, (d) 0.07, 0.21, 0.22.
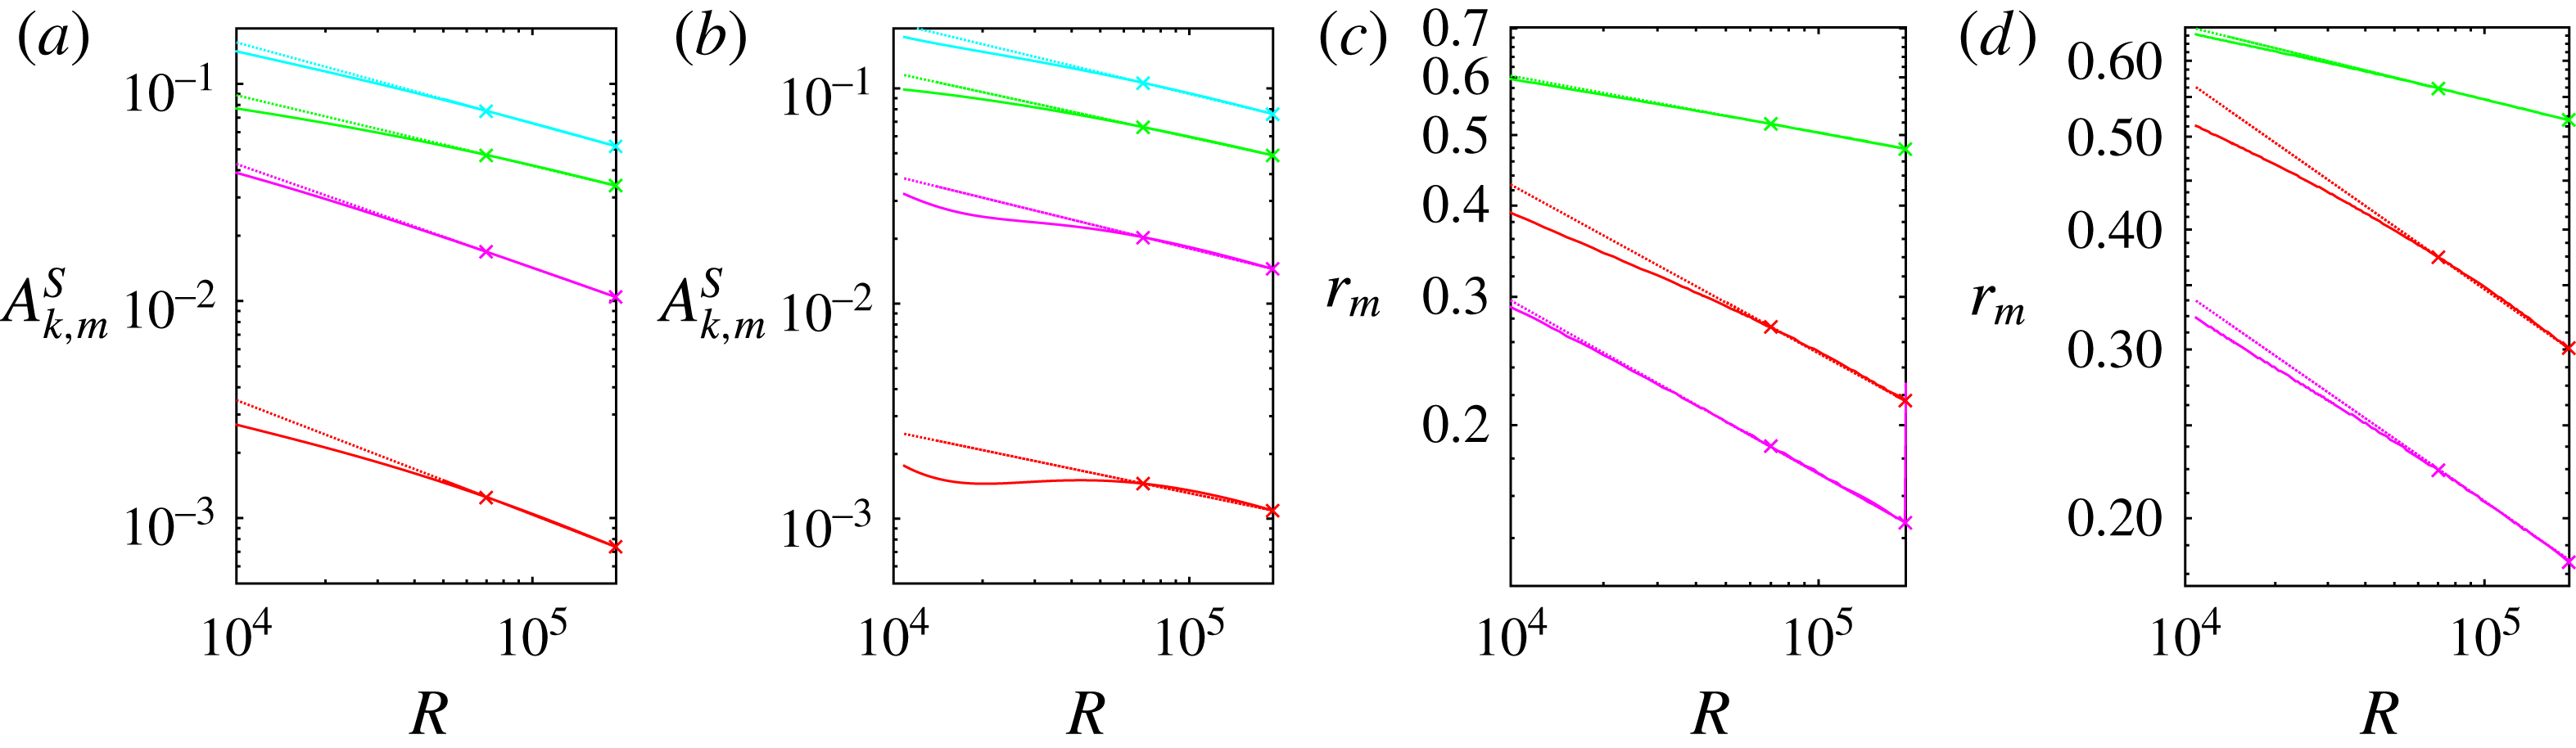
Figure 18 shows the streak-amplitude function
 $A_{k}^{S}(r)$
for different
 $R$
and
 $k$
for
 ${\it\alpha}=0.624$
and
 ${\it\alpha}=1.55$
for
 $C2$
solution. Again for
 $k=0$
, we observe a very flat profile.
Profile of
 $C2$
streak amplitude
 $A_{k}^{S}(r)$
versus
 $r$
for different
 $R$
and
 $k$
for given
 ${\it\alpha}$
. (a,c,e,g)
 ${\it\alpha}=1.55$
, (b,d,f,h)
 ${\it\alpha}=0.624$
.
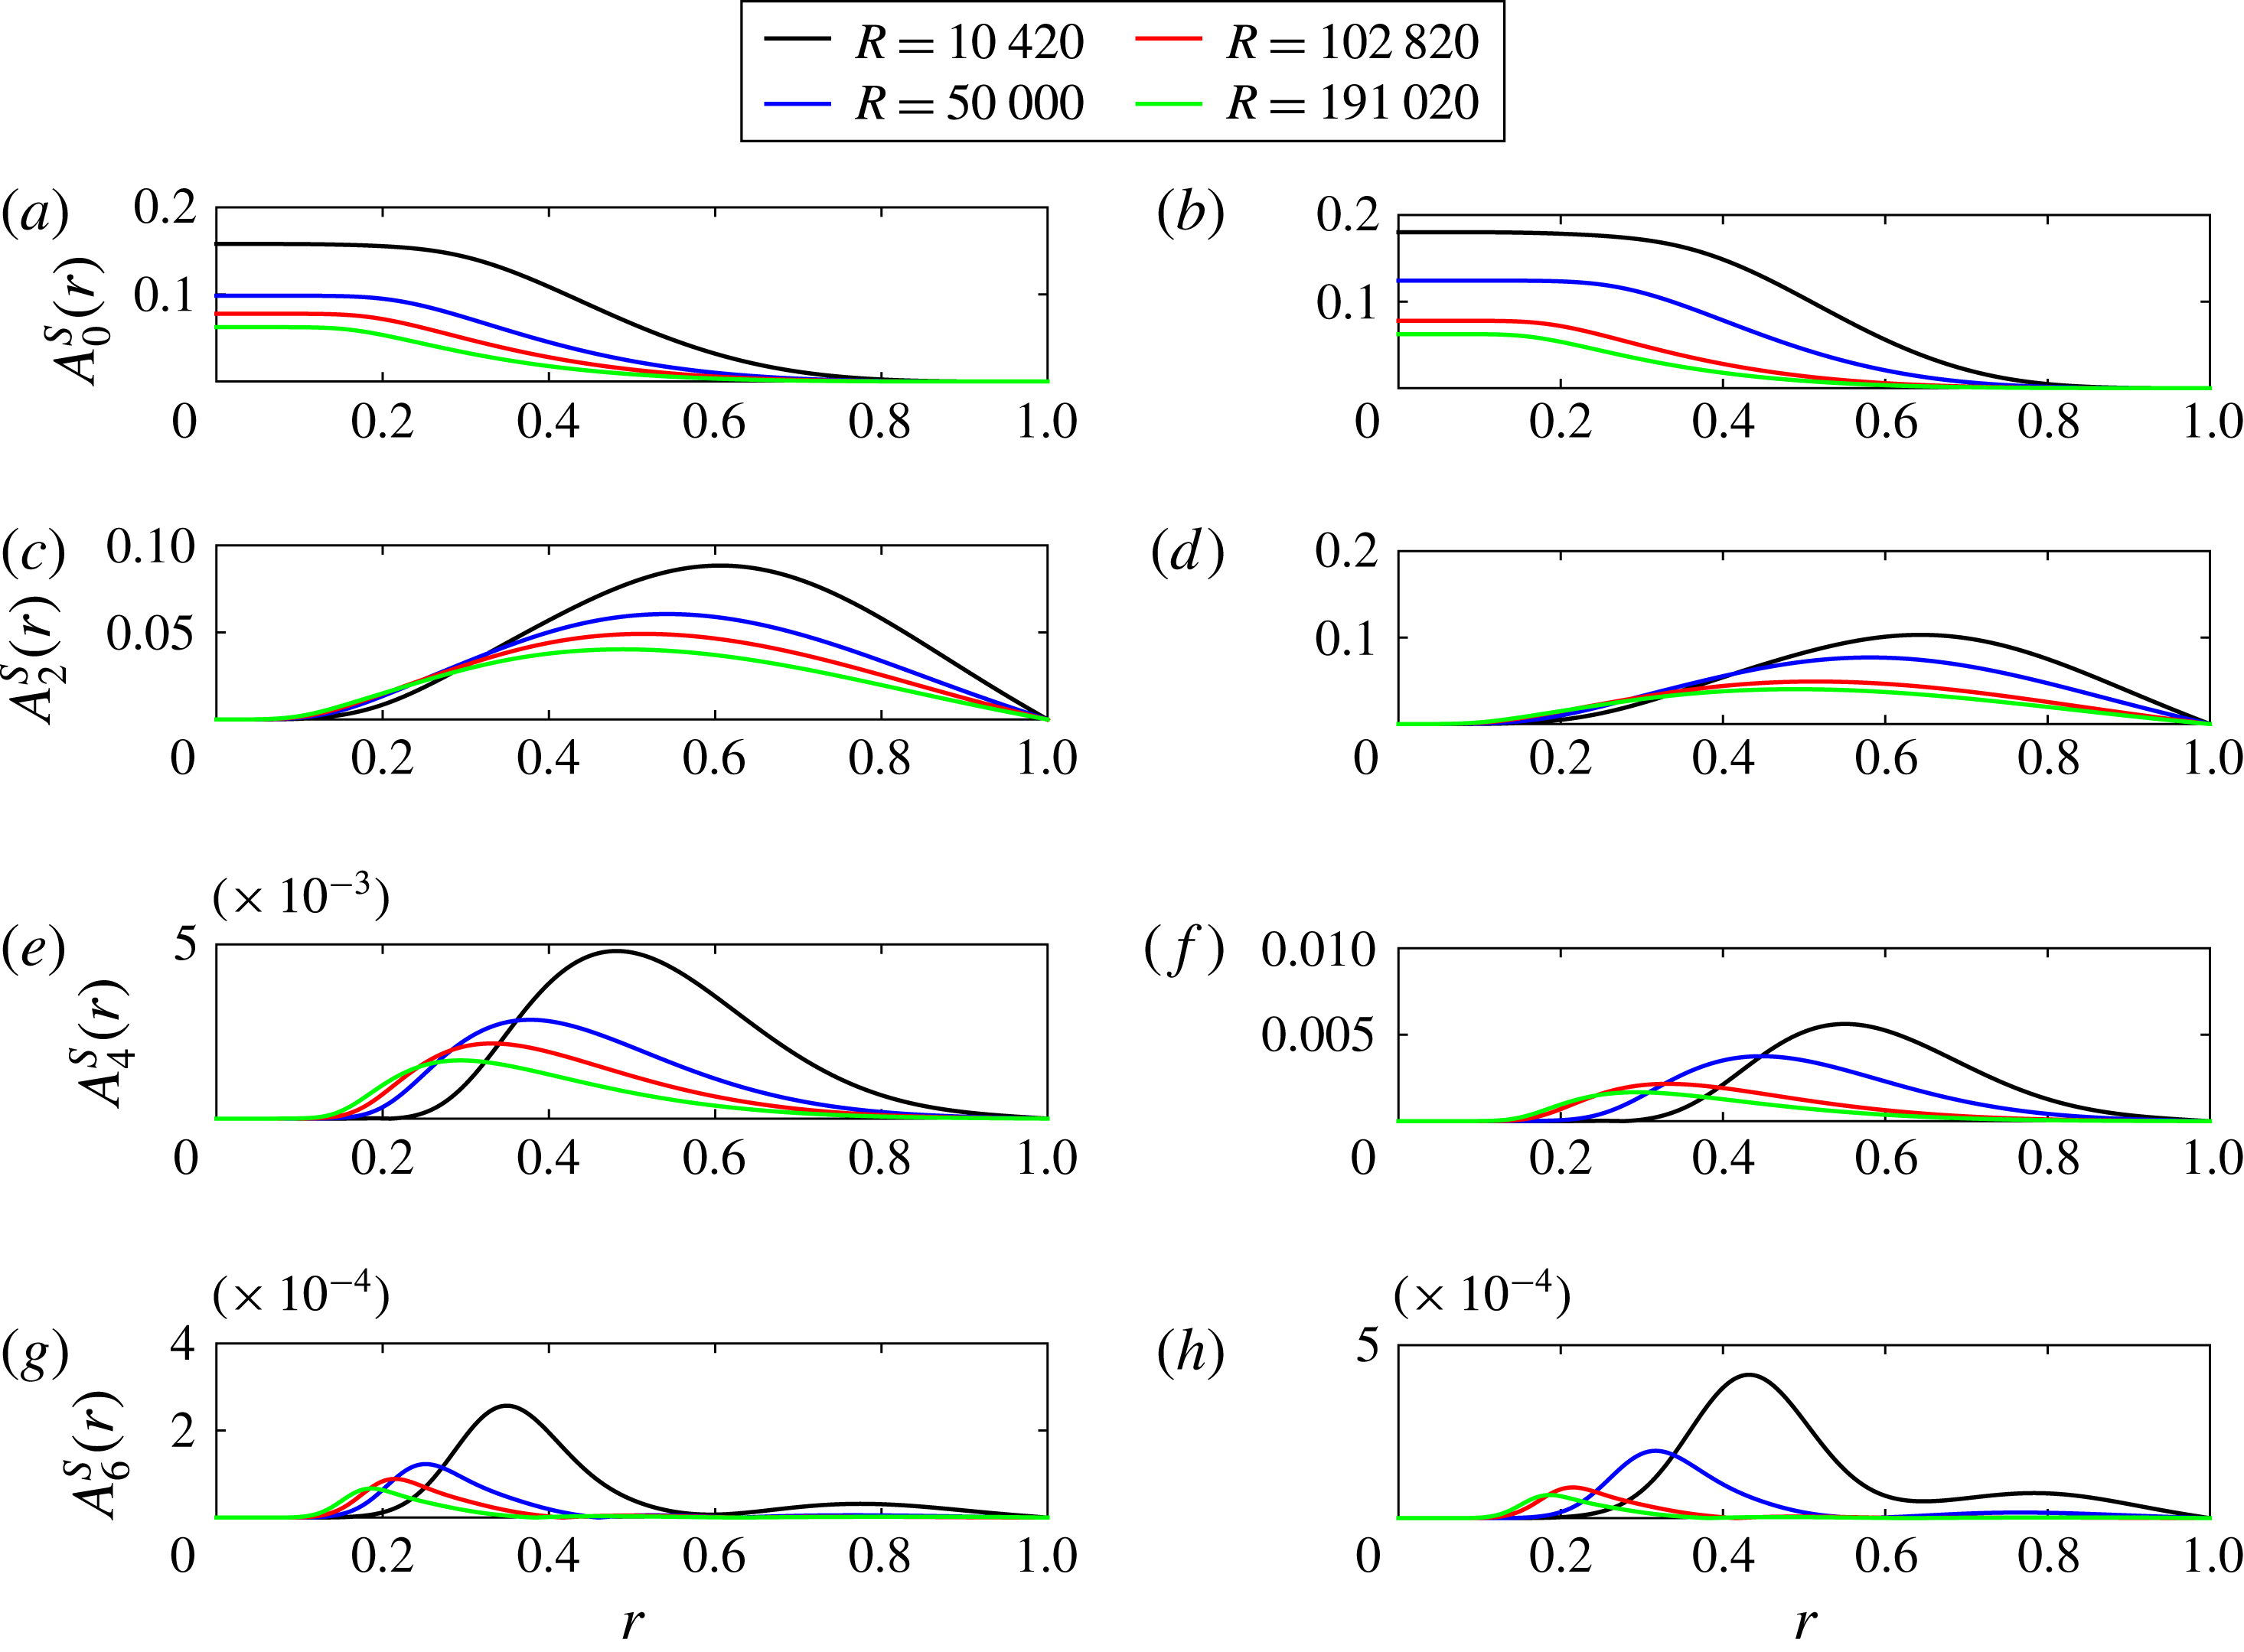
Figure 19(a,b) show the scaling of maximal streak amplitude
 $A_{k,m}^{S}$
with
 $R$
for different azimuthal wavenumber
 $k$
for the
 $C2$
solution, while figure 19(c,d) show the scaling of corresponding maximal location
 $r_{m}$
with
 $R$
. Once again the
 $k=0$
mode data is absent since
 $r_{m}$
is ill defined for a flat profile. The streak amplitude for the most dominant mode (
 $k=0$
) scales as
 $R^{-0.35}$
,
 $R^{-0.28}$
for
 ${\it\alpha}=1.55,0.624$
respectively, consistent with the scaling of
 $\Vert W\Vert _{\infty }$
in figure 10. Note that like the
 $C1$
solution, the maximal location
 $r_{m}$
is almost independent of
 $R$
; this feature is explained theoretically in § 4.4.
Maximal
 $k$
th streak amplitude
 $A_{k,m}^{S}$
versus
 $R$
and and its location
 $r_{m}$
versus
 $R$
for
 $C2$
solution for
 $k=0$
(cyan line), 2 (magenta line), 4 (green line), 6 (red line) for
 ${\it\alpha}=1.55$
(a,c) and
 ${\it\alpha}=0.624$
(b,d).
 $k=0$
is missing in (c,d) since it has a flat profile. Dotted lines show linear fittings. Negative slopes of dotted lines (from top to bottom) are (a)
 $0.35,0.31,0.40,0.45$
, (b)
 $0.28,0.26,0.33,0.45$
, (c)
 $0.07,0.19,0.23$
, (d)
 $0.07,0.17,0.22$
.

Scaled axial wave amplitude
 $w_{kl}(r)/w_{k,l,m}$
versus
 $r/r_{m}$
for
 $C2$
solution at
 $l=1$
for different
 $k$
for
 ${\it\alpha}=1.55$
. (a)
 $(k,l)=(1,1)$
, (b)
 $(k,l)=(3,1)$
, (c)
 $(k,l)=(5,1)$
, (d)
 $(k,l)=(7,1)$
.
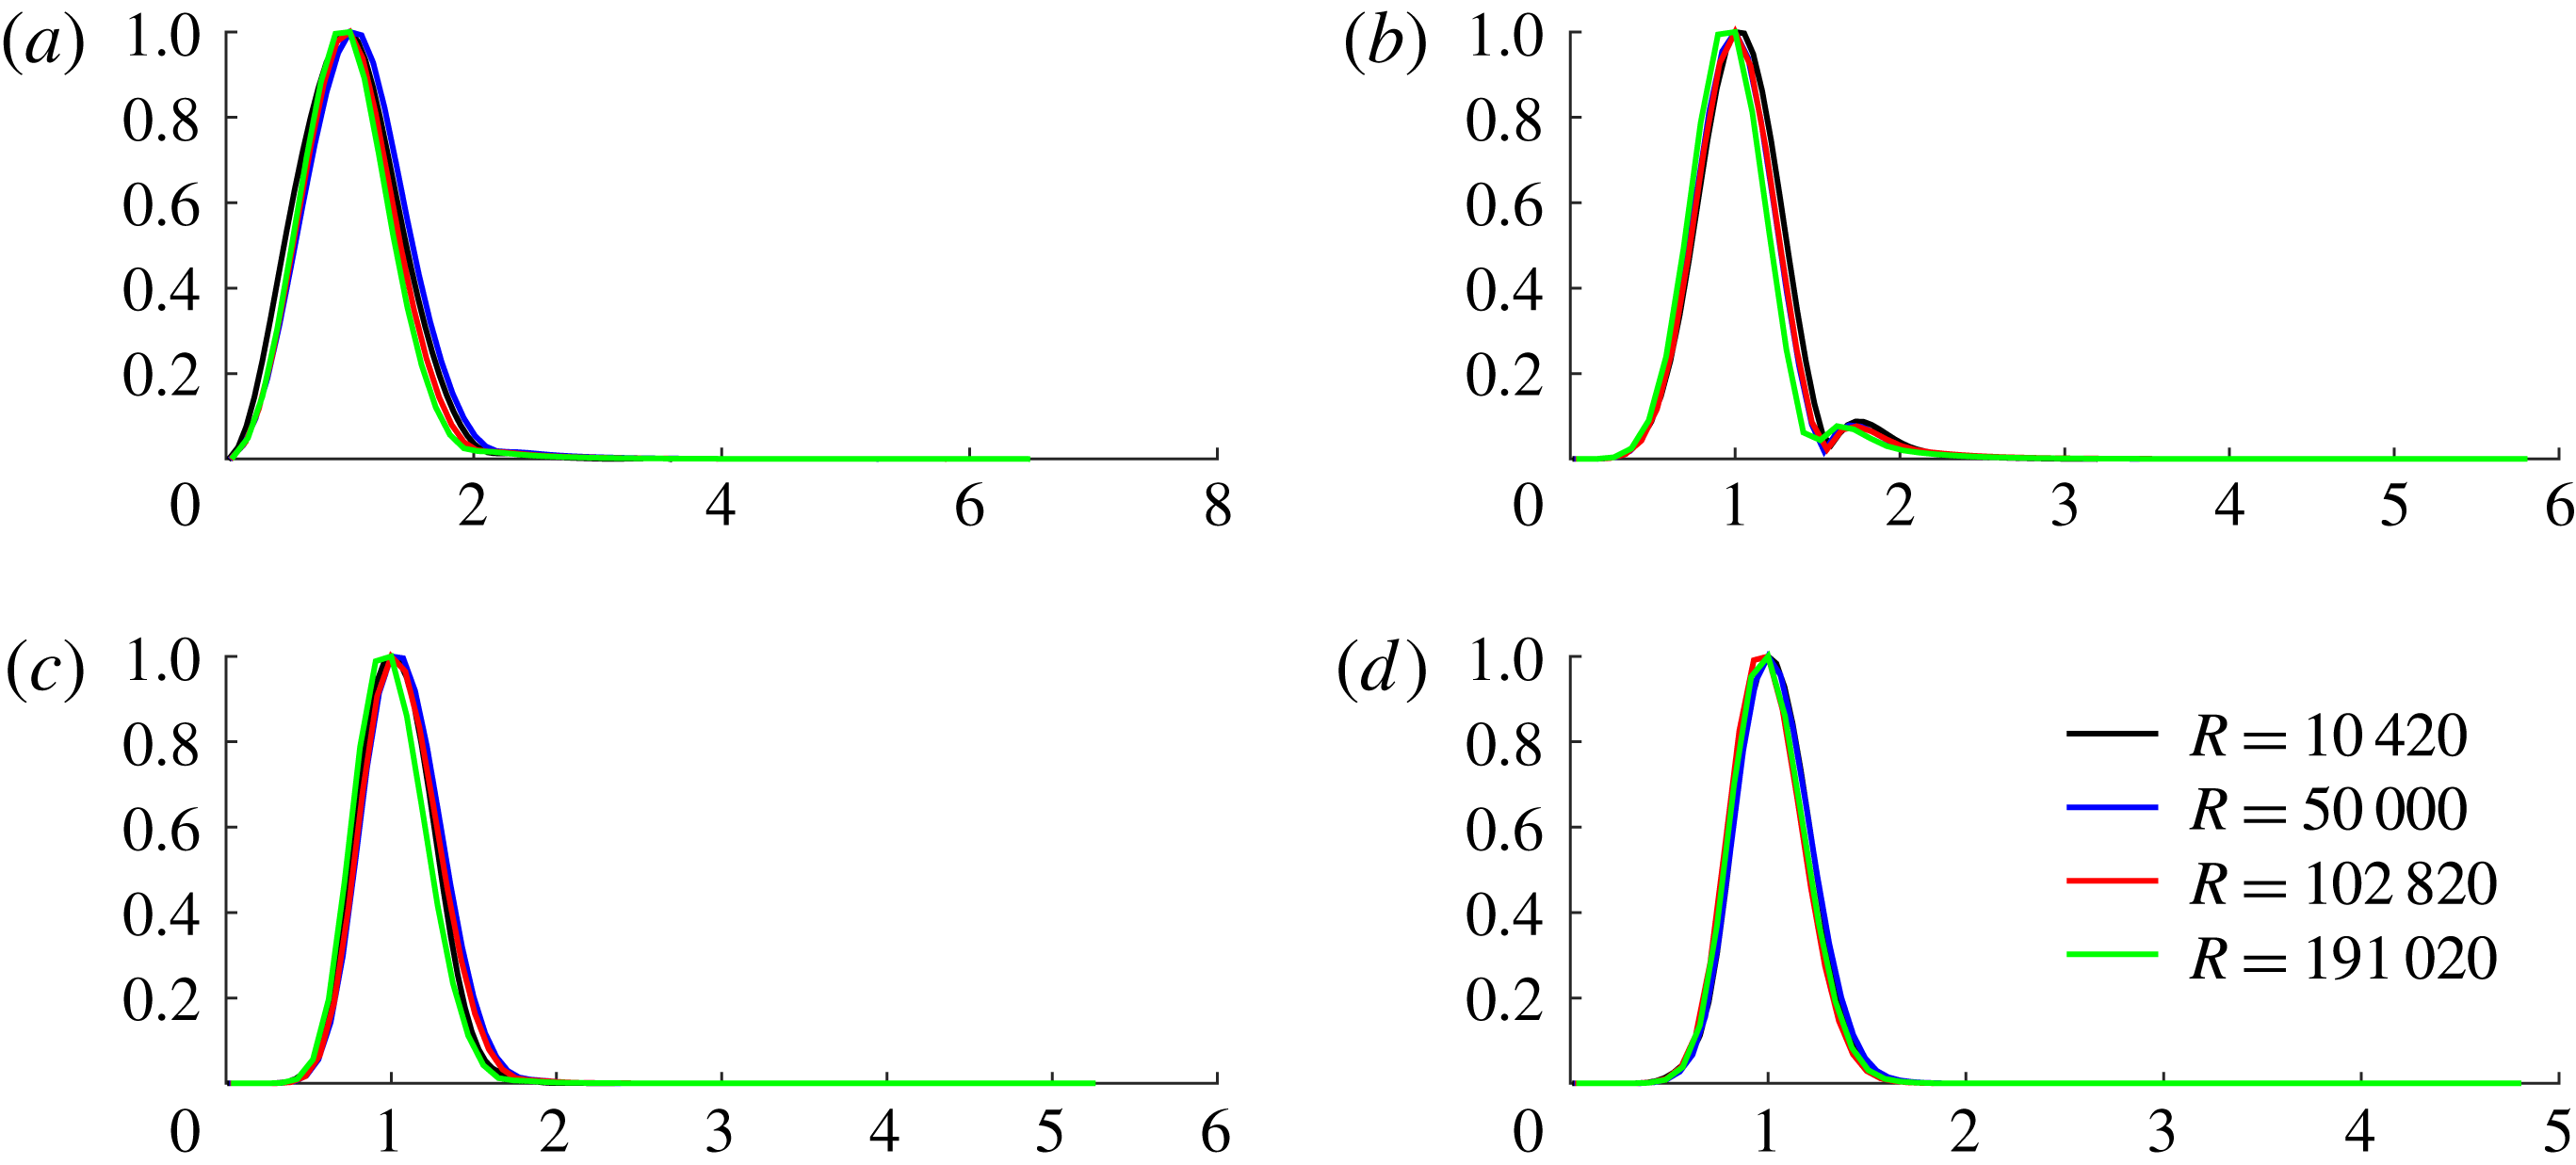
Figure 20 shows the collapse of the radial profile of the scaled axial wave amplitude
 $w_{k,l}(r)/w_{k,l,m}$
against
 $r/r_{m}$
(see (3.7c
)) for
 $l=1$
for different
 $k$
and
 $R$
for
 $C2$
solution for
 ${\it\alpha}=1.55$
. A similar collapse was observed for the
 $C1$
solution and for other
 $l$
modes. For the radial wave components, the collapse was worse, presumably because of their smaller sizes and limitations in numerical accuracy. However, in all cases, we noted that the location of maximum
 $r_{m}$
shifted towards the origin for larger and larger Reynolds number at a rate similar to the collapse rate of rolls. Also note the rapid decay of the solutions with large
 $\hat{r}$
. This is shown to be a general property of all such states in § 4.5.
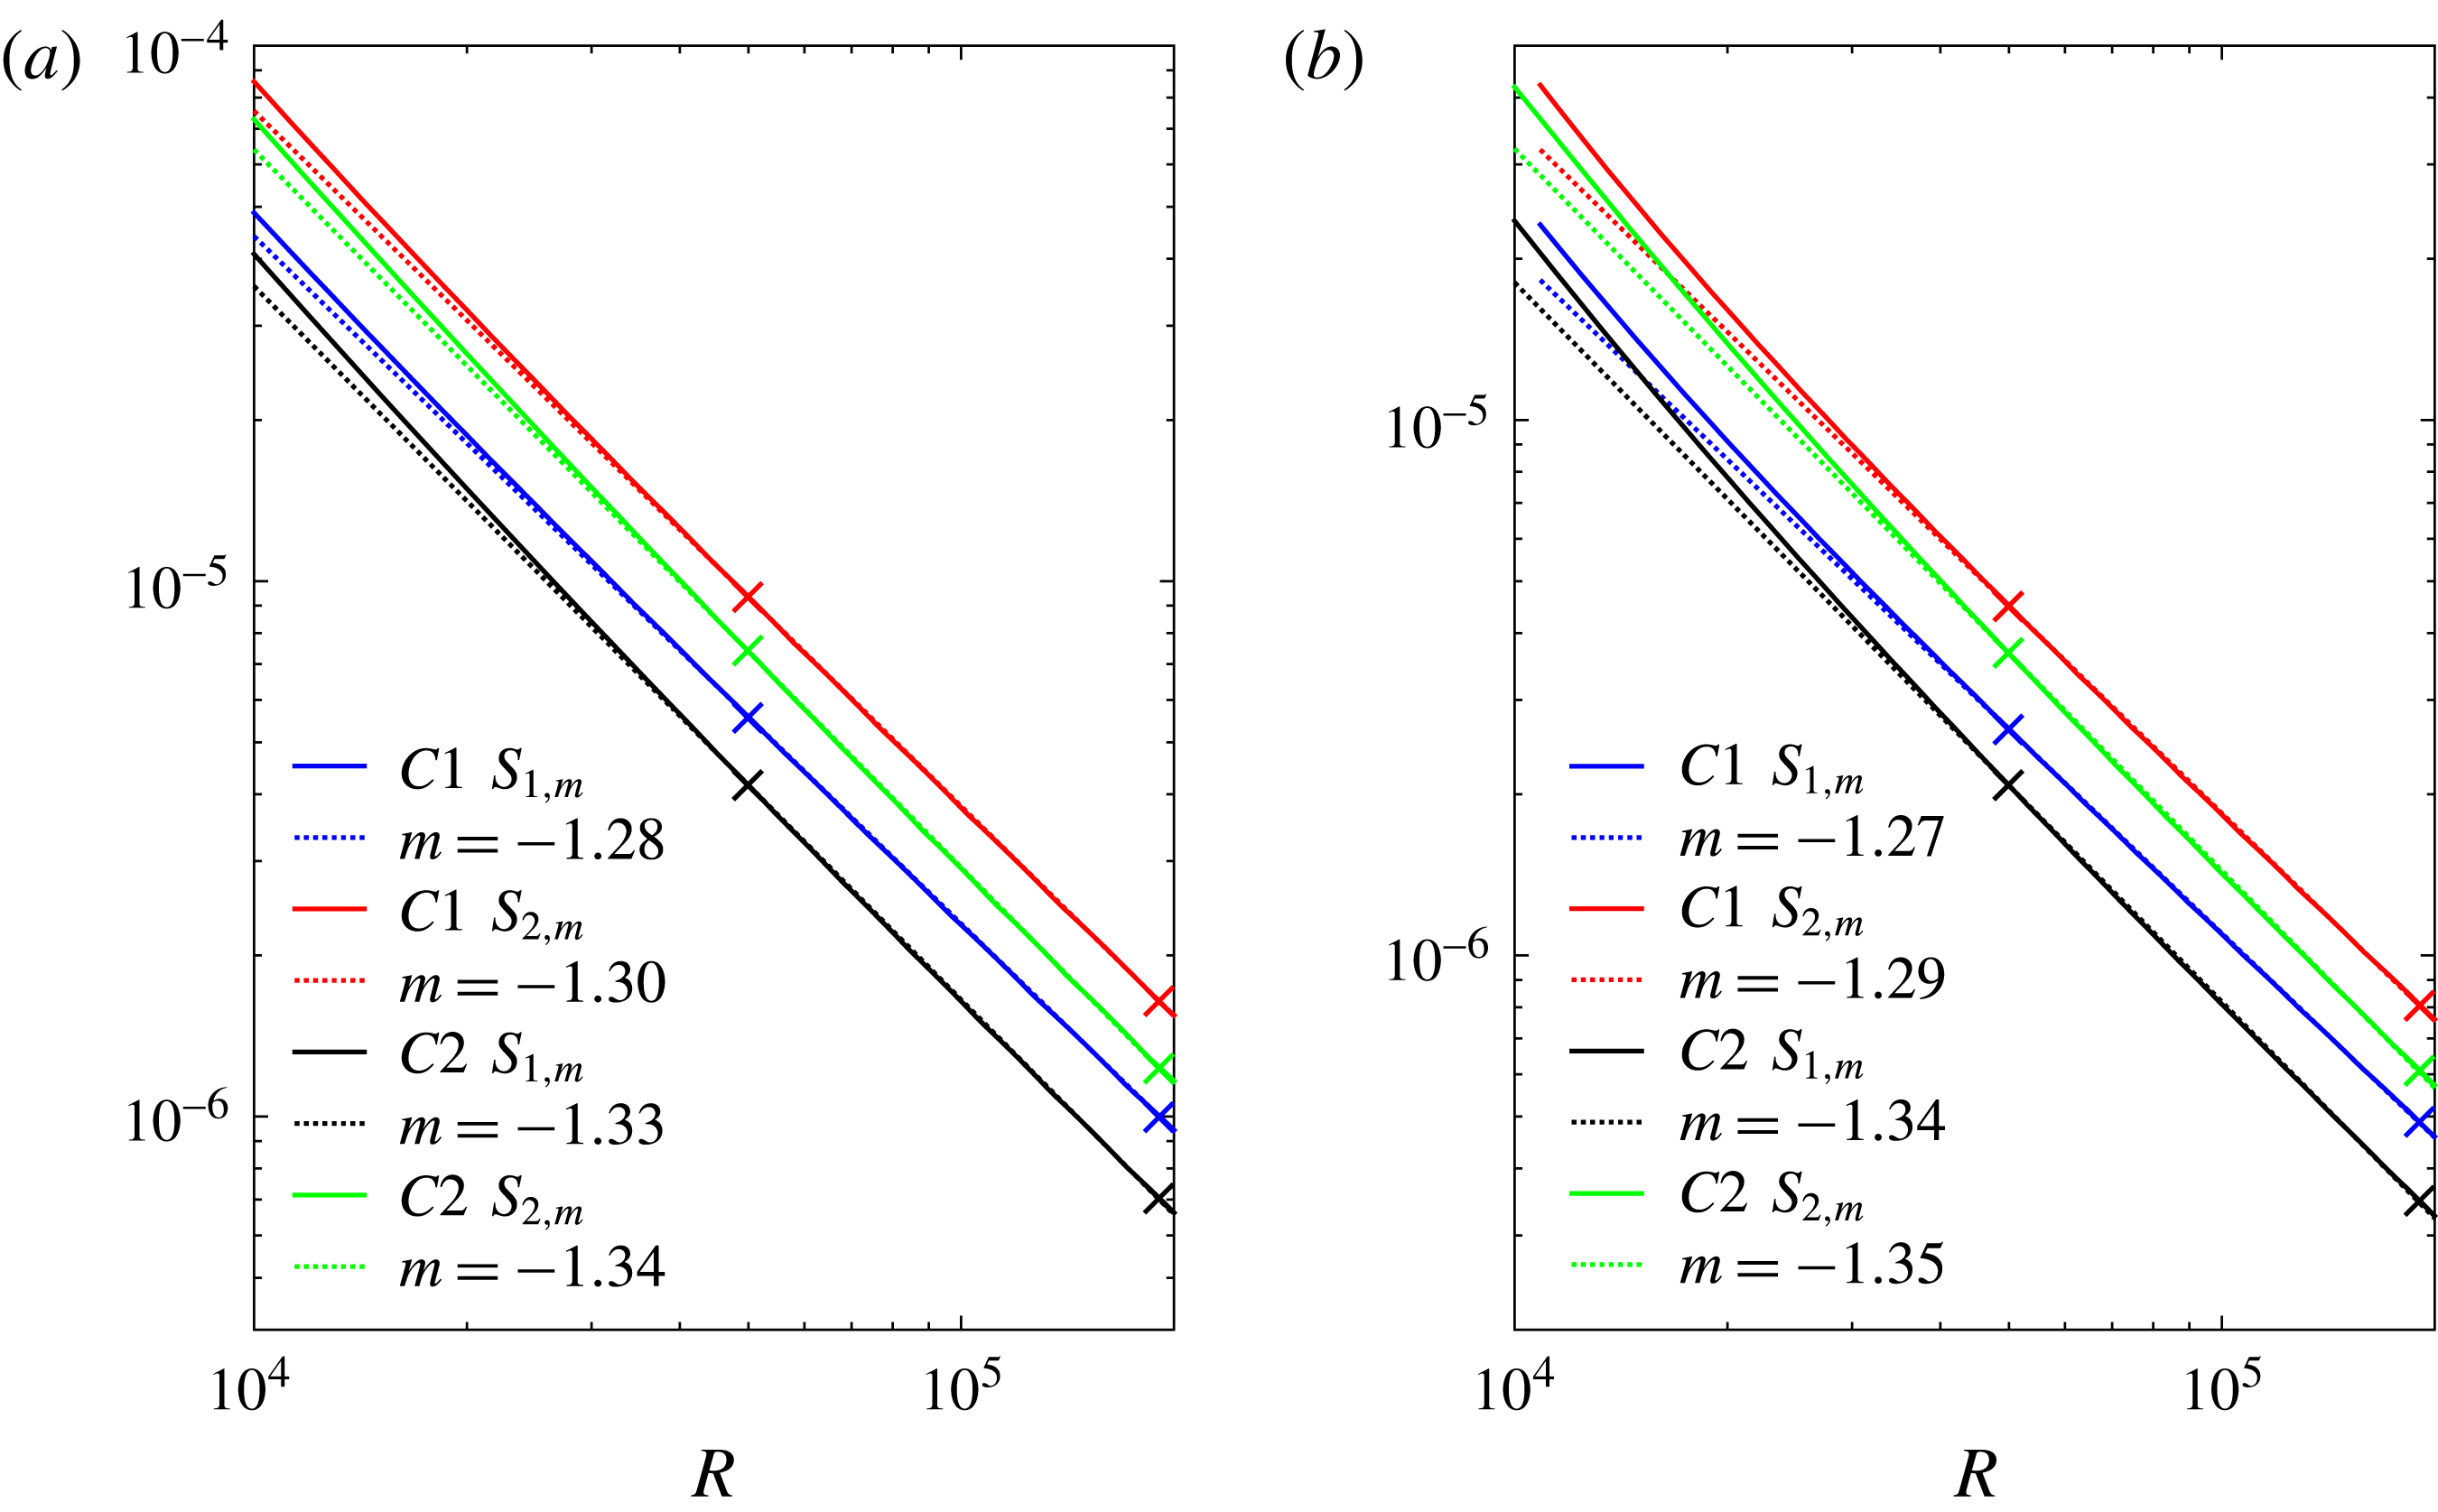
Scaling of maximal wave stresses
 $S_{1,m}$
,
 $S_{2,m}$
with
 $R$
for (a)
 ${\it\alpha}=1.55$
, (b)
 ${\it\alpha}=0.624$
for both
 $C1$
and
 $C2$
solutions.
It is to be noted that the streak structure does not collapse with
 $R$
, at least not at the same rate as rolls and waves, and appears to extend to a region where
 $r/r_{m}$
is large. We explain this theoretically in § A.2. This is similar to the streak features observed in boundary-layer flows observed by Deguchi & Hall (Reference Deguchi and Hall2014a
).
To distinguish between a collapsing VWI state, where the wave amplitude is large in a critical layer only, and a nonlinear viscous core (NVC) state where axial wave and streak amplitude are of the same order throughout a shrinking core similar to the state discovered by Deguchi & Hall (Reference Deguchi and Hall2014a
) in a different context, we present the contour plots for Reynolds stresses. For a NVC state in a pipe (see § 4.1), we have a core shrinking as
 $R^{-1/4}$
, with
 $1-c=O(R^{-1/2})$
. The critical curve defined by
 $1-c-r^{2}+W(r,{\it\theta})=0$
has no significance in contrast to a VWI state. The Reynolds stresses
 $S_{1}$
and
 $S_{2}$
are defined as
 $$\begin{eqnarray}S_{1}(r,{\it\theta})=\sqrt{\left\langle w\frac{\partial u}{\partial z}\right\rangle ^{2}+\left\langle w\frac{\partial v}{\partial z}\right\rangle ^{2}}\end{eqnarray}$$
and
 $$\begin{eqnarray}S_{2}(r,{\it\theta})=\sqrt{\left\langle u\frac{\partial u}{\partial r}+\frac{v}{r}\frac{\partial u}{\partial {\it\theta}}-\frac{v^{2}}{r}\right\rangle ^{2}+\left\langle u\frac{\partial v}{\partial r}+\frac{v}{r}\frac{\partial v}{\partial {\it\theta}}+\frac{uv}{r}\right\rangle ^{2}}.\end{eqnarray}$$
We define
 $S_{j,m}:=\max _{(r,{\it\theta})}S_{j}(r,{\it\theta})$
and the corresponding maximal location
 $(r_{m},{\it\theta}_{m})$
in polar coordinates.
Figure 21 shows
 $S_{1,m}$
and
 $S_{2,m}$
against
 $R$
for
 ${\it\alpha}=1.55,0.624$
for the
 $C1$
and
 $C2$
solutions. It is clear that
 $S_{2,m}>S_{1,m}$
. Note for the
 $C1$
solution,
 $S_{1,m}$
,
 $S_{2,m}$
scale approximately as
 $R^{-1.27}$
,
 $R^{-1.29}$
respectively, while they scale as
 $R^{-1.34}-R^{-1.35}$
for the
 $C2$
solution. For stress plots, linear fittings involved the range
 $5\times 10^{4}<R<2\times 10^{5}$
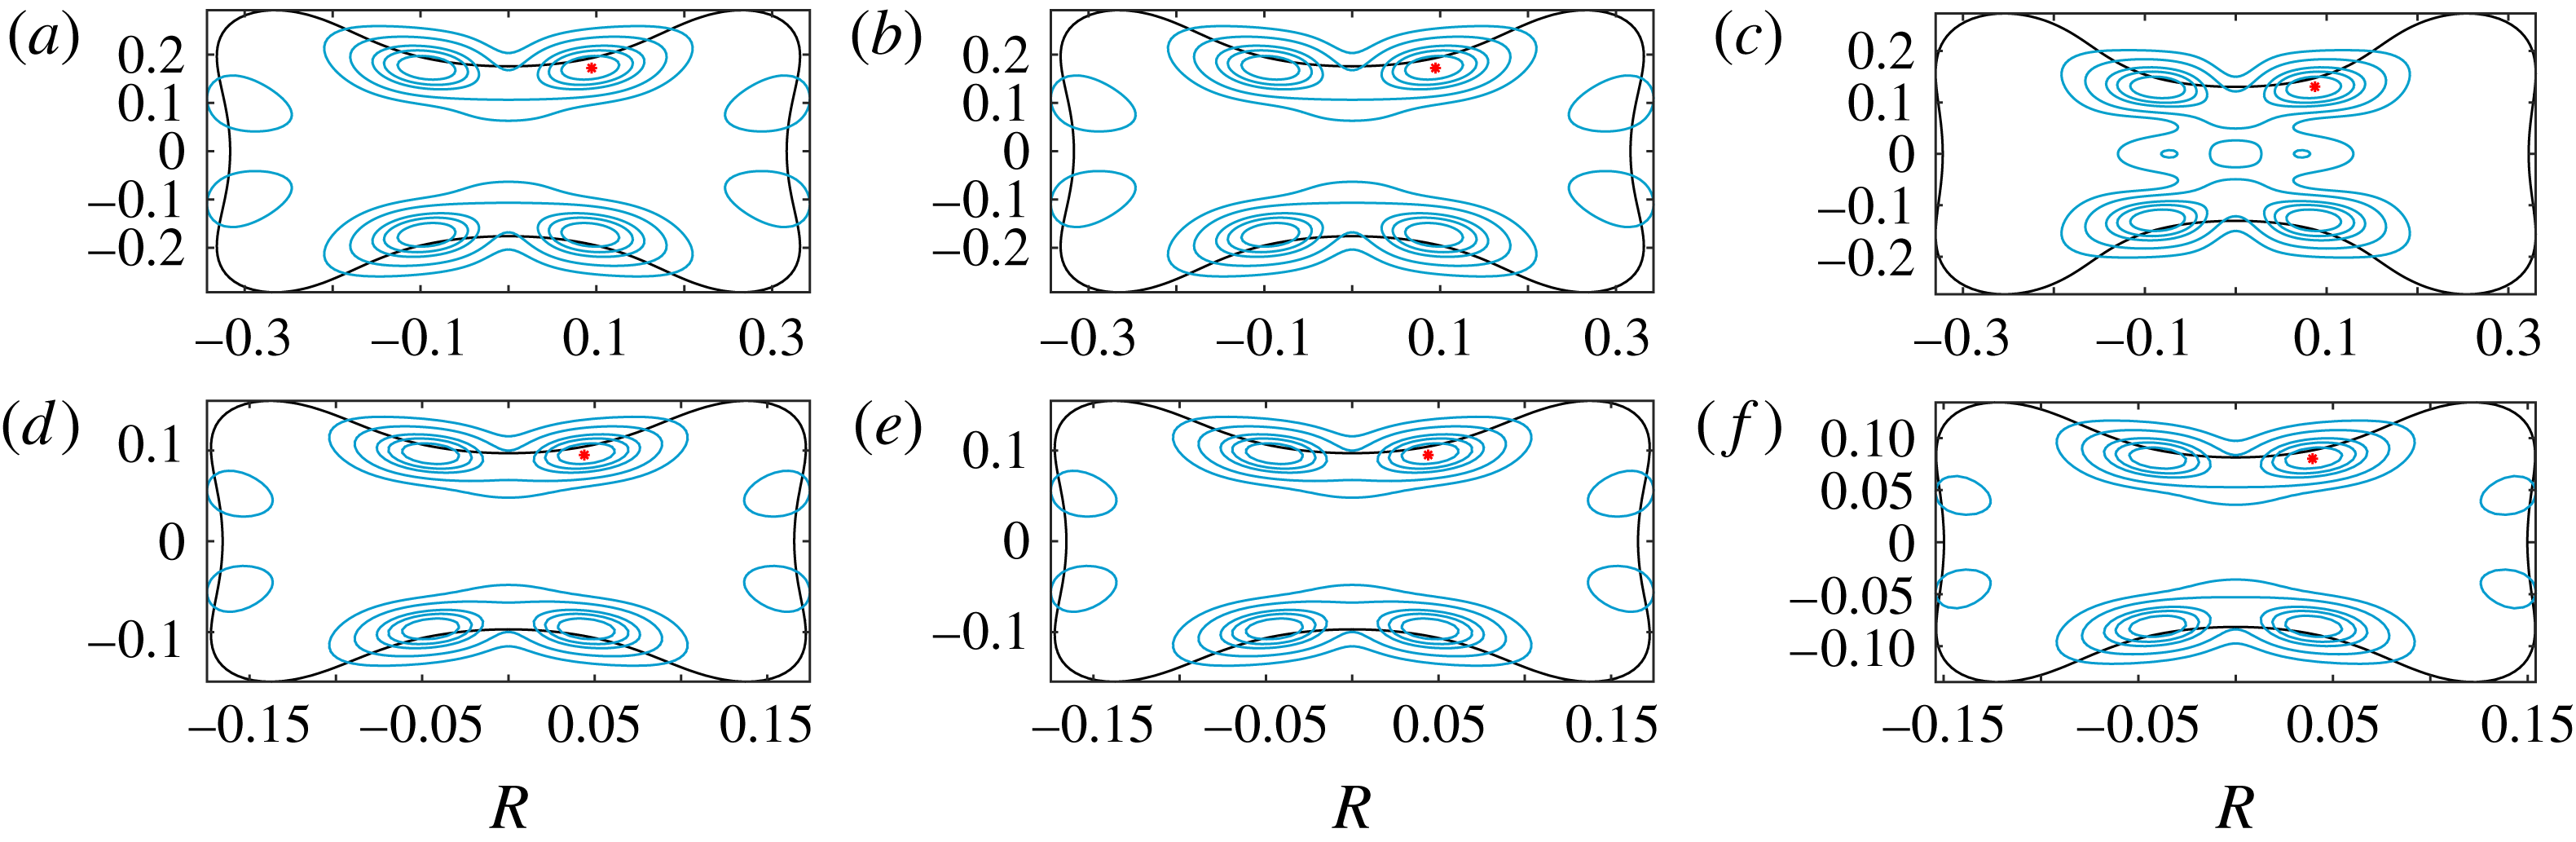
. The red points in figure 22 identify the locations of
 $(r_{m},{\it\theta}_{m})$
where
 $S_{2}$
attains a maximum for the
 $C1$
solution. Contour plots of
 $S_{2}(r,{\it\theta})$
where
 $S_{2}/S_{2,m}=0.9,0.8,0.7,0.5,0.3$
are also shown in the same figure for different
 $R$
and
 ${\it\alpha}$
. Though the contours for higher values of
 $S_{2}/S_{2,m}$
appear centred about the critical curve (where
 $1-c-r^{2}+W(r,{\it\theta})=0$
) shown in black, they are far more spread out than expected for a critical curve (see Deguchi & Hall (Reference Deguchi and Hall2014b
)). We observed similar features for the
 $C2$
solution.
 $S_{2}$
contours for
 $C1$
solution showing 0.9, 0.8, 0.7, 0.5 and
 $0.3\times S_{2,m}$
for three different values of
 $R$
for given
 ${\it\alpha}$
:
 ${\it\alpha}=0.624$
(a,d), 1.55 (b,e), 2.47 (c,f). Critical curve is shown in black, and location of
 $S_{2,m}$
shown in
 $\ast$
. (a–c)
 $Re=10\,420$
, (d–f)
 $Re=191\,020$
.
4 Large
 $R$
asymptotics for travelling waves

We discuss possible large
 $R$
asymptotic structure of travelling waves in a pipe when the axial wavenumber
 ${\it\alpha}$
is independent of
 $R$
. Assume we have a structure at the centre of the pipe of width
 ${\it\delta}\leqslant 1$
. Note
 ${\it\delta}=1$
corresponds to a non-collapsing structure characterized by
 $(1-c)^{-1}=O(1)$
. We introduce the rescaled radial variable
 $\hat{r}$
so that
 $$\begin{eqnarray}r={\it\delta}\hat{r}.\end{eqnarray}$$
Then, on subtracting Poiseiulle flow
 $(1-r^{2})\hat{\boldsymbol{z}}$
, and decomposing the remaining velocity into its axial component and its complement
 $$\begin{eqnarray}\boldsymbol{v}=\tilde{w}\hat{\boldsymbol{z}}+\boldsymbol{v}_{\bot }\end{eqnarray}$$
it may be checked from the Navier–Stokes equation that
 $\boldsymbol{v}$
satisfies
 $$\begin{eqnarray}\displaystyle & & \displaystyle (1-c-{\it\delta}^{2}\hat{r}^{2}+\tilde{w})\partial _{z}\boldsymbol{v}+{\it\delta}^{-1}(\boldsymbol{v}_{\bot }\boldsymbol{\cdot }\boldsymbol{{\rm\nabla}}_{\bot })\boldsymbol{v}-2{\it\delta}\hat{r}(\boldsymbol{v}\boldsymbol{\cdot }\hat{\boldsymbol{r}})\hat{\boldsymbol{z}}\nonumber\\ \displaystyle & & \displaystyle \qquad =-{\it\delta}^{-1}\boldsymbol{{\rm\nabla}}_{\bot }\tilde{p}-\frac{\partial \tilde{p}}{\partial z}\hat{\boldsymbol{z}}+{\it\delta}^{-2}R^{-1}{\it\Delta}_{\bot }\boldsymbol{v}+R^{-1}\frac{\partial ^{2}}{\partial z^{2}}\boldsymbol{v},\end{eqnarray}$$
 $$\begin{eqnarray}{\it\delta}^{-1}\boldsymbol{{\rm\nabla}}_{\bot }\boldsymbol{\cdot }\boldsymbol{v}_{\bot }+\frac{\partial \tilde{w}}{\partial z}=0.\end{eqnarray}$$
We now introduce scaled variables
 $$\begin{eqnarray}\boldsymbol{v}_{\bot }={\it\delta}_{1}\boldsymbol{U}(\hat{r},{\it\theta})+{\it\delta}_{2}\boldsymbol{u}(\hat{r},{\it\theta},z),\end{eqnarray}$$
where
 $\boldsymbol{U}$
is the scaled roll and
 $\boldsymbol{u}$
the scaled wave components. The decomposition is made unique by requiring the axial wavelength average
 $\langle \boldsymbol{u}\rangle =0$
. Similarly, we decompose the axial velocity
 $$\begin{eqnarray}\tilde{w}={\it\delta}_{3}W(\hat{r},{\it\theta})+{\it\delta}_{4}w(\hat{r},{\it\theta},z),\end{eqnarray}$$
where
 $W$
is the scaled streak and
 $w$
is the scaled axial wave velocity. We make the mild assumption that
 ${\it\delta}_{2}{\it\delta}^{-1}$
is of the same order of or smaller than
 ${\it\delta}_{3}$
, which without loss of generality implies
 $$\begin{eqnarray}{\it\delta}_{2}{\it\delta}^{-1}\leqslant {\it\delta}_{3}.\end{eqnarray}$$
(Note replacing any
 ${\it\delta}$
by
 $2{\it\delta}$
or similar multiple of
 ${\it\delta}$
has no effect on the argument since this is equivalent to replacing the variable multiplying
 ${\it\delta}$
by a constant multiple, which does not affect the argument about the existence of the solution.) As will be seen later,
 ${\it\delta}_{4}\leqslant {\it\delta}_{2}/{\it\delta}$
, and so condition (4.7) requires that the largest possible scale of the axial wave amplitude does not exceed the streak. We make no further a priori assumption regarding the scales. We decompose pressure as
 $$\begin{eqnarray}\tilde{p}={\it\delta}_{5}P(\hat{r},{\it\theta})+{\it\delta}_{6}p(\hat{r},{\it\theta},z)\end{eqnarray}$$
and define
 $c_{1}=O_{s}(1)$
, i.e. strictly of order one, so that
 $$\begin{eqnarray}1-c={\it\delta}_{c}c_{1}.\end{eqnarray}$$
The estimated negative exponents of
 ${\it\delta}_{c}$
,
 ${\it\delta}$
,
 ${\it\delta}_{1}{-}{\it\delta}_{4}$
in powers of
 $R$
are obtained from data in
 $R\in (5\times 10^{4},2\times 10^{5})$
for
 $C1$
,
 $C2$
states and are displayed in table 1.
Estimated
 ${\it\gamma}$
values in a
 $R^{-{\it\gamma}}$
scaling.

Now, we return to theoretical arguments. Axial averaging
 $\langle \cdot \rangle$
of (4.3) and (4.4), the projection in the orthogonal plane, results in
 $$\begin{eqnarray}\displaystyle & \displaystyle {\it\delta}^{-1}{\it\delta}_{1}^{2}\boldsymbol{U}\boldsymbol{\cdot }\boldsymbol{{\rm\nabla}}_{\bot }\boldsymbol{U}=-{\it\delta}_{5}{\it\delta}^{-1}\boldsymbol{{\rm\nabla}}_{\bot }P+{\it\delta}_{1}{\it\delta}^{-2}R^{-1}{\it\Delta}_{\bot }\boldsymbol{U}-{\it\delta}^{-1}{\it\delta}_{2}^{2}\langle \boldsymbol{u}\boldsymbol{\cdot }\boldsymbol{{\rm\nabla}}_{\bot }\boldsymbol{u}\rangle -{\it\delta}_{4}{\it\delta}_{2}\left\langle w\frac{\partial }{\partial z}\boldsymbol{u}\right\rangle & \displaystyle \nonumber\\ \displaystyle & & \displaystyle\end{eqnarray}$$
 $$\begin{eqnarray}\displaystyle & \boldsymbol{{\rm\nabla}}_{\bot }\boldsymbol{\cdot }\boldsymbol{U}=0. & \displaystyle\end{eqnarray}$$
In order to enforce the divergence condition (4.11),
 $P$
must appear in the leading-order asymptotics in (4.10). (We could have instead balanced pressure and viscous terms by taking
 ${\it\delta}_{5}={\it\delta}_{1}{\it\delta}^{-1}R^{-1}$
, in which case
 ${\it\delta}_{1}=1/{\it\delta}$
is the distinguished scale that brings inertial terms to the same order as viscous terms. However, this is equivalent to (4.12) and (4.13).) This implies
 $$\begin{eqnarray}{\it\delta}_{5}={\it\delta}_{1}^{2}.\end{eqnarray}$$
For the solutions with collapsing structure for which
 ${\it\delta}\ll 1$
, we impose the property
 $\boldsymbol{U}\rightarrow 0$
as
 $\hat{r}\rightarrow \infty$
(in the inner radial scale). On the other hand, for
 ${\it\delta}=1$
, the solution satisfies the homogeneous boundary condition
 $\boldsymbol{U}=0$
at
 $r=1$
. In either case, the leading-order balance in (4.10) as
 $R\rightarrow \infty$
must involve the viscous term for the steady non-trivial solution. Thus,
 $$\begin{eqnarray}{\it\delta}_{1}{\it\delta}=R^{-1}.\end{eqnarray}$$
Using (4.12) and (4.13), (4.10) reduces to
 $$\begin{eqnarray}\boldsymbol{U}\boldsymbol{\cdot }\boldsymbol{{\rm\nabla}}_{\bot }\boldsymbol{U}=-\boldsymbol{{\rm\nabla}}_{\bot }P+{\it\Delta}_{\bot }\boldsymbol{U}-{\it\delta}_{2}^{2}{\it\delta}_{1}^{-2}\langle \boldsymbol{u}\boldsymbol{\cdot }\boldsymbol{{\rm\nabla}}_{\bot }\boldsymbol{u}\rangle -{\it\delta}_{4}{\it\delta}{\it\delta}_{1}^{-2}{\it\delta}_{2}\langle w\partial _{z}\boldsymbol{u}\rangle .\end{eqnarray}$$
We are constrained to choose without any loss of generality
 $$\begin{eqnarray}\max \left\{{\it\delta}_{2},\sqrt{{\it\delta}_{4}{\it\delta}{\it\delta}_{2}}\right\}\geqslant {\it\delta}_{1}\end{eqnarray}$$
since otherwise
 $\boldsymbol{U}=O_{s}(1)$
is inconsistent with the homogeneous boundary conditions and asymptotically small forcing in (4.10) and (4.14) when
 $R\gg 1$
. We note that the equality in (4.15) will hold if there is no critical layer and the wave magnitude is of the same order whenever
 $\hat{r}=O(1)$
. If there is a critical layer of thickness
 $\hat{{\it\delta}}\ll 1$
in the
 $\hat{r}$
scale, since wave
 $(\boldsymbol{u},w)=O(\hat{{\it\delta}})$
outside the critical layer, then
 $\max \{{\it\delta}_{2}^{2}/{\it\delta}_{1}^{2},{\it\delta}_{4}{\it\delta}{\it\delta}_{2}/{\it\delta}_{1}^{2}\}\gg 1$
in (4.14). In the limit when
 $\hat{{\it\delta}}\rightarrow 0$
, the forcing reduces to a delta function at the critical curve; consistent with
 $\boldsymbol{U}=O_{s}(1)$
in (4.14) provided a constraint between
 $\hat{{\it\delta}},{\it\delta}_{2},{\it\delta}_{1}$
is satisfied, which will be discussed in § 4.2.
Consider now the axial component of
 $\boldsymbol{v}$
in (4.3). Using (4.5) and (4.6), we obtain by axial averaging
 $\langle \cdot \rangle$
and using (4.13), the following equation for streak:
 $$\begin{eqnarray}\boldsymbol{U}\boldsymbol{\cdot }\boldsymbol{{\rm\nabla}}_{\bot }W={\it\Delta}_{\bot }W+\frac{{\it\delta}^{2}}{{\it\delta}_{3}}2\hat{r}\boldsymbol{U}\boldsymbol{\cdot }\hat{\boldsymbol{r}}-\frac{{\it\delta}_{2}{\it\delta}_{4}}{{\it\delta}_{1}{\it\delta}_{3}}\langle \boldsymbol{u}\boldsymbol{\cdot }\boldsymbol{{\rm\nabla}}_{\bot }w\rangle .\end{eqnarray}$$
Requiring solution
 $W=O_{s}(1)$
in (4.16) with homogeneous boundary conditions implies that either the roll or wave term enters into the equation at the leading order, i.e.
 $$\begin{eqnarray}{\it\delta}_{3}={\it\delta}^{2},\quad \text{or}\quad \frac{{\it\delta}_{2}{\it\delta}_{4}}{{\it\delta}_{1}{\it\delta}_{3}}\geqslant 1,\quad {\it\delta}^{2}\leqslant {\it\delta}_{3},\end{eqnarray}$$
where the latter possibility will be ruled out in the ensuing discussions. Consider now the equation for the wave
 $(\boldsymbol{u},w)$
defined uniquely by the property
 $\langle (\boldsymbol{u},w)\rangle =0$
, where
 $\boldsymbol{u}$
is the projection in the perpendicular plane, with radial and azimuthal components
 $(u,v)$
. From the axial component of (4.3), using (4.5), (4.6), (4.13) and (4.16), we obtain
 $$\begin{eqnarray}\displaystyle & & \displaystyle ({\it\delta}_{c}c_{1}-{\it\delta}^{2}\hat{r}^{2}+{\it\delta}_{3}W+{\it\delta}_{4}w)\partial _{z}w+{\it\delta}_{1}{\it\delta}^{-1}(\boldsymbol{U}\boldsymbol{\cdot }\boldsymbol{{\rm\nabla}}_{\bot })w+{\it\delta}_{2}{\it\delta}^{-1}\boldsymbol{u}\boldsymbol{\cdot }\boldsymbol{{\rm\nabla}}_{\bot }w\nonumber\\ \displaystyle & & \displaystyle \quad =-\frac{{\it\delta}_{2}}{{\it\delta}{\it\delta}_{4}}\boldsymbol{u}\boldsymbol{\cdot }\boldsymbol{{\rm\nabla}}_{\bot }(-{\it\delta}^{2}\hat{r}^{2}+{\it\delta}_{3}W)-\frac{{\it\delta}_{6}}{{\it\delta}_{4}}\frac{\partial p}{\partial z}+{\it\delta}^{-2}R^{-1}{\it\Delta}_{\bot }w+R^{-1}\partial _{z}^{2}w+{\it\delta}_{2}{\it\delta}^{-1}\langle \boldsymbol{u}\boldsymbol{\cdot }\boldsymbol{{\rm\nabla}}_{\bot }w\rangle .\nonumber\\ \displaystyle & & \displaystyle\end{eqnarray}$$
For the components of the wave perpendicular to the cylinder, (4.3), with (4.5), (4.6), (4.13) and (4.14) imply
 $$\begin{eqnarray}\displaystyle & & \displaystyle \hspace{-6.0pt}({\it\delta}_{c}c_{1}-{\it\delta}^{2}\hat{r}^{2}+{\it\delta}_{3}W+{\it\delta}_{4}w)\partial _{z}\boldsymbol{u}+{\it\delta}_{1}{\it\delta}^{-1}(\boldsymbol{U}\boldsymbol{\cdot }\boldsymbol{{\rm\nabla}}_{\bot })\boldsymbol{u}+{\it\delta}_{1}{\it\delta}^{-1}(\boldsymbol{u}\boldsymbol{\cdot }\boldsymbol{{\rm\nabla}}_{\bot })\boldsymbol{U}+{\it\delta}_{2}{\it\delta}^{-1}\boldsymbol{u}\boldsymbol{\cdot }\boldsymbol{{\rm\nabla}}_{\bot }\boldsymbol{u}\nonumber\\ \displaystyle & & \displaystyle \hspace{-6.0pt}\quad =-\frac{{\it\delta}_{6}}{{\it\delta}_{2}{\it\delta}}\boldsymbol{{\rm\nabla}}_{\bot }p+{\it\delta}^{-2}R^{-1}{\it\Delta}_{\bot }\boldsymbol{u}+R^{-1}\partial _{z}^{2}\boldsymbol{u}+{\it\delta}_{2}{\it\delta}^{-1}\langle \boldsymbol{u}\boldsymbol{\cdot }\boldsymbol{{\rm\nabla}}_{\bot }\boldsymbol{u}\rangle +{\it\delta}_{4}\langle w\partial _{z}\boldsymbol{u}\rangle ,\end{eqnarray}$$
together with the divergence condition (4.4), which now implies:
 $$\begin{eqnarray}\boldsymbol{{\rm\nabla}}_{\bot }\boldsymbol{\cdot }\boldsymbol{u}+\frac{{\it\delta}_{4}{\it\delta}}{{\it\delta}_{2}}\frac{\partial w}{\partial z}=0.\end{eqnarray}$$
Without any loss of generality,
 $$\begin{eqnarray}{\it\delta}_{4}\leqslant \frac{{\it\delta}_{2}}{{\it\delta}}\end{eqnarray}$$
as otherwise (4.20) results in
 $w$
being independent of
 $z$
to leading order, which from
 $\langle w\rangle =0$
, implies
 $w=0$
, which is inconsistent. Also, note that with condition (4.21), (4.15) implies
 $$\begin{eqnarray}{\it\delta}_{2}\geqslant {\it\delta}_{1}.\end{eqnarray}$$
The parameter
 $c_{1}$
in the system of (4.18)–(4.20) must appear in the leading-order equation since it acts as an eigenvalue for non-zero solution to a system of homogeneous equations for
 $(\boldsymbol{u},w)$
with homogenous boundary conditions. Furthermore, the pressure must come into the leading-order balance in (4.19) as otherwise one cannot satisfy (4.20). Next, the term
 ${\it\delta}^{2}\hat{r}^{2}+{\it\delta}_{3}W$
must appear in the leading-order balance as otherwise using
 $$\begin{eqnarray}\frac{1}{R{\it\delta}^{2}}={\it\delta}_{1}{\it\delta}^{-1}\leqslant {\it\delta}_{2}{\it\delta}^{-1}\leqslant {\it\delta}_{3}\ll {\it\delta}_{c},\end{eqnarray}$$
the resulting leading-order equations
 $c_{1}\partial _{z}w=-{\it\delta}^{2}\partial _{z}\tilde{p}$
,
 $c_{1}\partial _{z}\boldsymbol{u}=-\boldsymbol{{\rm\nabla}}_{\bot }\tilde{p}$
(for some rescaled pressure
 $\tilde{p}$
), together with (4.20) have no non-trivial solution. Thus,
 ${\it\delta}_{c}=O_{s}({\it\delta}_{3})$
since the possibility
 ${\it\delta}_{3}\ll {\it\delta}^{2}$
is ruled out in (4.17a,b
). Therefore, without any loss of generality, we have
 $$\begin{eqnarray}{\it\delta}_{c}={\it\delta}_{3}.\end{eqnarray}$$
Other terms appearing in each of (4.18) and (4.19) have to be of the same or of lower order than this term. For the pressure term to appear at the leading order in (4.19), as it must,
 $$\begin{eqnarray}{\it\delta}_{6}={\it\delta}_{2}{\it\delta}{\it\delta}_{3}.\end{eqnarray}$$
Further, all the other terms appearing in each of (4.18) and (4.19) cannot be any larger than
 ${\it\delta}_{c}$
(or
 ${\it\delta}_{3}$
), which on using (4.13), (4.21), (4.22) and (4.25) implies without any loss of generality
 $$\begin{eqnarray}\frac{1}{R{\it\delta}^{2}}={\it\delta}_{1}{\it\delta}^{-1}\leqslant {\it\delta}_{2}{\it\delta}^{-1}\leqslant {\it\delta}_{3},\quad {\it\delta}^{2}\leqslant {\it\delta}_{3},\quad \text{and}\quad \frac{{\it\delta}_{3}{\it\delta}_{2}}{{\it\delta}{\it\delta}_{4}}\leqslant {\it\delta}_{3}.\end{eqnarray}$$
Note that the last inequality gives
 ${\it\delta}_{4}\geqslant {\it\delta}_{2}/{\it\delta}$
, which together with (4.21) implies
 $$\begin{eqnarray}{\it\delta}_{4}=\frac{{\it\delta}_{2}}{{\it\delta}}.\end{eqnarray}$$
Using (4.22), (4.24) and (4.27) and (4.25), we may rewrite (4.18) and (4.20) as
 $$\begin{eqnarray}\displaystyle & & \displaystyle \hspace{-14.39996pt}\left(c_{1}-\frac{{\it\delta}^{2}}{{\it\delta}_{3}}\hat{r}^{2}+W+\frac{{\it\delta}_{2}}{{\it\delta}{\it\delta}_{3}}w\right)\partial _{z}w+\frac{1}{R{\it\delta}^{2}{\it\delta}_{3}}(\boldsymbol{U}\boldsymbol{\cdot }\boldsymbol{{\rm\nabla}}_{\bot })w+\frac{{\it\delta}_{2}}{{\it\delta}{\it\delta}_{3}}\boldsymbol{u}\boldsymbol{\cdot }\boldsymbol{{\rm\nabla}}_{\bot }w+\boldsymbol{u}\boldsymbol{\cdot }\boldsymbol{{\rm\nabla}}_{\bot }\left(W-\frac{{\it\delta}^{2}}{{\it\delta}_{3}}\hat{r}^{2}\right)\nonumber\\ \displaystyle & & \displaystyle \quad =-{\it\delta}^{2}\frac{\partial p}{\partial z}+\frac{1}{R{\it\delta}^{2}{\it\delta}_{3}}{\it\Delta}_{\bot }w+\frac{1}{R{\it\delta}_{3}}\partial _{z}^{2}w+\frac{{\it\delta}_{2}}{{\it\delta}{\it\delta}_{3}}\langle \boldsymbol{u}\boldsymbol{\cdot }\boldsymbol{{\rm\nabla}}_{\bot }w\rangle\end{eqnarray}$$
 $$\begin{eqnarray}\displaystyle & & \displaystyle \left(c_{1}-\frac{{\it\delta}^{2}}{{\it\delta}_{3}}\hat{r}^{2}+W+\frac{{\it\delta}_{2}}{{\it\delta}{\it\delta}_{3}}w\right)\partial _{z}\boldsymbol{u}+\frac{1}{R{\it\delta}^{2}{\it\delta}_{3}}(\boldsymbol{U}\boldsymbol{\cdot }\boldsymbol{{\rm\nabla}}_{\bot })\boldsymbol{u}+\frac{1}{R{\it\delta}^{2}{\it\delta}_{3}}(\boldsymbol{u}\boldsymbol{\cdot }\boldsymbol{{\rm\nabla}}_{\bot })\boldsymbol{U}+\frac{{\it\delta}_{2}}{{\it\delta}{\it\delta}_{3}}\boldsymbol{u}\boldsymbol{\cdot }\boldsymbol{{\rm\nabla}}_{\bot }\boldsymbol{u}\nonumber\\ \displaystyle & & \displaystyle \quad =-\boldsymbol{{\rm\nabla}}_{\bot }p+\frac{1}{R{\it\delta}^{2}{\it\delta}_{3}}{\it\Delta}_{\bot }\boldsymbol{u}+\frac{1}{R{\it\delta}_{3}}\partial _{z}^{2}\boldsymbol{u}+\frac{{\it\delta}_{2}}{{\it\delta}{\it\delta}_{3}}\langle \boldsymbol{u}\boldsymbol{\cdot }\boldsymbol{{\rm\nabla}}_{\bot }\boldsymbol{u}\rangle +\frac{{\it\delta}_{2}}{{\it\delta}{\it\delta}_{3}}\langle w\partial _{z}\boldsymbol{u}\rangle ,\end{eqnarray}$$
 $$\begin{eqnarray}\boldsymbol{{\rm\nabla}}_{\bot }\boldsymbol{\cdot }\boldsymbol{u}+\frac{\partial w}{\partial z}=0.\end{eqnarray}$$
There are now two distinct possibilities:
 $$\begin{eqnarray}(\text{i})\;\frac{1}{R{\it\delta}^{2}{\it\delta}_{3}}=1,\quad (\text{ii})\;\frac{1}{R{\it\delta}^{2}{\it\delta}_{3}}\ll 1.\end{eqnarray}$$
4.1 Case (i):
$1/R{\it\delta}^{2}{\it\delta}_{3}=1$
, (nonlinear viscous core (NVC))

If we assume (i), then it follows from (4.24) and (4.26a,b ) that
 $$\begin{eqnarray}\frac{1}{R{\it\delta}^{2}}=\frac{{\it\delta}_{1}}{{\it\delta}}=\frac{{\it\delta}_{2}}{{\it\delta}}={\it\delta}_{3}={\it\delta}_{c}.\end{eqnarray}$$
With the above scaling, and (4.27), the equations for rolls, streaks and waves from (4.14), (4.16), (4.28) and (4.29) become
 $$\begin{eqnarray}\displaystyle & \boldsymbol{U}\boldsymbol{\cdot }\boldsymbol{{\rm\nabla}}_{\bot }\boldsymbol{U}=-\boldsymbol{{\rm\nabla}}_{\bot }P+{\it\Delta}_{\bot }\boldsymbol{U}-\langle \boldsymbol{u}\boldsymbol{\cdot }\boldsymbol{{\rm\nabla}}_{\bot }\boldsymbol{u}\rangle -\langle w\partial _{z}\boldsymbol{u}\rangle & \displaystyle\end{eqnarray}$$
 $$\begin{eqnarray}\displaystyle & \boldsymbol{U}\boldsymbol{\cdot }\boldsymbol{{\rm\nabla}}_{\bot }(W-R{\it\delta}^{4}\hat{r}^{2})={\it\Delta}_{\bot }W-\langle \boldsymbol{u}\boldsymbol{\cdot }\boldsymbol{{\rm\nabla}}_{\bot }w\rangle & \displaystyle\end{eqnarray}$$
 $$\begin{eqnarray}\displaystyle & & \displaystyle (c_{1}-R{\it\delta}^{4}\hat{r}^{2}+W+w)\partial _{z}w+(\boldsymbol{U}\boldsymbol{\cdot }\boldsymbol{{\rm\nabla}}_{\bot })w+\boldsymbol{u}\boldsymbol{\cdot }\boldsymbol{{\rm\nabla}}_{\bot }w+\boldsymbol{u}\boldsymbol{\cdot }\boldsymbol{{\rm\nabla}}_{\bot }(W-R{\it\delta}^{4}\hat{r}^{2})\nonumber\\ \displaystyle & & \displaystyle \quad =-{\it\delta}^{2}\frac{\partial p}{\partial z}+{\it\Delta}_{\bot }w+{\it\delta}^{2}\partial _{z}^{2}w+\langle \boldsymbol{u}\boldsymbol{\cdot }\boldsymbol{{\rm\nabla}}_{\bot }w\rangle\end{eqnarray}$$
 $$\begin{eqnarray}\displaystyle & & \displaystyle (c_{1}-R{\it\delta}^{4}\hat{r}^{2}+W+w)\partial _{z}\boldsymbol{u}+(\boldsymbol{U}\boldsymbol{\cdot }\boldsymbol{{\rm\nabla}}_{\bot })\boldsymbol{u}+(\boldsymbol{u}\boldsymbol{\cdot }\boldsymbol{{\rm\nabla}}_{\bot })\boldsymbol{U}+\boldsymbol{u}\boldsymbol{\cdot }\boldsymbol{{\rm\nabla}}_{\bot }\boldsymbol{u}\nonumber\\ \displaystyle & & \displaystyle \quad =-\boldsymbol{{\rm\nabla}}_{\bot }p+{\it\Delta}_{\bot }\boldsymbol{u}+{\it\delta}^{2}\partial _{z}^{2}\boldsymbol{u}+\langle \boldsymbol{u}\boldsymbol{\cdot }\boldsymbol{{\rm\nabla}}_{\bot }\boldsymbol{u}\rangle +\langle w\partial _{z}\boldsymbol{u}\rangle ,\end{eqnarray}$$
along with the divergence conditions (4.11) and (4.30). From (4.17a,b ), (4.32), we obtain
 $$\begin{eqnarray}R{\it\delta}^{4}\leqslant 1.\end{eqnarray}$$
In this case, viscosity and nonlinearity come at the same order in a coupled system of roll, streak and wave equations above. The distinguished scale in (4.33)–(4.36) is clearly
 $$\begin{eqnarray}{\it\delta}=R^{-1/4}\end{eqnarray}$$
since it brings the Poiseuille deviation of axial velocity from unity to the same order as
 $W$
and allows far-field matching. With this choice of
 ${\it\delta}$
, we obtain from (4.27) and (4.32)
 $$\begin{eqnarray}{\it\delta}_{1}=R^{-3/4}={\it\delta}_{2},\quad {\it\delta}_{3}=R^{-1/2}={\it\delta}_{4},\quad {\it\delta}_{c}=R^{-1/2}.\end{eqnarray}$$
Since (4.33)–(4.36) with
 $R{\it\delta}^{4}=1$
is a completely coupled system of roll, streak and wave equations, it is not necessary to separate roll, streak and wave components to obtain parameter-free leading-order asymptotic equations. One can directly look for travelling wave solutions to (4.3) using the scales in (4.39a−c
):
 $$\begin{eqnarray}\displaystyle 1-c=R^{-1/2}c_{1},\quad \boldsymbol{v}=\tilde{w}\hat{\boldsymbol{z}}+\boldsymbol{v}_{\bot }, & & \displaystyle\end{eqnarray}$$
 $$\begin{eqnarray}\displaystyle \tilde{w}=R^{-1/2}{\hat{w}},\quad \boldsymbol{v}_{\bot }=R^{-3/4}\hat{\boldsymbol{v}}_{\bot },\quad \text{and}\quad \tilde{p}=R^{-3/2}\hat{p}. & & \displaystyle\end{eqnarray}$$
This gives rise to the parameter-free canonical nonlinear eigenvalue problem presented in § 4.6. The far-field conditions on different azimuthal Fourier components are readily deduced from discussions in the §§ A.2 and A.4. Unlike roll and wave components, we find the remarkable feature that certain azimuthal streak components do not decay as
 $\hat{r}\rightarrow \infty$
. This is similar to what was observed earlier by Deguchi & Hall (Reference Deguchi and Hall2014a
) in a different context.
4.2 Case (ii):
$1/R{\it\delta}^{2}{\it\delta}_{3}\ll 1$
(VWI: vortex wave interacting states)

We now consider the full implications of assumption (ii). A priori, this involves two sub-cases (ii.a)
 ${\it\delta}_{2}/{\it\delta}={\it\delta}_{3}$
with
 $(\boldsymbol{u},w)=O_{s}(1)$
when
 $\hat{r}=O_{s}(1)$
, i.e. there is no critical-layer phenomena in the scaled
 $(\hat{r},{\it\theta})$
variables and wave nonlinearity is important everywhere in this region; and case (ii.b) where
 $(\boldsymbol{u},w)\ll 1$
outside a critical layer of thickness
 $\hat{{\it\delta}}\ll 1$
(in the
 $\hat{r}$
variable) in the vicinity of the critical curve. In case (ii.a), the only choice of distinguished scale in
 ${\it\delta}$
that brings viscous term to the same order as the nonlinearity corresponds to
 $1/R{\it\delta}^{2}{\it\delta}_{3}=1$
, which is the case already discussed in (i).
Therefore, we are only left with case (ii.b). It is clear that (4.28) and (4.29) reduce to the following leading-order linear wave equations
 $$\begin{eqnarray}\displaystyle & \displaystyle \left(c_{1}-\frac{{\it\delta}^{2}}{{\it\delta}_{3}}\hat{r}^{2}+W\right)\partial _{z}w+\boldsymbol{u}\boldsymbol{\cdot }\boldsymbol{{\rm\nabla}}_{\bot }\left(W-\frac{{\it\delta}^{2}}{{\it\delta}_{3}}\hat{r}^{2}\right)=-{\it\delta}^{2}\frac{\partial p}{\partial z}, & \displaystyle\end{eqnarray}$$
 $$\begin{eqnarray}\displaystyle & \displaystyle \left(c_{1}-\frac{{\it\delta}^{2}}{{\it\delta}_{3}}\hat{r}^{2}+W\right)\partial _{z}\boldsymbol{u}=-\boldsymbol{{\rm\nabla}}_{\bot }p & \displaystyle\end{eqnarray}$$
except in a neighbourhood of
 ${\it\mu}=0$
where
 $$\begin{eqnarray}{\it\mu}:=c_{1}-\frac{{\it\delta}^{2}}{{\it\delta}_{3}}\hat{r}^{2}+W.\end{eqnarray}$$
It is possible to eliminate
 $\boldsymbol{u}$
and
 $w$
altogether from (4.42) and (4.43) using (4.30) and the following Rayleigh equation for pressure to the leading-order outside the critical layer:
 $$\begin{eqnarray}\boldsymbol{{\rm\nabla}}_{\bot }\boldsymbol{\cdot }\left(\frac{\boldsymbol{{\rm\nabla}}_{\bot }p}{\displaystyle \left(c_{1}-\frac{{\it\delta}^{2}}{{\it\delta}_{3}}\hat{r}^{2}+W\right)^{2}}\right)+\frac{{\it\delta}^{2}}{\displaystyle \left(c_{1}-\frac{{\it\delta}^{2}}{{\it\delta}_{3}}\hat{r}^{2}+W\right)^{2}}\frac{\partial ^{2}p}{\partial z^{2}}=0.\end{eqnarray}$$
It is known that when the critical curve is approached, the inviscid
 $(\boldsymbol{u},w)$
blows up like the distance from the critical curve. More precisely
 $\boldsymbol{u}\boldsymbol{\cdot }\boldsymbol{e}_{s}$
and
 $w$
blows up like
 $1/{\it\mu}$
. Note that the scales
 ${\it\delta}_{2}$
and
 ${\it\delta}_{4}={\it\delta}_{2}/{\it\delta}$
for perpendicular components
 $\boldsymbol{u}=(u,v)$
and axial components
 $w$
are based on the maximal value that these attain anywhere in the domain; in particular this is based on their sizes in the critical layer, if there is one. Outside the critical layer, they must drop by a factor of
 $\hat{{\it\delta}}$
, i.e.
 $$\begin{eqnarray}(\boldsymbol{u},w)=O(\hat{{\it\delta}})\text{ outside the critical-layer}.\end{eqnarray}$$
Using (4.21), this implies that the size of the forcing in the roll equation (4.14) is
 ${\it\delta}_{2}^{2}/{\it\delta}_{1}^{2}\gg 1$
inside the critical curve of width
 $\hat{{\it\delta}}$
, whereas it is
 $O(({\it\delta}_{2}^{2}/{\it\delta}_{1}^{2})\hat{{\it\delta}}^{2})$
outside the critical layer. Therefore, in the asymptotic limit
 $R\rightarrow \infty$
, when the critical-layer thickness
 $\hat{{\it\delta}}\rightarrow 0$
, the forcing is in the form
 ${\it\delta}_{2}^{2}{\it\delta}_{1}^{-2}\boldsymbol{F}([\boldsymbol{x}-\boldsymbol{X}_{c}(s)]/\hat{{\it\delta}})$
, which reduces to a delta function at the critical curve
 $\boldsymbol{X}_{c}(s)$
provided
 $$\begin{eqnarray}\frac{{\it\delta}_{2}^{2}}{{\it\delta}_{1}^{2}}=\frac{1}{\hat{{\it\delta}}},\quad \text{or}\quad {\it\delta}_{2}={\it\delta}_{1}\hat{{\it\delta}}^{-1/2}.\end{eqnarray}$$
Now consider the critical-layer thickness
 $\hat{{\it\delta}}$
. Within the layer,
 ${\it\mu}=O(\hat{{\it\delta}})$
, whereas nonlinear terms are of size
 $\hat{{\it\delta}}^{-1}{\it\delta}_{2}{\it\delta}^{-1}{\it\delta}_{3}^{-1}$
and viscous terms are
 $O(\hat{{\it\delta}}^{-2}(R{\it\delta}_{3}{\it\delta}^{2})^{-1})$
. Viscous effects are brought to the same order as the inviscid terms when we assume
 $$\begin{eqnarray}\hat{{\it\delta}}={\it\delta}_{3}^{-1/3}{\it\delta}^{-2/3}R^{-1/3}.\end{eqnarray}$$
If we brought nonlinearity to the leading order within the critical layer, then we are forced to assume
 $\hat{{\it\delta}}=({\it\delta}_{2}{\it\delta}^{-1}{\it\delta}_{3}^{-1})^{1/2}$
, which on using (4.47a,b
), (4.13) implies
 $\hat{{\it\delta}}=(R{\it\delta}^{2}{\it\delta}_{3})^{-2/5}$
, which is far smaller than the expression in (4.48). Therefore, as we approach the critical layer, viscous effects show up before any possible nonlinear effect and the correct expression for critical-layer thickness is given by (4.48). This also implies wave nonlinearity to be small in the critical layer. Note that (4.47a,b
) and (4.48), together with (4.13) imply
 $$\begin{eqnarray}{\it\delta}_{2}={\it\delta}_{1}\hat{{\it\delta}}^{-1/2}=R^{-5/6}{\it\delta}_{3}^{1/6}{\it\delta}^{-2/3}.\end{eqnarray}$$
Thus, using (4.13), (4.27) and (4.49), (4.14) and (4.16) reduce to
 $$\begin{eqnarray}\displaystyle & & \displaystyle \boldsymbol{U}\boldsymbol{\cdot }\boldsymbol{{\rm\nabla}}_{\bot }\boldsymbol{U}=-\boldsymbol{{\rm\nabla}}_{\bot }P+{\it\Delta}_{\bot }\boldsymbol{U}-R^{1/3}{\it\delta}^{2/3}{\it\delta}_{3}^{1/3}\langle \boldsymbol{u}\boldsymbol{\cdot }\boldsymbol{{\rm\nabla}}_{\bot }\boldsymbol{u}\rangle -R^{1/3}{\it\delta}^{2/3}{\it\delta}_{3}^{1/3}\langle w\partial _{z}\boldsymbol{u}\rangle ,\nonumber\\ \displaystyle & & \displaystyle \quad \text{and}\quad \boldsymbol{{\rm\nabla}}_{\bot }\boldsymbol{\cdot }\boldsymbol{U}=0\end{eqnarray}$$
 $$\begin{eqnarray}\boldsymbol{U}\boldsymbol{\cdot }\boldsymbol{{\rm\nabla}}_{\bot }W={\it\Delta}_{\bot }W+\frac{{\it\delta}^{2}}{{\it\delta}_{3}}2\hat{r}\boldsymbol{U}\boldsymbol{\cdot }\hat{\boldsymbol{r}}-\left(\frac{1}{R{\it\delta}^{2}{\it\delta}_{3}}\right)^{2/3}\langle \boldsymbol{u}\boldsymbol{\cdot }\boldsymbol{{\rm\nabla}}_{\bot }w\rangle .\end{eqnarray}$$
With the assumption in this case, it is clear that the wave-averaged term
 $\langle \cdot \rangle =o(1)$
in (4.51). Therefore, it is clear from the streak equation that
 $W=O_{s}(1)$
implies
 $$\begin{eqnarray}{\it\delta}_{3}={\it\delta}^{2}.\end{eqnarray}$$
Therefore, from the scale information gathered thus far, we have
 $$\begin{eqnarray}\displaystyle & \boldsymbol{v}_{\bot }={\it\delta}^{-1}R^{-1}\boldsymbol{U}(\hat{r},{\it\theta})+R^{-5/6}{\it\delta}^{-1/3}\boldsymbol{u}(\hat{r},{\it\theta},z) & \displaystyle\end{eqnarray}$$
 $$\begin{eqnarray}\displaystyle & \tilde{w}={\it\delta}^{2}W(\hat{r},{\it\theta})+R^{-5/6}{\it\delta}^{-4/3}w(\hat{r},{\it\theta},z) & \displaystyle\end{eqnarray}$$
 $$\begin{eqnarray}\displaystyle & \tilde{p}=R^{-2}{\it\delta}^{2}P(\hat{r},{\it\theta})+R^{-5/6}{\it\delta}^{8/3}p(\hat{r},{\it\theta},z) & \displaystyle\end{eqnarray}$$
and
 $$\begin{eqnarray}1-c={\it\delta}^{2}c_{1}.\end{eqnarray}$$
From (4.49) and (4.52), the critical-layer thickness in the
 $\hat{r}$
variable becomes
 $$\begin{eqnarray}\hat{{\it\delta}}=(R{\it\delta}^{4})^{-1/3}.\end{eqnarray}$$
Note that
 ${\it\delta}$
thus far is arbitrary except that (4.52) and
 $1/R{\it\delta}_{3}{\it\delta}^{2}\ll 1$
imply
 $$\begin{eqnarray}{\it\delta}\gg R^{-1/4}.\end{eqnarray}$$
The restriction on
 ${\it\delta}$
when
 ${\it\delta}\ll 1$
arises from higher-order solvability as will be seen shortly. With the scalings derived thus far, from definitions of Reynolds stresses
 $S_{1}$
and
 $S_{2}$
in (3.8) and (3.9), it follows that
 $$\begin{eqnarray}S_{1},S_{2}=O_{s}(R^{-5/3}{\it\delta}^{-5/3}).\end{eqnarray}$$
Using the scalings inferred in (4.53)–(4.56), (4.28)–(4.29) become
 $$\begin{eqnarray}\displaystyle {\it\mu}\partial _{z}w+\boldsymbol{u}\boldsymbol{\cdot }\boldsymbol{{\rm\nabla}}_{\bot }{\it\mu}-{\it\epsilon}{\it\Delta}_{\bot }w=F_{3}, & & \displaystyle\end{eqnarray}$$
 $$\begin{eqnarray}\displaystyle {\it\mu}\partial _{z}\boldsymbol{u}+\boldsymbol{{\rm\nabla}}_{\bot }p-{\it\epsilon}{\it\Delta}_{\bot }\boldsymbol{u}=\boldsymbol{F}, & & \displaystyle\end{eqnarray}$$
 $$\begin{eqnarray}{\it\epsilon}=\frac{1}{R{\it\delta}^{4}},\quad {\it\mu}=c_{1}-\hat{r}^{2}+W\end{eqnarray}$$
 $$\begin{eqnarray}\displaystyle & F_{3}=-{\it\delta}^{2}\partial _{z}p-{\it\epsilon}\boldsymbol{U}\boldsymbol{\cdot }\boldsymbol{{\rm\nabla}}_{\bot }w-{\it\epsilon}^{5/6}[\boldsymbol{u}\boldsymbol{\cdot }\boldsymbol{{\rm\nabla}}_{\bot }w+w\partial _{z}w-\langle \boldsymbol{u}\boldsymbol{\cdot }\boldsymbol{{\rm\nabla}}_{\bot }w\rangle ]+{\it\epsilon}{\it\delta}^{2}\partial _{z}^{2}w & \displaystyle\end{eqnarray}$$
 $$\begin{eqnarray}\displaystyle & \boldsymbol{F}=-{\it\epsilon}\boldsymbol{U}\boldsymbol{\cdot }\boldsymbol{{\rm\nabla}}_{\bot }\boldsymbol{u}-{\it\epsilon}^{5/6}[\boldsymbol{u}\boldsymbol{\cdot }\boldsymbol{{\rm\nabla}}_{\bot }\boldsymbol{u}+w\partial _{z}\boldsymbol{u}-\langle \boldsymbol{u}\boldsymbol{\cdot }\boldsymbol{{\rm\nabla}}_{\bot }\boldsymbol{u}+w\partial _{z}\boldsymbol{u}\rangle ]+{\it\epsilon}{\it\delta}^{2}\partial _{z}^{2}\boldsymbol{u}. & \displaystyle\end{eqnarray}$$
It is convenient to define
 $\boldsymbol{X}=(\boldsymbol{u},w)$
, which is in the space of divergence-free functions, satisfying zero boundary conditions. Note that the full equations (4.60) and (4.61), without any approximation, may be compactly written as
 $$\begin{eqnarray}\mathscr{L}\boldsymbol{X}=\boldsymbol{R}\end{eqnarray}$$
where
 $\boldsymbol{R}=(\boldsymbol{F},F_{3})$
, and the projection
 $[\mathscr{L}\boldsymbol{X}]_{\bot }$
is given by left-hand side of (4.61), while the axial component of
 $[\mathscr{L}\boldsymbol{X}]_{\Vert }$
is given by (4.60). Note that the pressure
 $p$
, up to an unimportant additive constant, is implicitly determined in terms of
 $\boldsymbol{X}$
by requiring
 $\boldsymbol{X}$
to be divergence free. We define the space of functions
 $\{\boldsymbol{Y}\}$
, where
 $\boldsymbol{Y}=(\tilde{\boldsymbol{u}},\tilde{w})$
satisfies zero boundary condition, and is dual to the space of functions
 $\{\boldsymbol{X}\}$
through the non-degenerate pairing
 $$\begin{eqnarray}(\boldsymbol{Y},\boldsymbol{X})=\int _{{\it\Omega}}(\tilde{\boldsymbol{u}}^{\ast }\boldsymbol{\cdot }\boldsymbol{u}+\tilde{w}^{\ast }w)\,\text{d}V,\end{eqnarray}$$
where
 ${\it\Omega}$
is the domain inside the cylinder domain truncated to a
 $z$
-period. It is not difficult to note that the adjoint
 $\mathscr{L}^{\dagger }$
defined so that its projection in the perpendicular plane and along the pipe axis are defined by
 $$\begin{eqnarray}[\mathscr{L}^{\dagger }\boldsymbol{Y}]_{\bot }=-{\it\mu}\partial _{z}\tilde{\boldsymbol{u}}-{\it\epsilon}{\it\Delta}_{\bot }\tilde{\boldsymbol{u}}-{\it\mu}\boldsymbol{{\rm\nabla}}_{\bot }\tilde{w}+\boldsymbol{{\rm\nabla}}_{\bot }q\end{eqnarray}$$
and the axial component of
 $[\mathscr{L}^{\dagger }\boldsymbol{Y}]_{\Vert }$
is given by
 $$\begin{eqnarray}[\mathscr{L}^{\dagger }\boldsymbol{Y}]_{\Vert }=-2{\it\mu}\partial _{z}\tilde{w}-{\it\epsilon}{\it\Delta}_{\bot }\tilde{w}+\partial _{z}q,\end{eqnarray}$$
where the dual space is constrained by the two-dimensional divergence equation
 $$\begin{eqnarray}\boldsymbol{{\rm\nabla}}_{\bot }\boldsymbol{\cdot }\tilde{\boldsymbol{u}}=0,\end{eqnarray}$$
which determines
 $q$
in terms of
 $(\tilde{\boldsymbol{u}},\tilde{w})$
up to a constant. Noting the scaling (4.46) of the waves outside the critical layer of thickness
 $\hat{{\it\delta}}$
, given by (4.48), it follows that the contribution of waves to
 $F_{3}$
and
 $\boldsymbol{F}$
given in (4.63) and (4.64) is relatively small and to the leading order, we have the linear eigenvalue problem
 $$\begin{eqnarray}\mathscr{L}\boldsymbol{X}=0.\end{eqnarray}$$
Without loss of generality, we may seek a leading-order solution in the form
 $$\begin{eqnarray}\boldsymbol{X}=\text{e}^{\text{i}{\it\alpha}z}(\boldsymbol{u}^{(0)},\boldsymbol{w}^{(0)})+\text{c.c.}\end{eqnarray}$$
Note that
 ${\it\epsilon}{\it\Delta}_{\bot }$
term is retained in
 $\mathscr{L}$
to provide a uniformly valid representation as
 ${\it\epsilon}\rightarrow 0$
in the critical and boundary layers. It is convenient to denote the leading-order eigenvalue and eigenvectors as
 $(c_{1,0},\boldsymbol{X}^{(0)})$
which itself will have an asymptotic expansion in
 ${\it\epsilon}$
, which poses no problem in the following argument. The behaviour of
 $\boldsymbol{X}^{(0)}$
outside the critical and boundary layers is inviscid to the leading order and given by
 $$\begin{eqnarray}\boldsymbol{X}^{(0)}\sim \hat{{\it\delta}}\text{e}^{\text{i}{\it\alpha}z}(\boldsymbol{u}^{(I)},w^{(I)})+\text{c.c.},\end{eqnarray}$$
where they satisfy
 $$\begin{eqnarray}\displaystyle & \text{i}{\it\alpha}{\it\mu}_{0}\boldsymbol{u}^{(I)}=-\boldsymbol{{\rm\nabla}}_{\bot }p^{(I)} & \displaystyle\end{eqnarray}$$
 $$\begin{eqnarray}\displaystyle & \text{i}{\it\alpha}{\it\mu}_{0}w^{(I)}=-\boldsymbol{u}^{(I)}\boldsymbol{\cdot }\boldsymbol{{\rm\nabla}}_{\bot }{\it\mu} & \displaystyle\end{eqnarray}$$
 $$\begin{eqnarray}\displaystyle & \boldsymbol{{\rm\nabla}}_{\bot }\boldsymbol{\cdot }\boldsymbol{u}^{(I)}+\text{i}{\it\alpha}w^{(I)}=0, & \displaystyle\end{eqnarray}$$
with
 $$\begin{eqnarray}{\it\mu}_{0}=c_{1,0}-\hat{r}^{2}+W.\end{eqnarray}$$
It is possible to eliminate
 $(\boldsymbol{u}^{(I)},w^{(I)})$
from (4.73)–(4.75) in terms of scaled pressure which satisfies the Rayleigh equation
 $$\begin{eqnarray}\boldsymbol{{\rm\nabla}}_{\bot }\boldsymbol{\cdot }\left(\frac{\boldsymbol{{\rm\nabla}}_{\bot }p^{(I)}}{{\it\mu}_{0}^{2}}\right)=0.\end{eqnarray}$$
Within the inviscid approximation, appropriate boundary conditions for
 $p^{(I)}$
inherited from
 $\boldsymbol{u}^{(I)}\boldsymbol{\cdot }\hat{\boldsymbol{r}}=0$
at the wall, would require
 $$\begin{eqnarray}\partial _{r}p^{(I)}({\it\delta}^{-1},{\it\theta})=0.\end{eqnarray}$$
The Rayleigh problem can also be posed in a slightly more convenient manner by introducing the conjugate variable
 ${\it\Phi}$
so that
 $$\begin{eqnarray}-\!\text{i}{\it\alpha}{\it\mu}_{0}u^{(I)}=\partial _{\hat{r}}p^{(I)}=\frac{{\it\mu}_{0}^{2}}{\hat{r}}\partial _{{\it\theta}}{\it\Phi},\quad -\text{i}{\it\alpha}\hat{r}{\it\mu}_{0}v^{(0)}=\partial _{{\it\theta}}p^{(0)}=-\hat{r}{\it\mu}_{0}^{2}\partial _{\hat{r}}{\it\Phi}.\end{eqnarray}$$
Then,
 ${\it\Phi}$
satisfies the elliptic equation
 $$\begin{eqnarray}\boldsymbol{{\rm\nabla}}_{\bot }\boldsymbol{\cdot }({\it\mu}_{0}^{2}\boldsymbol{{\rm\nabla}}_{\bot }{\it\Phi})=0\end{eqnarray}$$
with wall boundary conditions now translating to the Dirichlet condition
 $$\begin{eqnarray}{\it\Phi}({\it\delta}^{-1},{\it\theta})=0.\end{eqnarray}$$
From this, it easy to see that when the critical curve is approached, i.e.
 ${\it\mu}_{0}\rightarrow 0$
, then the component of wave velocity tangent to the critical curve
 $\boldsymbol{u}^{(I)}\boldsymbol{\cdot }\boldsymbol{e}_{s}$
blows up as
 $1/{\it\mu}_{0}$
while
 $\boldsymbol{e}_{s}\boldsymbol{\cdot }\boldsymbol{{\rm\nabla}}_{\bot }p^{(I)}=O(1)$
and the normal component
 $\boldsymbol{e}_{N}\boldsymbol{\cdot }\boldsymbol{{\rm\nabla}}_{\bot }p^{(I)}=O({\it\mu}_{0})$
. Also from the inviscid equation (4.74) for
 $w^{(I)}$
, it follows that
 $w^{(I)}$
also blows up as
 ${\it\mu}_{0}^{-1}$
. This information allows one to construct an inner equation when
 ${\it\mu}_{0}=O(\hat{{\it\delta}})=O({\it\epsilon}^{1/3})$
where
 $\boldsymbol{e}_{s}\boldsymbol{\cdot }\boldsymbol{u}^{(I)},w^{(I)}=O(\hat{{\it\delta}}^{-1})={\it\epsilon}^{-1/3}$
, implying from (4.72), and matching with the inner solution involving Airy functions, that
 $\boldsymbol{X}^{(0)}$
must be
 $O(1)$
in the critical layer, while
 $\boldsymbol{X}^{(0)}=O({\it\epsilon}^{1/3})$
outside. There is also a boundary layer at the wall where the inviscid behaviour of
 $\boldsymbol{X}^{(0)}$
is modified, but this does not play a role in the argument below since waves decay fast in
 $\hat{r}$
(see § A.4) and therefore, the wall boundary layer for waves is weak. Note that the leading-order analysis does not constrain
 ${\it\delta}$
or
 ${\it\alpha}$
. For this, a higher-order correction needs to be included.
It is convenient to expand
 $\boldsymbol{X}$
and the corresponding scaled wave speed
 $c_{1}$
:
 $$\begin{eqnarray}\boldsymbol{X}=\boldsymbol{X}^{(0)}+\boldsymbol{X}^{(1)}+\cdots \!,\quad c_{1}=c_{1,0}+c_{1,1}+\cdots \!.\end{eqnarray}$$
Aside from assuming that
 $\boldsymbol{X}^{(1)}\ll \boldsymbol{X}^{(0)},c_{1,1}\ll c_{1,0}$
, it is convenient not to assume particular scalings in the higher-order correction at this stage. Then, it is clear from (4.65) that
 $\boldsymbol{X}^{1}$
satisfies
 $$\begin{eqnarray}\mathscr{L}^{(0)}\boldsymbol{X}^{(1)}=\boldsymbol{R}^{(0)}-c_{1,1}\partial _{z}\boldsymbol{X}^{(0)},\end{eqnarray}$$
where
 $\mathscr{L}^{(0)}$
is the operator
 $\mathscr{L}$
with
 ${\it\mu}={\it\mu}_{0}$
and
 $$\begin{eqnarray}\displaystyle [\boldsymbol{R}^{(0)}]_{\bot }=\boldsymbol{F}^{(0)} & = & \displaystyle \text{e}^{\text{i}{\it\alpha}z}(-{\it\epsilon}\boldsymbol{U}\boldsymbol{\cdot }\boldsymbol{{\rm\nabla}}_{\bot }\boldsymbol{u}^{(0)}-{\it\epsilon}{\it\alpha}^{2}{\it\delta}^{2}\boldsymbol{u}^{(0)})\nonumber\\ \displaystyle & & \displaystyle -\,{\it\epsilon}^{5/6}\text{e}^{2\text{i}{\it\alpha}z}(\boldsymbol{u}^{(0)}\boldsymbol{\cdot }\boldsymbol{{\rm\nabla}}_{\bot }\boldsymbol{u}^{(0)}+\text{i}{\it\alpha}w^{(0)}\boldsymbol{u}^{(0)})+\text{c.c.}\end{eqnarray}$$
 $$\begin{eqnarray}\displaystyle [\boldsymbol{R}^{(0)}]_{\Vert }=F_{3}^{(0)} & = & \displaystyle \text{e}^{\text{i}{\it\alpha}z}(-\text{i}{\it\alpha}{\it\delta}^{2}p^{(0)}-{\it\epsilon}\boldsymbol{U}\boldsymbol{\cdot }\boldsymbol{{\rm\nabla}}_{\bot }w^{(0)}-{\it\epsilon}{\it\delta}^{2}{\it\alpha}^{2}w^{(0)})\nonumber\\ \displaystyle & & \displaystyle -\,{\it\epsilon}^{5/6}\text{e}^{2\text{i}{\it\alpha}z}(\boldsymbol{u}^{(0)}\boldsymbol{\cdot }\boldsymbol{{\rm\nabla}}_{\bot }w^{(0)}+\text{i}{\it\alpha}[w^{(0)}]^{2})+\text{c.c.}\end{eqnarray}$$
The solvability condition (we are assuming, as expected, that the null space of
 $\mathscr{L}^{\dagger }$
is orthogonal to the range of
 $\mathscr{L}$
) implies
 $$\begin{eqnarray}c_{1,1}(\boldsymbol{Y},\partial _{z}\boldsymbol{X}^{(0)})=(\boldsymbol{Y},\boldsymbol{R}^{(0)}),\end{eqnarray}$$
where
 $\boldsymbol{Y}=(\tilde{\boldsymbol{u}},\tilde{w})$
is any solution to the adjoint problem
 $$\begin{eqnarray}\mathscr{L}^{\dagger }\boldsymbol{Y}=0,\end{eqnarray}$$
where the perpendicular and parallel projections of
 $\mathscr{L}^{\dagger }\boldsymbol{Y}$
are defined by (4.67) and (4.68), with
 ${\it\mu}={\it\mu}_{0}$
. We now look at the null space of
 $\mathscr{L}^{\dagger }$
.
The leading-order behaviour of the solution to
 $\mathscr{L}^{\dagger }\boldsymbol{Y}=0$
as
 ${\it\epsilon}\rightarrow 0$
is discussed in § A.1. It emerges that if we rescaled variables so that
 $\boldsymbol{Y}=(\tilde{\boldsymbol{u}},\tilde{w})=O_{s}(1)$
inside the critical layer of thickness
 $\hat{{\it\delta}}={\it\epsilon}^{1/3}$
, then outside the critical layer,
 $$\begin{eqnarray}\boldsymbol{Y}=(\tilde{\boldsymbol{u}},\tilde{w})=O(\hat{{\it\delta}}^{2})=O({\it\epsilon}^{2/3}).\end{eqnarray}$$
Now, we are ready to estimate the terms on the left- and right-hand side of (4.86). Because of (4.46) and (4.88), with
 $\hat{{\it\delta}}={\it\epsilon}^{1/3}$
, it follows that the contribution from outside the critical layer to
 $(\boldsymbol{Y},\partial _{z}\boldsymbol{X}^{(0)})$
is
 $O({\it\epsilon})$
, which is far smaller than the
 $O({\it\epsilon}^{1/3})$
contribution from the critical layer, noting the integrand to be
 $O_{s}(1)$
and the thickness to be
 $O(\hat{{\it\delta}})=O({\it\epsilon}^{1/3})$
. Therefore
 $$\begin{eqnarray}(\boldsymbol{Y},\partial _{z}\boldsymbol{X}^{(0)})=O_{s}({\it\epsilon}^{1/3}).\end{eqnarray}$$
Now, we consider the scaling of the right-hand side in (4.86). We note that inside the critical layer,
 $\boldsymbol{U}\boldsymbol{\cdot }\boldsymbol{e}_{s}=O(1)$
and
 $\boldsymbol{U}\boldsymbol{\cdot }\boldsymbol{e}_{N}=O(\hat{{\it\delta}})=O({\it\epsilon}^{1/3})$
, which follows from the continuity equation (4.11). Therefore,
 $$\begin{eqnarray}\langle \text{e}^{-\text{i}{\it\alpha}z}[\boldsymbol{R}^{(0)}]_{\bot }\rangle =-{\it\epsilon}\boldsymbol{U}\boldsymbol{\cdot }\boldsymbol{{\rm\nabla}}_{\bot }\boldsymbol{u}^{(0)}=O({\it\epsilon}),\end{eqnarray}$$
whereas it is
 $O({\it\epsilon}^{4/3})$
outside the layer. On the other hand, we have inside the critical layer
 $$\begin{eqnarray}\langle \text{e}^{-\text{i}{\it\alpha}z}[\boldsymbol{R}^{(0)}]_{\Vert }\rangle =-\text{i}{\it\alpha}{\it\delta}^{2}p^{(0)}-{\it\epsilon}\boldsymbol{U}\boldsymbol{\cdot }\boldsymbol{{\rm\nabla}}_{\bot }w^{(0)}=O({\it\delta}^{2},{\it\epsilon}),\end{eqnarray}$$
whereas outside it is
 $O({\it\delta}^{2},{\it\epsilon}^{4/3})$
. Note that the pressure term outside remains of the same order as inside the critical layer. Therefore, from expression of the inner product, it follows that
 $$\begin{eqnarray}(\boldsymbol{Y},\boldsymbol{R}^{(0)})=O({\it\delta}^{2}{\it\epsilon}^{1/3},{\it\epsilon}^{4/3})\end{eqnarray}$$
is dominated by the contribution from the critical layer. It follows from (4.86) that
 $c_{1,1}=O({\it\delta}^{2},{\it\epsilon})$
, with the
 $O({\it\delta}^{2})$
term including
 ${\it\alpha}$
dependence, whereas there is no
 ${\it\alpha}$
dependence in the
 $O({\it\epsilon})$
term. Note that this calculation must result in
 $$\begin{eqnarray}\text{Im}\;c_{11}=0.\end{eqnarray}$$
With the normalization already chosen, the complex coefficients of
 ${\it\delta}^{2}$
and
 ${\it\epsilon}$
on the right-hand side of (4.92) are completely determined by the eigensolutions of the leading-order equation both for the original as well as the adjoint problems. (We are assuming, as might be expected, the non-degeneracy of the eigenvalues.) Therefore, the only generic way in which (4.93) can be enforced is by requiring
 $$\begin{eqnarray}{\it\delta}^{2}={\it\epsilon}=\frac{1}{R{\it\delta}^{4}},\quad \text{implying }{\it\delta}=R^{-1/6}.\end{eqnarray}$$
Note that from the same equation, since
 ${\it\alpha}$
appears together with
 ${\it\delta}^{2}$
in the
 $O({\it\delta}^{2})$
term, the constraint (4.93) also constrains
 ${\it\alpha}$
.
4.3 Far-field roll behaviour
Using
 ${\it\delta}_{3}={\it\delta}^{2}$
in (4.50a,b
) and taking the curl
 $\boldsymbol{{\rm\nabla}}_{\bot }\times$
, we obtain the two-dimensional roll-vorticity equation:
 $$\begin{eqnarray}{\it\Delta}_{\bot }{\it\omega}=\boldsymbol{U}\boldsymbol{\cdot }\boldsymbol{{\rm\nabla}}_{\bot }{\it\omega}+(R{\it\delta}^{4})^{1/3}\hat{\boldsymbol{z}}\boldsymbol{\cdot }(\boldsymbol{{\rm\nabla}}_{\bot }\times \langle \boldsymbol{u}\boldsymbol{\cdot }\boldsymbol{{\rm\nabla}}_{\bot }\boldsymbol{u}+w\partial _{z}\boldsymbol{u}\rangle ),\end{eqnarray}$$
where the roll velocity
 $\boldsymbol{U}=(U,V)=((1/\hat{r}){\it\psi}_{{\it\theta}},{\it\psi}_{\hat{r}})$
. Here
 ${\it\psi}$
is related to streamwise vorticity
 ${\it\omega}$
through
 $$\begin{eqnarray}-\!{\it\Delta}_{\bot }{\it\psi}={\it\omega}.\end{eqnarray}$$
It has been argued in § A.2 that in the far field, where
 $\hat{r}\gg 1$
, the contribution from the wave terms in (A 32) are negligible and systematic analysis of (A 32) suggests that if we express
 $$\begin{eqnarray}{\it\psi}=\mathop{\sum }_{n=1}^{\infty }{\it\psi}_{m_{0}n}\sin (m_{0}n{\it\theta}),\end{eqnarray}$$
then for rolls with 4-fold (i.e.
 $m_{0}=4$
in (4.97)) azimuthal symmetry, as observed for the
 $C2$
solution, we have
 $$\begin{eqnarray}{\it\psi}_{4n}\sim \hat{r}^{-2n}\quad \text{for }n\geqslant 1.\end{eqnarray}$$
This implies that the corresponding roll velocity components
 $$\begin{eqnarray}(U_{4n},V_{4n})\sim \hat{r}^{-2n-1}\quad \text{for }n\geqslant 1,\end{eqnarray}$$
On the other hand, for only 2-fold azimuthal symmetry (
 $m_{0}=2$
) of rolls, as observed for the
 $C1$
solution, we argue in § A.2 that
 $$\begin{eqnarray}{\it\psi}_{2},{\it\psi}_{4}\sim \hat{r}^{-2}\quad \text{and}\quad {\it\psi}_{2n}\sim \hat{r}^{-2n+2}\ln \hat{r}\quad \text{for }n\geqslant 3,\end{eqnarray}$$
implying
 $$\begin{eqnarray}(U_{2},V_{2}),(U_{4},V_{4})=O(\hat{r}^{-3})\quad \text{and}\quad (U_{2n},V_{2n})\sim \hat{r}^{-2n+1}\ln \hat{r}\quad \text{for }n\geqslant 3.\end{eqnarray}$$
4.4 Far-field streak behaviour
Note that the streak satisfies
 $$\begin{eqnarray}{\it\Delta}_{\bot }W=-2\hat{r}U+\boldsymbol{{\rm\nabla}}_{\bot }\boldsymbol{\cdot }(\boldsymbol{U}W)+(R{\it\delta}^{4})^{-2/3}\langle \boldsymbol{{\rm\nabla}}_{\bot }\boldsymbol{\cdot }(\boldsymbol{u}w)\rangle .\end{eqnarray}$$
Once again the wave contribution is argued to be sub-dominant in this equation in the far field, and using the far-field behaviour of rolls, it has been shown in § A.3 that if we express
 $$\begin{eqnarray}W(\hat{r},{\it\theta})=\mathop{\sum }_{n=0}^{\infty }W_{nm_{0}}(\hat{r})\cos (nm_{0}{\it\theta}),\end{eqnarray}$$
then in the case of streaks with 4-fold symmetry (
 $m_{0}=4$
),
 $$\begin{eqnarray}W_{0}\sim \hat{r}^{-2},\quad W_{4n}\sim \hat{r}^{-2n+2}\quad \text{for }n\geqslant 1,\end{eqnarray}$$
so that the
 $\hat{r}\gg 1$
behaviour of
 $W$
is dominated by the
 $n=1$
mode resulting in
 $W(\hat{r},{\it\theta})\sim W_{4}(\hat{r})\cos (4{\it\theta})\sim \cos (4{\it\theta})$
. On the other hand, when
 $m_{0}=2$
,
 $$\begin{eqnarray}W_{0}(r)\sim \hat{r}^{-2},\quad W_{2}\sim {\hat{c}}_{2},W_{4}\sim {\hat{c}}_{4}\quad \text{and}\quad W_{2n}\sim \hat{r}^{4-2n}\ln \hat{r}\quad \text{for }n\geqslant 3,\end{eqnarray}$$
for some constant
 $c_{2},c_{4}$
. In this case, the
 $\hat{r}\gg 1$
asymptotics are dominated by the 2 and 4 modes resulting in
 $W(\hat{r},{\it\theta})\sim {\hat{c}}_{2}\cos (2{\it\theta})+{\hat{c}}_{4}\cos (4{\it\theta})$
.
4.5 Far-field wave behaviour
In the regime
 ${\it\delta}^{-1}(1-R^{-1/2+{\it\epsilon}})\gg \hat{r}\gg 1$
, when nonlinearity as well as wall boundary-layer effects are absent, the equation for pressure (4.45) with the representation
 $$\begin{eqnarray}p=\mathop{\sum }_{m=0}^{\infty }p_{m}(\hat{r},z)\cos (m{\it\theta}),\end{eqnarray}$$
satisfies the following equation to leading order:
 $$\begin{eqnarray}\partial _{\hat{r}}^{2}p_{m}-\frac{3}{\hat{r}}\partial _{\hat{r}}p_{m}-\frac{m^{2}}{\hat{r}^{2}}p_{m}+{\it\delta}^{2}\partial _{z}^{2}p_{m}=0.\end{eqnarray}$$
It has been shown in § A.4 that
 $$\begin{eqnarray}p_{m}(\hat{r},z)\sim \hat{D}_{l,m}\text{e}^{\text{i}l{\it\alpha}z}(\hat{r})^{2-\sqrt{m^{2}+4}}+\text{c.c.},\end{eqnarray}$$
from which it may be deduced that the
 $m$
-azimuthal mode for
 $m\geqslant 2$
 $$\begin{eqnarray}(u_{m},v_{m})\sim \hat{r}^{-\sqrt{m^{2}+4}-1}.\end{eqnarray}$$
By using (4.74), it may be deduced that the corresponding streamwise component
 $$\begin{eqnarray}w_{m}\sim \hat{r}^{-\sqrt{m^{2}+4}-2}.\end{eqnarray}$$
The results (A 74) and (A 75) are valid for any
 $l\geqslant 1$
, though the constants omitted in the
 ${\sim}$
relation can depend on
 $l$
.
4.6 The canonical parameter-free problem for NVC states
Using scaled variables (4.40a,b ) and (4.41a−c ), (4.3) transforms into the following set of scaled nonlinear equations
 $$\begin{eqnarray}\displaystyle & (c_{1}-\hat{r}^{2}+{\hat{w}})\partial _{z}\hat{\boldsymbol{v}}_{\bot }+\hat{\boldsymbol{v}}_{\bot }\boldsymbol{\cdot }\boldsymbol{{\rm\nabla}}_{\bot }\hat{\boldsymbol{v}}_{\bot }=-\boldsymbol{{\rm\nabla}}_{\bot }\hat{p}+{\it\Delta}_{\bot }\hat{\boldsymbol{v}}_{\bot }+{\it\delta}^{2}\partial _{z}^{2}\hat{\boldsymbol{v}}_{\bot } & \displaystyle\end{eqnarray}$$
 $$\begin{eqnarray}\displaystyle & (c_{1}-\hat{r}^{2}+{\hat{w}})\partial _{z}{\hat{w}}+\hat{\boldsymbol{v}}_{\bot }\boldsymbol{\cdot }\boldsymbol{{\rm\nabla}}_{\bot }(c_{1}-\hat{r}^{2}+{\hat{w}})=-{\it\delta}^{2}\partial _{z}\hat{p}+{\it\Delta}_{\bot }{\hat{w}}+{\it\delta}^{2}\partial _{z}^{2}{\hat{w}} & \displaystyle\end{eqnarray}$$
 $$\begin{eqnarray}\displaystyle & \displaystyle \boldsymbol{{\rm\nabla}}_{\bot }\boldsymbol{\cdot }\hat{\boldsymbol{v}}_{\bot }+\frac{\partial {\hat{w}}}{\partial z}=0. & \displaystyle\end{eqnarray}$$
To the leading order,
 ${\it\delta}^{2}=O(R^{-1/2})$
and thus it might appear that all terms involving
 ${\it\delta}$
should be ignored. However, the streamwise momentum equation (4.112) along with (4.113) implies
 $$\begin{eqnarray}\frac{\text{d}}{\text{d}z}\left\{\int _{0}^{2{\rm\pi}}\int _{0}^{\infty }(c_{1}-\hat{r}^{2}+{\hat{w}}){\hat{w}}\hat{r}\,\text{d}\hat{r}\,\text{d}{\it\theta}\right\}=-{\it\delta}^{2}\partial _{z}\left\{\int _{0}^{2{\rm\pi}}\int _{0}^{\infty }\hat{p}\hat{r}\,\text{d}\hat{r}\,\text{d}{\it\theta}\right\}\!.\end{eqnarray}$$
As
 ${\it\delta}\rightarrow 0$
, we see no reason for the left-hand side to be zero; thus we have to account for the singular limit:
 ${\it\delta}^{2}\partial _{z}\hat{p}\rightarrow H^{\prime }(z)$
as
 ${\it\delta}\rightarrow 0$
for some periodic function
 $H(z)$
. (Recent numerical calculations suggest that this is indeed the case.) This leads to the following fully-nonlinear parameter-free eigenvalue problem in the infinite domain
 $0<\hat{r}<\infty$
,
 $2{\rm\pi}$
-periodic in both
 ${\it\theta}$
and
 ${\it\alpha}z$
describing limiting NVC states in a pipe:
 $$\begin{eqnarray}\displaystyle & (c_{1}-\hat{r}^{2}+{\hat{w}})\partial _{z}\hat{\boldsymbol{v}}_{\bot }+\hat{\boldsymbol{v}}_{\bot }\boldsymbol{\cdot }\boldsymbol{{\rm\nabla}}_{\bot }\hat{\boldsymbol{v}}_{\bot }=-\boldsymbol{{\rm\nabla}}_{\bot }\hat{p}+{\it\Delta}_{\bot }\hat{\boldsymbol{v}}_{\bot } & \displaystyle\end{eqnarray}$$
 $$\begin{eqnarray}\displaystyle & (c_{1}-\hat{r}^{2}+{\hat{w}})\partial _{z}{\hat{w}}+\hat{\boldsymbol{v}}_{\bot }\boldsymbol{\cdot }\boldsymbol{{\rm\nabla}}_{\bot }(c_{1}-\hat{r}^{2}+{\hat{w}})=-H^{\prime }(z)+{\it\Delta}_{\bot }{\hat{w}} & \displaystyle\end{eqnarray}$$
has to be solved together with divergence condition (4.113), which is qualitatively analogous to a problem in boundary-layer flow studied by Deguchi & Hall (Reference Deguchi and Hall2014a
). The far-field behaviour of rolls, streaks and wave components of the travelling wave, discussed in §§ 4.3 and 4.5 gives the relevant far-field condition for different Fourier components of
 $\hat{\boldsymbol{v}}_{\bot }$
and
 ${\hat{w}}$
.
5 Comparison between numerical computation and asymptotics
First, for VWI states when
 ${\it\delta}=1$
, the
 $R^{-1}$
scale for rolls,
 $O(1)$
scale for streaks and a maximal wave amplitude of
 $O(R^{-5/6})$
occurring in a critical layer of width
 $R^{-1/3}$
are, as expected, the same as Hall & Sherwin (Reference Hall and Sherwin2010) theory for channels. Because
 $(1-c)^{-1}=O(1)$
, and the critical layer is not close to the pipe centre, the geometric difference between a pipe and channel does not make any difference to the scale prediction. Indeed, the reported scale for rolls and critical-layer thickness from direct numerical calculation by Viswanath (Reference Viswanath2009) for the
 $S$
antisymmetric state is consistent with this prediction. Since asymptotic theory predicts that the wave-amplitude scaling
 $R^{-5/6}$
only persists over a layer of thickness
 $R^{-1/3}$
, and drops down to
 $O(R^{-7/6})$
outside the layer, it is clear that the kinetic energy of the waves is dominated by the critical-layer contribution and scales as
 $R^{-2}$
. The square root of the kinetic energy for
 $l=1$
, which is the dominant contribution, reported in Viswanath (Reference Viswanath2009) is
 $R^{-0.97}$
, not far from asymptotic theory. As mentioned before, we were unable to achieve numerical convergence for WK solutions for values of
 $R$
much larger than approximately 11 000 and so the agreement with the asymptotic scaling results for VWI-states is only qualitative.
On the other hand, the numerically computed
 $C_{1}$
,
 $C_{2}$
solutions appear to suggest a shrinking structure near the centre of the pipe as
 $R$
increases. For such cases, we have identified two theoretical possibilities in the § 4 as
 $R\rightarrow \infty$
:
Case (i) corresponds to a nonlinear viscous core with radial scaling
 ${\it\delta}=R^{-1/4}$
, with axial component of both streak and waves scaling as
 ${\it\delta}_{3}={\it\delta}_{4}={\it\delta}^{2}=R^{-1/2}$
while perpendicular components of both rolls and wave-velocity scaling as
 ${\it\delta}_{1}={\it\delta}_{2}={\it\delta}^{3}=R^{-3/4}$
. In this case, the wave speed perturbation
 $1-c$
scales as
 ${\it\delta}_{c}={\it\delta}^{2}=R^{-1/2}$
. The canonical equations that arise have been presented in § 4.6.
Case (ii) corresponds to a shrinking VWI state where
 ${\it\delta}=R^{-1/6}$
,
 ${\it\delta}_{3}={\it\delta}_{c}={\it\delta}^{2}=R^{-1/3}$
,
 ${\it\delta}_{1}=R^{-5/6}$
,
 ${\it\delta}_{2}=R^{-5/6}{\it\delta}^{-1/3}=R^{-7/9}$
,
 ${\it\delta}_{4}=R^{-5/6}{\it\delta}^{-4/3}=R^{-11/18}$
.
We notice from table 1 that
 ${\it\delta}_{1}{\it\delta}\approx 1/R$
, and
 ${\it\delta}_{c}\approx {\it\delta}_{3}$
as expected from the theory in either case (i) or (ii) though for the smaller
 ${\it\alpha}$
value,
 $C2$
solution shows a marked departure. We also notice that
 ${\it\delta}_{4}\approx {\it\delta}_{2}/{\it\delta}$
as expected from theory. However,
 ${\it\delta}^{2}\approx R^{-0.46}$
is not as close to
 ${\it\delta}_{3}\approx R^{-0.36}$
as expected from
 $R\rightarrow \infty$
consistent scaling. Nonetheless, the observed wave stress
 $S_{1}$
,
 $S_{2}$
scaling in figure 21 is consistent with asymptotic scaling argument
 $R^{-5/3}{\it\delta}^{-5/3}$
. Since our numerical results on improved resolution did not change the scales significantly, our conclusion is that the
 $R\rightarrow \infty$
asymptotic has been attained for some, but not all quantities. This should not be too surprising since, for instance, the scaling of the radial roll component seen in figure 15 shows that in some instances the largest-amplitude azimuthal component has a steeper slope than the second largest. Clearly, if the same slopes persist, the one which does not decay as rapidly with
 $R$
will have to dominate eventually. In this connection, it is to be noted further that Deguchi & Walton (Reference Deguchi and Walton2013) numerical scaling results for spiralling centre modes in a pipe were in agreement with Smith & Bodonyi (Reference Smith and Bodonyi1982) asymptotics for
 $R\geqslant 10^{8}$
; hence it is not unexpected that our finite
 $R$
scaling results for
 $R\leqslant 2\times 10^{5}$
should deviate from
 $R\rightarrow \infty$
asymptotics.
To the extent that the observed core scaling
 ${\it\delta}$
(see table 1) in the numerically calculated range of
 $R$
is much closer to the theoretical
 $R^{-1/4}$
scale for NVC states than the
 $R^{-1/6}$
predicted for shrinking VWI states, we believe that the
 $C1{-}C2$
solutions are finite
 $R$
realizations of the NVC states. There is of course significant discrepancy between the numerically computed and asymptotically predicted
 ${\it\delta}_{3}$
,
 ${\it\delta}_{c}$
, but we believe this is because the
 $R$
range of calculations is not sufficiently large. It is noteworthy that
 $1-c$
versus
 $R$
curve consistently drifts towards a steeper slope for larger
 ${\it\alpha}$
, suggesting that this is indeed the case since in the wave analysis,
 ${\it\alpha}R$
, appears as a single large parameter. In this context, it may be pointed out that the
 $(1-c)\sim R^{-1/3}$
asymptotic prediction of spiral states of Smith & Bodonyi (Reference Smith and Bodonyi1982) is not realized accurately in numerical observations until
 $R\geqslant 10^{8}$
. Also, the Reynolds stress contour curves in figure 22 show that they are significantly spread out from the critical curve, which is quite different from the typical clustering observed in the VWI solution (Deguchi & Hall Reference Deguchi and Hall2014b
).
6 Discussion and conclusion
In this paper, we report the numerical computation of travelling wave solutions with shift-and-reflect symmetry through a numerical continuation process involving small alternate wall suction and injection in the azimuthal direction. Through linear stability analysis of the base state in the presence of suction–injection at a critical Reynolds number, a neutrally stable mode was used to determine an initial guess in a Newton iteration procedure to determine the finite-amplitude travelling wave solution. Far from the Hopf-bifurcation point in the parameter space, solutions were continued until suction–injection was completely turned off. This allowed recovery of previous solutions of Wedin & Kerswell (Reference Wedin and Kerswell2004), which provided an additional check on the numerical code. Though restricted only to solutions with 2-fold azimuthal symmetry, the process of calculation also resulted in the discovery of two previously unrecognized solution branches, marked by a collapsing structure near the centre of the pipe. We present many features of these solutions, identified as
 $C1$
and
 $C2$
, including scaling of the lower branch with Reynolds number in the range
 $5\times 10^{4}<R<2\times 10^{5}$
. The
 $C2$
branch of solution possesses shift-and-rotate symmetry, besides the shift-and-reflect symmetry, resulting in streaks and rolls having 4-fold azimuthal symmetry.
We also presented general asymptotic arguments for
 $R\rightarrow \infty$
to identify all possible scalings as
 $R\rightarrow \infty$
. For asymptotic states where the axial wavenumber is independent of
 $R$
, we identify two possible classes of solution. The first is a nonlinear viscous core (NVC), with core radius
 ${\it\delta}=R^{-1/4}$
, where axial components of fluid velocity scale as
 $R^{-1/2}$
, while velocity components perpendicular to the pipe axis scale as
 $R^{-3/4}$
. In this case, the wave speed
 $c$
satisfies
 $(1-c)\sim c_{1}R^{-1/2}$
as
 $R\rightarrow \infty$
, where
 $c_{1}$
is some order one constant. In the shrinking core, the inner equation is a fully nonlinear eigenvalue problem with
 $c_{1}$
as the eigenvalue; the equation resembles a fully-nonlinear Navier–Stokes with
 $R=1$
. This nonlinear viscous-core state is similar in many respect to the ones discovered by Deguchi & Hall (Reference Deguchi and Hall2014a
) in a boundary-layer flow. While the wave and roll components are localized in the shrinking core with algebraic decay as one moves away from the core, the streak component, though small, is the same size inside and outside the core, until wall effects become important. Unlike the boundary-layer flows of Deguchi & Hall (Reference Deguchi and Hall2014a
), there is no exponential growth of streak magnitude; instead some azimuthal component remains constant. We present evidence to suggest that the computed
 $C1{-}C2$
solutions are actually a finite
 $R$
realization of the NVC states with 2-fold azimuthal symmetry.
A second possibility is a class of vortex wave (VWI) states, which have rather different asymptotic structures from NVC. We identify, two sub-classes of VWI states, with core width
 ${\it\delta}=1$
or
 ${\it\delta}=R^{-1/6}$
depending on whether or not the vortex wave-structure collapse towards the pipe centre. For a vortex wave (VWI) solution, small linear waves of amplitude
 $O(R^{-5/6}{\it\delta}^{-4/3})$
concentrated mostly in a critical layer of width
 ${\it\delta}\hat{{\it\delta}}={\it\delta}(R{\it\delta}^{4})^{-1/3}$
drive rolls of magnitude
 $O(R^{-1}{\it\delta}^{-1/3})$
which generate streaks of magnitude
 ${\it\delta}^{2}$
. In this case
 $(1-c)=O({\it\delta}^{2})$
. Outside the critical layer, where viscosity is important but nonlinear interactions are still small, the wave components become smaller by a factor of
 $\hat{{\it\delta}}=(R{\it\delta}^{4})^{-1/3}$
. When
 ${\it\delta}=1$
, the scalings of these vortex wave solutions match those of Hall & Sherwin (Reference Hall and Sherwin2010) in a channel flow, and comparison with the so-called
 $S$
-antisymmetric numerical solution of Viswanath (Reference Viswanath2009) suggests that his solution is a finite
 $R$
realization of VWI states. Qualitative comparison with data suggests that the same is likely true for the Wedin & Kerswell (Reference Wedin and Kerswell2004) solution, though a more quantitative comparison is hampered by our inability to continue the Wedin & Kerswell (Reference Wedin and Kerswell2004) solution beyond about
 $R=11\,000$
. In the case of a shrinking core
 ${\it\delta}\ll 1$
, the conclusion that
 ${\it\delta}=R^{-1/6}$
is the only possibility requires us to consider how neutral modes are perturbed by higher-order effects, and the viscous critical layer plays a paramount role in this consideration.
To the extent that both VWI and NVC states arise from asymptotically small perturbations of the basic Poiseuille flow, their relevance to transition in turbulence is already recognized. In this context, we note that the shrinking core states have waves and rolls scaling with larger magnitude than for
 ${\it\delta}=1$
, in that sense, it takes a larger perturbation from Poiseuille to reach these new states. On the other hand, these shrinking core states have less interaction with the pipe boundaries, and are therefore likely more robust to perturbations at the boundaries. The stability and control of these states, which are likely to have slow and low-dimensional unstable manifolds, are important matters for further research with both theoretical and practical implications.
Acknowledgements
S.T. acknowledges support from the National Science Foundation (NSF-DMS-1108794, NSF-DMS-1515755). Further support to S.T. was provided from an EPSRC Platform grant while at Imperial College, London. P.H. acknowledges support of EPSRC through EPSRC grant EP/1037948/1.
Appendix A
A.1 Adjoint equation analysis
Here we determine
 ${\it\epsilon}\rightarrow 0$
asymptotic behaviour of null-space solutions to the adjoint operator
 $\mathscr{L}^{\dagger }$
defined in (4.67) and (4.68).
Note
 $\mathscr{L}^{\dagger }\tilde{\boldsymbol{u}}=0$
implies
 $$\begin{eqnarray}\displaystyle & {\it\mu}_{0}\partial _{z}\tilde{\boldsymbol{u}}+{\it\epsilon}{\it\Delta}_{\bot }\tilde{\boldsymbol{u}}=-{\it\mu}_{0}\boldsymbol{{\rm\nabla}}_{\bot }\tilde{w}+\boldsymbol{{\rm\nabla}}_{\bot }q & \displaystyle\end{eqnarray}$$
 $$\begin{eqnarray}\displaystyle & 2{\it\mu}_{0}\partial _{z}\tilde{w}+{\it\epsilon}{\it\Delta}_{\bot }\tilde{w}=\partial _{z}q & \displaystyle\end{eqnarray}$$
along with the 2-D divergence equation (4.69). From (4.84) and (4.85), it is clear that non-trivial condition in (4.86) can arise only when the
 $z$
-dependence is either in the form
 $\text{e}^{\pm \text{i}{\it\alpha}z}$
or
 $\text{e}^{\pm 2\text{i}{\it\alpha}z}$
. We will only consider
 $\text{e}^{\pm \text{i}{\it\alpha}z}$
dependence since the inviscid adjoint problem is, with change of variable, the same as the Rayleigh equation for pressure where the eigenfunctions have
 $\text{e}^{\text{i}{\it\alpha}z}$
dependence. We need not consider eigenfunctions with
 $\text{e}^{-\text{i}{\it\alpha}z}$
dependence since they do not produce an independent relation.
Outside the critical layer, using
 $\langle q\rangle =0=\langle \tilde{w}\rangle$
, the inviscid leading-order balance in (A 1) and (A 2) implies
 $$\begin{eqnarray}\displaystyle & -{\it\mu}_{0}\text{i}{\it\alpha}\tilde{\boldsymbol{u}}={\it\mu}_{0}\boldsymbol{{\rm\nabla}}_{\bot }\tilde{w}-\boldsymbol{{\rm\nabla}}_{\bot }q & \displaystyle\end{eqnarray}$$
 $$\begin{eqnarray}\displaystyle & -2{\it\mu}_{0}\text{i}{\it\alpha}\tilde{w}=-\text{i}{\it\alpha}q. & \displaystyle\end{eqnarray}$$
Substituting
 $q=(2/{\it\mu}_{0})\tilde{q}$
, (A 4) into (A 3) and (A 4), it is clear that
 $\boldsymbol{{\rm\nabla}}_{\bot }\boldsymbol{\cdot }\tilde{\boldsymbol{u}}=0$
implies
 $$\begin{eqnarray}\boldsymbol{{\rm\nabla}}_{\bot }\boldsymbol{\cdot }\left(\frac{\boldsymbol{{\rm\nabla}}_{\bot }\tilde{q}}{{\it\mu}_{0}^{2}}\right)=0\end{eqnarray}$$
and that
 $$\begin{eqnarray}{\it\mu}_{0}\text{i}{\it\alpha}\tilde{\boldsymbol{u}}=\frac{1}{{\it\mu}_{0}}\boldsymbol{{\rm\nabla}}_{\bot }\tilde{q}.\end{eqnarray}$$
The condition
 $\tilde{u} =0$
on the wall immediately implies the Neumann condition
 $$\begin{eqnarray}\partial _{\tilde{r}}\tilde{q}({\it\delta}^{-1},{\it\theta})=0.\end{eqnarray}$$
The inviscid approximation (A 5) with boundary condition (A 7) to the adjoint problem is, as expected, the same as for the original pressure function because the Rayleigh equation is in the self-adjoint form. Therefore, from previous arguments for pressure
 $p$
, as the critical layer is approached
 $$\begin{eqnarray}\boldsymbol{e}_{\boldsymbol{s}}\boldsymbol{\cdot }\boldsymbol{{\rm\nabla}}_{\bot }\tilde{q}\sim -A_{1}(s),\quad \boldsymbol{e}_{\boldsymbol{N}}\boldsymbol{\cdot }\boldsymbol{{\rm\nabla}}_{\bot }\tilde{q}\sim -\left(\frac{A_{1}(s)}{A_{0}(s)}\right)^{\prime }{\it\mu}_{0}\quad \text{where }A_{0}=|\boldsymbol{{\rm\nabla}}_{\bot }{\it\mu}_{0}|,\end{eqnarray}$$
where
 $s$
denotes the coordinate orthogonal to
 $\boldsymbol{{\rm\nabla}}{\it\mu}_{0}$
and
 $\boldsymbol{e}_{s}$
and
 $\boldsymbol{e}_{N}$
denote unit vectors in the direction of increasing
 $s$
and increasing
 ${\it\mu}_{0}$
. From the inviscid adjoint equation, the following behaviour is implied as the critical layer is approached
 $$\begin{eqnarray}\displaystyle & \displaystyle \tilde{w}\sim \frac{A_{w}(s)}{{\it\mu}_{0}^{2}},\quad \text{where }A_{w}^{\prime }(s)=-A_{1}(s) & \displaystyle\end{eqnarray}$$
 $$\begin{eqnarray}\displaystyle & \displaystyle \tilde{\boldsymbol{u}}\boldsymbol{\cdot }\boldsymbol{e}_{\boldsymbol{s}}\sim \frac{A_{S}}{{\it\mu}_{0}^{2}},\quad \text{where }A_{S}(s)=-\frac{A_{1}(s)}{\text{i}{\it\alpha}} & \displaystyle\end{eqnarray}$$
 $$\begin{eqnarray}\displaystyle & \displaystyle \tilde{\boldsymbol{u}}\boldsymbol{\cdot }\boldsymbol{e}_{\boldsymbol{N}}\sim \frac{A_{N}}{{\it\mu}_{0}^{2}},\quad \text{where }A_{N}=-\frac{1}{\text{i}{\it\alpha}}\left(\frac{A_{1}(s)}{A_{0}(s)}\right)^{\prime }. & \displaystyle\end{eqnarray}$$
 $$\begin{eqnarray}{\it\mu}_{0}=A_{0}^{2/3}\hat{{\it\delta}}n\end{eqnarray}$$
 $$\begin{eqnarray}\tilde{\boldsymbol{u}}\boldsymbol{\cdot }\boldsymbol{e}_{\boldsymbol{s}}\sim \frac{A_{s}}{A_{0}^{4/3}\hat{{\it\delta}}^{2}}\mathscr{V},\quad \tilde{\boldsymbol{u}}\boldsymbol{\cdot }\boldsymbol{e}_{\boldsymbol{N}}\sim \frac{A_{N}}{A_{0}^{2/3}\hat{{\it\delta}}}\mathscr{U},\quad {\hat{W}}\sim \frac{A_{W}}{A_{0}^{4/3}\hat{{\it\delta}}^{2}}\mathscr{W},\quad q\sim \frac{2A_{W}}{A_{0}^{2/3}\hat{{\it\delta}}}\mathscr{Q}.\end{eqnarray}$$
The axial velocity results in
 $$\begin{eqnarray}2\text{i}{\it\alpha}n\mathscr{W}+\partial _{n}^{2}\mathscr{W}=2\text{i}{\it\alpha}\mathscr{Q}.\end{eqnarray}$$
The velocity component in the perpendicular plane in the direction of increasing
 ${\it\mu}_{0}$
results in the following leading-order balance
 $$\begin{eqnarray}-\!n\partial _{n}\mathscr{W}+2\partial _{n}\mathscr{Q}=0.\end{eqnarray}$$
Equations (A 14) and (A 15) are self contained and come with the matching condition
 $$\begin{eqnarray}\mathscr{W}\sim \frac{1}{n^{2}},\quad \mathscr{Q}\sim \frac{1}{n}\quad \text{as }n\rightarrow \pm \infty .\end{eqnarray}$$
The tangential velocity equation in the perpendicular plane in the inner-scale becomes
 $$\begin{eqnarray}\text{i}{\it\alpha}n\mathscr{V}+\partial _{n}^{2}\mathscr{V}=\text{i}{\it\alpha}\mathscr{R}(n,s),\end{eqnarray}$$
where
 $$\begin{eqnarray}\mathscr{R}(n,s)=(2\mathscr{Q}-n\mathscr{W})+B(s)\partial _{n}^{2}\mathscr{W},\end{eqnarray}$$
with
 $$\begin{eqnarray}B(s)=\frac{2A_{0}^{\prime }A_{W}}{3{\it\alpha}^{2}A_{0}A_{S}}.\end{eqnarray}$$
We note that the term independent of
 $s$
in (A 18) has the asymptotic behaviour
 $1/n$
which dominates
 $B(s)\partial _{n}^{2}\mathscr{W}\sim 6B(s)/n^{4}$
as
 $n\rightarrow \pm \infty$
, while divergence equation implies
 $$\begin{eqnarray}\partial _{n}\mathscr{U}+\mathscr{V}+B_{1}(s)\left(2\mathscr{V}+n\partial _{n}\mathscr{V}\right)+B_{0}(s)\partial _{s}\mathscr{V}=0,\end{eqnarray}$$
where
 $$\begin{eqnarray}B_{0}(s)=\frac{A_{S}(s)}{A_{0}(s)A_{N}(s)},\quad B_{1}(s)=-\frac{2A_{0}^{\prime }(s)B_{0}(s)}{3A_{0}(s)}.\end{eqnarray}$$
Note that
 $\mathscr{Q}$
can be eliminated from (A 14) using (A 15) implying
 $$\begin{eqnarray}\partial _{n}^{3}\mathscr{W}+\text{i}{\it\alpha}n\partial _{n}\mathscr{W}_{n}+2\text{i}{\it\alpha}\mathscr{W}=0.\end{eqnarray}$$
The solution with asymptotic behaviour
 $\mathscr{W}\sim 1/n^{2}$
has the representation
 $$\begin{eqnarray}\mathscr{W}(n)=\text{e}^{-\text{i}{\rm\pi}/3}{\it\alpha}^{2/3}F(\text{e}^{-\text{i}{\rm\pi}/6}{\it\alpha}^{1/3}n),\end{eqnarray}$$
where
 $F$
satisfies
 $$\begin{eqnarray}zF^{\prime \prime }-F^{\prime }-z^{2}F=-1.\end{eqnarray}$$
This has a unique solution with behaviour
 $F(z)\sim 1/z^{2}$
as
 $\text{e}^{\text{i}{\rm\pi}/6}z\rightarrow \pm \infty$
given by
 $$\begin{eqnarray}\displaystyle & & \displaystyle F(z)=\frac{4{\rm\pi}}{(-\sqrt{3}+\text{i})z}\left\{\text{Ai}^{\prime }({\it\omega}^{-1}z)\int _{\infty }^{1}\frac{\text{Ai}^{\prime }(z{\it\tau})}{{\it\tau}^{2}}\,\text{d}{\it\tau}-\text{Ai}^{\prime }(z)\int _{{\it\omega}\infty }^{1}\frac{\text{Ai}^{\prime }({\it\omega}^{-1}z{\it\tau})}{{\it\tau}^{2}}\,\text{d}{\it\tau}\right\},\nonumber\\ \displaystyle & & \displaystyle \qquad \text{where }{\it\omega}=\text{e}^{2\text{i}{\rm\pi}/3}.\end{eqnarray}$$
To check that (A 25) is regular at
 $z=0$
, we integrate by parts and use the Airy equation to obtain
 $$\begin{eqnarray}F(z)=\frac{4{\rm\pi}}{(-\sqrt{3}+\text{i})}\left(\text{Ai}^{\prime }\left(\frac{z}{{\it\omega}}\right)\int _{\infty }^{z}\text{Ai}(z^{\prime })\,\text{d}z^{\prime }-{\it\omega}\text{Ai}^{\prime }(z)\int _{{\it\omega}\infty }^{z}\text{Ai}\left(\frac{z^{\prime }}{{\it\omega}}\right)\,\text{d}z^{\prime }\right),\end{eqnarray}$$
which is manifestly regular at
 $z=0$
. Further, from the form of
 $F$
, it is clear that it is a derivative of a function
 $G(z)$
, whose asymptotic behaviour as
 $\text{e}^{\text{i}{\rm\pi}/6}z\rightarrow \pm \infty$
is given by
 $G(z)\sim -1/z$
. Thus it follows that
 $\int _{-\infty }^{\infty }\mathscr{W}(n)\,\text{d}n=0$
. Once
 $\mathscr{W}$
is determined, (A 14) is used eliminate
 $\mathscr{Q}$
from (A 18). Defining
 $$\begin{eqnarray}\mathscr{V}(n,s)=\mathscr{W}(n)+\text{i}{\it\alpha}B(s)\text{e}^{-\text{i}{\rm\pi}/3}{\it\alpha}^{2/3}H(\text{e}^{-\text{i}{\rm\pi}/6}{\it\alpha}^{1/3}n),\end{eqnarray}$$
it follows that
 $H(z)$
satisfies
 $$\begin{eqnarray}H^{\prime \prime }-zH=F^{\prime \prime }.\end{eqnarray}$$
The solution for
 $H(z)$
that decays like
 $z^{-5}$
as
 $\text{e}^{\text{i}{\rm\pi}/6}z\rightarrow \pm \infty$
is given by
 $$\begin{eqnarray}\displaystyle H(z)=\frac{4{\rm\pi}}{(\sqrt{3}+\text{i})}\left(\text{Ai}\left(\frac{z}{{\it\omega}}\right)\int _{\infty }^{z}\text{Ai}(z^{\prime })F^{\prime \prime }(z^{\prime })\,\text{d}z^{\prime }-\text{Ai}(z)\int _{{\it\omega}\infty }^{z}\text{Ai}\left(\frac{z^{\prime }}{{\it\omega}}\right)F^{\prime \prime }(z^{\prime })\,\text{d}z^{\prime }\right). & & \displaystyle \nonumber\\ \displaystyle & & \displaystyle\end{eqnarray}$$
Note that the fast decay of
 $H(z)$
ensures
 $\mathscr{V}(n,s)\sim \mathscr{W}(n)\sim 1/n^{2}$
as
 $n\rightarrow \pm \infty$
. Once
 $\mathscr{V}$
is known, then (A 20) may be used to determine
 $\mathscr{U}$
.
The upshot of this calculation is to demonstrate that inner–outer matching is possible for the adjoint problem and that if we rescaled our adjoint velocity variables so that within the critical layer,
 $$\begin{eqnarray}(\tilde{\boldsymbol{u}},\tilde{w})=O_{s}(1)\end{eqnarray}$$
then outside the critical layer of thickness
 $\hat{{\it\delta}}={\it\epsilon}^{1/3}=(R{\it\delta}^{4})^{-1/3}$
, we must have
 $$\begin{eqnarray}(\tilde{\boldsymbol{u}},\tilde{w})=O({\it\epsilon}^{2/3}).\end{eqnarray}$$
A.2 Analysis of far-field rolls
Here we give the details of the consistent asymptotic behaviour of rolls
 $\boldsymbol{U}$
for large
 $\hat{r}$
. This will be used in the following section to confirm that streak terms do not decay with
 $\hat{r}$
, explaining the numerical observation that for
 $C1{-}C2$
states, streaks do not have the collapsing structure as
 $R\rightarrow \infty$
as do rolls and waves. The ensuing argument is restricted to flows where the rolls have
 $m_{0}$
-fold azimuthal symmetry for
 $m_{0}=2$
or 4, corresponding to the
 $C1$
and
 $C2$
solutions computed numerically. Also, it is to be noted that the same analysis is valid for nonlinear viscous core (NVC) states, i.e. when
 ${\it\delta}=R^{-1/4}$
in the regime
 ${\it\delta}^{-1}\gg \hat{r}\gg 1$
.
Using
 ${\it\delta}_{3}={\it\delta}^{2}$
in (4.50a,b
) and taking the curl
 $\boldsymbol{{\rm\nabla}}_{\bot }\times$
, we obtain the two-dimensional roll-vorticity equation:
 $$\begin{eqnarray}{\it\Delta}_{\bot }{\it\omega}=\boldsymbol{U}\boldsymbol{\cdot }\boldsymbol{{\rm\nabla}}_{\bot }{\it\omega}+(R{\it\delta}^{4})^{1/3}\hat{\boldsymbol{z}}\boldsymbol{\cdot }(\boldsymbol{{\rm\nabla}}_{\bot }\times \langle \boldsymbol{u}\boldsymbol{\cdot }\boldsymbol{{\rm\nabla}}_{\bot }\boldsymbol{u}+w\partial _{z}\boldsymbol{u}\rangle ),\end{eqnarray}$$
where roll velocity
 $\boldsymbol{U}=(U,V)=(1/\hat{r}{\it\psi}_{{\it\theta}},-{\it\psi}_{\hat{r}})$
is related to
 ${\it\omega}$
by
 $$\begin{eqnarray}-\!{\it\Delta}_{\bot }{\it\psi}={\it\omega}.\end{eqnarray}$$
This is supplemented by regularity at the origin and wall boundary condition
 ${\it\psi}({\it\delta}^{-1},{\it\theta})=0=\partial _{\hat{r}}{\it\psi}({\it\delta}^{-1},{\it\theta})$
. Recall the property (4.46) of the waves outside the critical layer of thickness
 $\hat{{\it\delta}}=O((R{\it\delta}^{4})^{-1/3})\ll 1$
, then the forcing from the wave outside the critical layer in (A 32) is
 $O((R{\it\delta}^{4})^{-1/3})$
, and therefore small when
 ${\it\delta}\gg R^{-1/4}$
. In all cases, it is at most
 $O(1)$
.
In the far field
 $\hat{r}\gg 1$
, as will be determined in § A.4, the wave components decay rapidly (see (A 74) and (A 75)), which is consistent with numerical calculations of
 $C1{-}C2$
states. Because of this rapid decay, it is consistent to neglect the contribution of waves to the Reynolds stress terms in (A 32) since the particular solution to this forced equation decays much more rapidly than the solution to the associated homogeneous equation whose decay properties we now investigate. If
 $\boldsymbol{U}=o(\hat{r}^{-1})$
, then it is consistent to assume that the large
 $\hat{r}$
behaviour is dominated by solutions of Laplace’s equation for vorticity
 ${\it\omega}$
, and hence a biharmonic equation for
 ${\it\psi}$
. In that case, the streamfunction
 ${\it\psi}$
is expected to be dominated by the least decaying solution in
 $\hat{r}$
of the biharmonic equation which is a multiple of
 $\hat{r}^{-m_{0}+2}\sin (m_{0}{\it\theta})$
. For
 $m_{0}=4$
, this assumption is self consistent since the corresponding
 $\boldsymbol{U}=O(\hat{r}^{-3})=o(\hat{r}^{-1})$
.
On the other hand, if
 $m_{0}=2$
, if we assumed that the streamfunction
 ${\it\psi}$
is dominated by the least decaying solution of the biharmonic equation, then we arrive at
 $\boldsymbol{U}=O(\hat{r}^{-1})$
, implying
 $\boldsymbol{U}\boldsymbol{\cdot }\boldsymbol{{\rm\nabla}}_{\bot }{\it\omega}$
is of the same order as
 ${\it\Delta}_{\bot }{\it\omega}$
in (A 32). This is inconsistent with neglecting
 $\boldsymbol{U}\boldsymbol{\cdot }\boldsymbol{{\rm\nabla}}{\it\omega}$
. Nonetheless, it is to be recognized that the non-generic situation
 ${\it\psi}\sim \hat{r}^{-2}\sin (2{\it\theta})$
for the biharmonic solution is a possibility for
 $m_{0}=2$
, in which case it is consistent to ignore
 $\boldsymbol{U}\boldsymbol{\cdot }\boldsymbol{{\rm\nabla}}_{\bot }{\it\omega}$
.
In order to recognize the role of forcing and wall boundary conditions and determine this non-generic situation where the least decaying behaviour is suppressed for any particular
 $m_{0}$
, it is better to formulate an integral equation approach. The equation for coefficient of
 $\sin (m{\it\theta})$
for streamfunction
 ${\it\psi}$
may be written as
 $$\begin{eqnarray}\displaystyle -\!\left(\frac{\text{d}^{2}}{\text{d}\hat{r}^{2}}+\frac{1}{\hat{r}}\frac{\text{d}}{\text{d}\hat{r}}-\frac{m^{2}}{\hat{r}^{2}}\right)^{2}{\it\psi}_{m} & = & \displaystyle [\boldsymbol{{\rm\nabla}}_{\bot }\boldsymbol{\cdot }(\boldsymbol{U}{\it\omega})]_{m}+(R{\it\delta}^{4})^{1/3}(\boldsymbol{{\rm\nabla}}_{\bot }\times \langle \boldsymbol{u}\boldsymbol{\cdot }\boldsymbol{{\rm\nabla}}_{\bot }\boldsymbol{u}+w\partial _{z}\boldsymbol{u}\rangle )_{m}\nonumber\\ \displaystyle & =: & \displaystyle F_{m}(\hat{r})\end{eqnarray}$$
with the polar coordinate representation of the
 $m$
th azimuthal mode
 $$\begin{eqnarray}\boldsymbol{U}=(U,V)=\left(\frac{m}{\hat{r}}\cos (m{\it\theta}){\it\psi}_{m}(\hat{r}),-{\it\psi}_{m}^{\prime }(\hat{r})\sin (m{\it\theta})\right)\!.\end{eqnarray}$$
The solution to (A 34) satisfying the no-slip condition at the walls,
 ${\it\psi}_{m}({\it\delta}^{-1})=0={\it\psi}_{m}^{\prime }({\it\delta}^{-1})$
, and which is regular at the origin is given by
 $$\begin{eqnarray}\displaystyle {\it\psi}_{m}(\hat{r}) & = & \displaystyle \frac{1}{8m(m^{2}-1)}\left\{(m+1)\hat{r}^{m}\int _{{\it\delta}^{-1}}^{\hat{r}}F_{m}(t)t^{3-m}\,\text{d}t+(m-1)\hat{r}^{-m}\int _{0}^{\hat{r}}F_{m}(t)t^{3+m}\,\text{d}t\right.\nonumber\\ \displaystyle & & \displaystyle -\,\left.(m-1)\hat{r}^{m+2}\int _{{\it\delta}^{-1}}^{\hat{r}}F_{m}(t)t^{1-m}\,\text{d}t-(m+1)\hat{r}^{2-m}\int _{0}^{\hat{r}}F_{m}(t)t^{1+m}\,\text{d}t\right\}\nonumber\\ \displaystyle & & \displaystyle +\,A_{m}\hat{r}^{m}+B_{m}\hat{r}^{m+2},\end{eqnarray}$$
where
 $$\begin{eqnarray}\displaystyle & \displaystyle A_{m}=-\frac{{\it\delta}^{2m}}{8m}\int _{0}^{{\it\delta}^{-1}}F_{m}(t)t^{3+m}\,\text{d}t+\frac{{\it\delta}^{2m-2}}{8(m-1)}\int _{0}^{{\it\delta}^{-1}}F_{m}(t)t^{m+1}\,\text{d}t & \displaystyle\end{eqnarray}$$
 $$\begin{eqnarray}\displaystyle & \displaystyle B_{m}=\frac{{\it\delta}^{2m+2}}{8(m+1)}\int _{0}^{{\it\delta}^{-1}}t^{3+m}F_{m}(t)\,\text{d}t-\frac{{\it\delta}^{2m}}{8m}\int _{0}^{{\it\delta}^{-1}}t^{m+1}F_{m}(t)\,\text{d}t. & \displaystyle\end{eqnarray}$$
Thus, since the Reynolds stress term from waves is negligible, we have
 $F_{m}\sim [\boldsymbol{{\rm\nabla}}_{\bot }\boldsymbol{\cdot }(\boldsymbol{U}{\it\omega})]_{m}$
. Now, we have
 $\boldsymbol{{\rm\nabla}}_{\bot }{\it\omega}=(\partial _{\hat{r}}{\it\omega},(1/\hat{r})\partial _{{\it\theta}}{\it\omega})$
.
A.2.1 Leading-order roll asymptotics for 4-fold
$(m_{0}=4)$
symmetric solution

For a state, such as the
 $C_{2}$
state, where we have shift-and-rotate symmetry besides shift-and-reflect symmetry, there is a 4-fold symmetry for rolls and streaks, though not for waves, in which case the streamfunction corresponding to the rolls may be expressed as
 ${\it\psi}=\sum _{j=1}^{\infty }{\it\psi}_{4j}\sin (4j{\it\theta})$
. It follows that
 $$\begin{eqnarray}{\it\omega}=\mathop{\sum }_{j=1}^{\infty }{\it\omega}_{4j}(\hat{r})\sin (4j{\it\theta}),\quad \text{where }-\!{\it\omega}_{4j}(\hat{r})={\it\psi}_{4j}^{\prime \prime }(\hat{r})+\frac{1}{\hat{r}}{\it\psi}_{4j}^{\prime }(\hat{r})-\frac{16j^{2}}{\hat{r}^{2}}{\it\psi}_{4j}(\hat{r}),\end{eqnarray}$$
and
 $$\begin{eqnarray}\boldsymbol{U}\boldsymbol{\cdot }\boldsymbol{{\rm\nabla}}_{\bot }{\it\omega}=\mathop{\sum }_{j,k=1}^{\infty }\left(\frac{4k}{\hat{r}}{\it\psi}_{4k}(\hat{r}){\it\omega}_{j}^{\prime }(\hat{r})\sin (4j{\it\theta})\cos (4k{\it\theta})-\frac{4j}{\hat{r}}{\it\psi}_{4k}^{\prime }(\hat{r}){\it\omega}_{4j}(\hat{r})\sin (4k{\it\theta})\cos (4j{\it\theta})\right).\end{eqnarray}$$
It is consistent to assume (see (A 74) and (A 75) in the ensuing) that the wave contribution to
 $F_{m}$
(
 $m=4n$
) is small and so
 $$\begin{eqnarray}\displaystyle F_{m}\sim [\boldsymbol{U}\boldsymbol{\cdot }\boldsymbol{{\rm\nabla}}_{\bot }{\it\omega}]_{m} & = & \displaystyle \mathop{\sum }_{j=1}^{n-1}\left\{\frac{2(n-j)}{\hat{r}}{\it\psi}_{4(n-j)}(\hat{r}){\it\omega}_{4j}^{\prime }(\hat{r})-\frac{2j}{\hat{r}}{\it\psi}_{4(n-j)}^{\prime }(\hat{r}){\it\omega}_{4j}(\hat{r})\right\}\nonumber\\ \displaystyle & & \displaystyle +\,\mathop{\sum }_{k=1}^{\infty }\left\{\frac{2k}{\hat{r}}{\it\psi}_{4k}(\hat{r}){\it\omega}_{4n+4k}^{\prime }(\hat{r})+\frac{2(n+k)}{\hat{r}}{\it\psi}_{4k}^{\prime }(\hat{r}){\it\omega}_{4n+4k}(\hat{r})\right\}\nonumber\\ \displaystyle & & \displaystyle -\,\mathop{\sum }_{j=1}^{\infty }\left\{\frac{2(n+j)}{\hat{r}}{\it\psi}_{4n+4j}(\hat{r}){\it\omega}_{4j}^{\prime }(\hat{r})+\frac{2j}{\hat{r}}{\it\psi}_{4n+4j}^{\prime }(\hat{r}){\it\omega}_{4j}(\hat{r})\right\}.\quad\end{eqnarray}$$
It is clear from the above expression that the contribution to
 $F_{m}$
for
 $m>4$
in the range
 $1\ll \hat{r}\ll {\it\delta}^{-1}$
must come from the first term while for
 $m=4$
, there is no contribution from the first term. It is not difficult to conclude that for
 $n\geqslant 1$
,
 ${\it\psi}_{4n}\sim \hat{r}^{-2n}$
,
 ${\it\omega}_{4n}\sim \hat{r}^{-2-2n}$
, while
 $F_{4}\sim \hat{r}^{-10}$
, and for
 $n\geqslant 2$
,
 $F_{4n}\sim \hat{r}^{-4-2n}$
. In particular, for
 $n=1$
(
 $m=4$
), we obtain from (A 36) that
 $$\begin{eqnarray}{\it\psi}_{4}(\hat{r})=\frac{1}{480}\left\{-5\hat{r}^{-2}\int _{0}^{{\it\delta}^{-1}}F_{4}t^{5}\,\text{d}t+3\hat{r}^{-4}\left(\int _{0}^{{\it\delta}^{-1}}F_{4}t^{7}\,\text{d}t\right)+O(\hat{r}^{-6})\right\},\end{eqnarray}$$
which implies that the leading-order behaviour of the roll in the far field is
 $$\begin{eqnarray}\boldsymbol{U}=(U,V)\sim \frac{1}{\hat{r}^{3}}(4c_{4}\cos (4{\it\theta}),2c_{4}\sin (4{\it\theta})),\end{eqnarray}$$
where
 $c_{4}$
is the coefficient of
 $\hat{r}^{-2}$
in (A 42) where the higher-order harmonics decay even faster.
A.2.2 Leading-order roll asymptotics for 2-fold
$(m_{0}=2)$
symmetric solution

Now, consider the asymptotics for states with 2-fold azimuthal symmetry, so that
 $m=2n$
for integer
 $n\geqslant 1$
. We mentioned earlier that the least decaying solution to the biharmonic equation corresponds to
 ${\it\psi}=\sin (2{\it\theta})$
, which is not consistent with neglect of
 $\boldsymbol{U}\boldsymbol{\cdot }\boldsymbol{{\rm\nabla}}_{\bot }{\it\omega}$
.
Therefore if
 $\boldsymbol{U}=O(\hat{r}^{-1})$
for
 $\hat{r}\gg 1$
, we have to seek the leading-order streamfunction solution of the fully-nonlinear equation (A 32) (neglecting the wave contribution) in the form
 $$\begin{eqnarray}{\it\psi}=F({\it\theta}),\end{eqnarray}$$
where the corresponding velocity
 $(U,V)=1/\hat{r}(F^{\prime }({\it\theta}),0)$
having
 ${\rm\pi}$
-periodicity in
 ${\it\theta}$
. This leads to the nonlinear ODE
 $$\begin{eqnarray}2F^{\prime }({\it\theta})F^{\prime \prime }({\it\theta})+4F^{\prime \prime }({\it\theta})+F^{(\text{i}v)}({\it\theta})=0.\end{eqnarray}$$
The first integral gives
 $$\begin{eqnarray}G^{\prime \prime }=-\frac{A_{1}}{2}+6G^{2},\quad \text{where }F^{\prime }+2=-6G\end{eqnarray}$$
implying on integration
 $$\begin{eqnarray}{G^{\prime }}^{2}=4G^{3}-A_{1}G-A_{0}.\end{eqnarray}$$
This has a solution in terms of the Weirstrass elliptic function
 $\mathscr{P}(z+C,{\it\omega}_{1},{\it\omega}_{2})$
. Requiring
 ${\rm\pi}$
periodicity of a real-valued solution gives rise to a one-parameter solution family characterized by
 $a_{1}$
in the following representation:
 $$\begin{eqnarray}G({\it\theta})=\mathop{\sum }_{k=0}^{\infty }a_{k}\cos (2k{\it\theta}).\end{eqnarray}$$
However, any such solution must correspond to no net radial flux through a cylinder
 $\hat{r}=\hat{r}_{0}$
since the flux through the other boundary
 $\hat{r}={\it\delta}^{-1}$
is zero. This implies that
 $F({\it\theta})$
must be also
 ${\rm\pi}$
-periodic in
 ${\it\theta}$
, implying that
 $$\begin{eqnarray}\int _{0}^{{\rm\pi}}(6G({\it\theta})+2)\,\text{d}{\it\theta}=0\quad \text{implying }a_{0}=-\frac{1}{3}.\end{eqnarray}$$
The only solution that corresponds to this is
 $a_{1}=0$
. This can be seen easily through a perturbation expansion in the parameter
 $a_{1}$
. Straightforward perturbation expansion and requirement of periodicity shows
 $$\begin{eqnarray}\displaystyle G({\it\theta}) & = & \displaystyle -\frac{1}{3}+a_{1}\cos (2{\it\theta})+\frac{a_{1}^{2}}{8}(-2\cos (4{\it\theta})+1)+\frac{3}{64}a_{1}^{3}\cos (6{\it\theta})\nonumber\\ \displaystyle & & \displaystyle +\,\frac{a_{1}^{4}}{512}(-4\cos (8{\it\theta})+4\cos (4{\it\theta})+1)+\frac{a_{1}^{5}}{4096}(5\cos (10{\it\theta})-9\cos (6{\it\theta}))\nonumber\\ \displaystyle & & \displaystyle +\,\frac{a_{1}^{6}}{2048}\left(-\frac{3}{8}\cos (12{\it\theta})+\cos (8{\it\theta})-\frac{3}{4}\cos (4{\it\theta})-\frac{3}{16}\right)+O(a_{1}^{7}).\end{eqnarray}$$
There is no freedom left in satisfying
 $a_{0}=-1/3$
when
 $a_{1}\neq 0$
but small. The same is true when
 $a_{1}$
is not small, but this requires using the elliptic function representation.
We are forced to conclude that the assumption that
 $\boldsymbol{U}=O(\hat{r}^{-1})$
is inconsistent with no flux through the surface
 $\hat{r}=\hat{r}_{0}$
, which in turn is necessary for no flux through the boundary walls. Instead, we have to look for non-generic solutions of the biharmonic equation
 ${\it\Delta}^{2}{\it\psi}=0$
in the far field for which
 ${\it\psi}(\hat{r},{\it\theta})\sim 1/\hat{r}^{2}\sin (2{\it\theta})$
, in which case it is consistent to ignore
 $\boldsymbol{U}\boldsymbol{\cdot }\boldsymbol{{\rm\nabla}}_{\bot }{\it\omega}$
in (A 32). With this assumption we return to the integral equation (A 36), now with the representation
 ${\it\psi}=\sum _{j=1}^{\infty }{\it\psi}_{2j}(\hat{r})\sin (2j{\it\theta})$
. It follows that
 $$\begin{eqnarray}{\it\omega}=\mathop{\sum }_{j=1}^{\infty }{\it\omega}_{2j}(\hat{r})\sin (2j{\it\theta}),\quad \text{where }-\!{\it\omega}_{2j}(\hat{r})={\it\psi}_{2j}^{\prime \prime }(\hat{r})+\frac{1}{\hat{r}}{\it\psi}_{2j}^{\prime }(\hat{r})-\frac{4j^{2}}{\hat{r}^{2}}{\it\psi}_{2j}(\hat{r}),\end{eqnarray}$$
implying
 $$\begin{eqnarray}\boldsymbol{U}\boldsymbol{\cdot }\boldsymbol{{\rm\nabla}}_{\bot }{\it\omega}=\mathop{\sum }_{j,k=1}^{\infty }\left(\frac{2k}{\hat{r}}{\it\psi}_{2k}(\hat{r}){\it\omega}_{2j}^{\prime }(\hat{r})\sin (2j{\it\theta})\cos (2k{\it\theta})-\frac{2j}{\hat{r}}{\it\psi}_{2k}^{\prime }(\hat{r}){\it\omega}_{2j}(\hat{r})\sin (2k{\it\theta})\cos (2j{\it\theta})\right).\end{eqnarray}$$
It is consistent to assume that the wave contribution towards
 $F_{m}$
is small (see (A 74) and (A 75) in the ensuing); this implies
 $$\begin{eqnarray}\displaystyle F_{m}\sim [\boldsymbol{U}\boldsymbol{\cdot }\boldsymbol{{\rm\nabla}}_{\bot }{\it\omega}]_{m} & = & \displaystyle \mathop{\sum }_{j=1}^{n-1}\left\{\frac{(n-j)}{\hat{r}}{\it\psi}_{2(n-j)}(\hat{r}){\it\omega}_{2j}^{\prime }(\hat{r})-\frac{j}{\hat{r}}{\it\psi}_{2(n-j)}^{\prime }(\hat{r}){\it\omega}_{2j}(\hat{r})\right\}\nonumber\\ \displaystyle & & \displaystyle +\,\mathop{\sum }_{k=1}^{\infty }\left\{\frac{k}{\hat{r}}{\it\psi}_{2k}(\hat{r}){\it\omega}_{2n+2k}^{\prime }(\hat{r})+\frac{(n+k)}{\hat{r}}{\it\psi}_{2k}^{\prime }(\hat{r}){\it\omega}_{2n+2k}(\hat{r})\right\}\nonumber\\ \displaystyle & & \displaystyle -\,\mathop{\sum }_{j=1}^{\infty }\left\{\frac{(n+j)}{\hat{r}}{\it\psi}_{2n+2j}(\hat{r}){\it\omega}_{2j}^{\prime }(\hat{r})+\frac{j}{\hat{r}}{\it\psi}_{2n+2j}^{\prime }(\hat{r}){\it\omega}_{2j}(\hat{r})\right\}.\quad\end{eqnarray}$$
It is consistent to assume
 $F_{2}$
,
 $F_{4}$
,
 $F_{6}\sim \hat{r}^{-8}$
,
 $F_{2n}\sim \hat{r}^{-(2n+2)}\log \hat{r}$
and
 ${\it\psi}_{2}$
,
 ${\it\psi}_{4}\sim \hat{r}^{-2}$
and
 ${\it\psi}_{2n}\sim \hat{r}^{-2n+2}\ln \hat{r}$
for
 $n\geqslant 3$
, provided we satisfy the non-generic condition
 $$\begin{eqnarray}\int _{0}^{{\it\delta}^{-1}}F_{2}(t)t^{3}\,\text{d}t=0.\end{eqnarray}$$
Then, in particular for
 $m=2$
(
 $n=1$
) from (A 36), we obtain
 $$\begin{eqnarray}{\it\psi}_{2}(\hat{r})\sim \frac{1}{48}\left\{\hat{r}^{-2}\left(\int _{0}^{{\it\delta}^{-1}}F_{2}(t)t^{5}\,\text{d}t\right)+O(\hat{r}^{-4})\right\}.\end{eqnarray}$$
The non-generic assumption (A 54) is forced on us, as otherwise a fully-nonlinear analysis with the ansatz
 ${\it\psi}=F({\it\theta})$
in the roll-equation revealed no acceptable solution. Therefore, we conclude that with 2-fold symmetry (
 $m_{0}=2$
), we must have
 $$\begin{eqnarray}\boldsymbol{U}=(U,V)\sim \frac{1}{\hat{r}^{3}}(2c_{2}\cos (2{\it\theta}),2c_{2}\sin (2{\it\theta})),\end{eqnarray}$$
where
 $c_{2}$
is the coefficient of
 $\hat{r}^{-2}$
in (A 55).
A.3 Analysis of far-field streaks and absence of log correction to leading order
Now, we present the details of the behaviour of streaks in the far field. Consider the full streak equation, which on using the divergence equation, may be written in the form
 $$\begin{eqnarray}{\it\Delta}_{\bot }W=-2\hat{r}U+\boldsymbol{{\rm\nabla}}_{\bot }\boldsymbol{\cdot }(\boldsymbol{U}W)+(R{\it\delta}^{4})^{-2/3}\langle \boldsymbol{{\rm\nabla}}_{\bot }\boldsymbol{\cdot }(\boldsymbol{u}w)\rangle .\end{eqnarray}$$
Now, we have
 $$\begin{eqnarray}W(\hat{r},{\it\theta})=\mathop{\sum }_{k=0}^{\infty }W_{kk_{0}}(\hat{r})\cos (kk_{0}{\it\theta})\end{eqnarray}$$
and therefore, in particular
 $$\begin{eqnarray}W_{0}(\hat{r})=\frac{1}{2{\rm\pi}}\int _{0}^{2{\rm\pi}}W(\hat{r},{\it\theta})\,\text{d}{\it\theta}=:\overline{W}.\end{eqnarray}$$
Since
 $U_{0}(\hat{r})=0$
, it follows from (A 57) that
 $W_{0}(\hat{r})$
satisfies
 $$\begin{eqnarray}\frac{1}{\hat{r}}\frac{\text{d}}{\text{d}\hat{r}}\left(\hat{r}\frac{\text{d}}{\text{d}\hat{r}}W_{0}\right)=\overline{\boldsymbol{{\rm\nabla}}_{\bot }\boldsymbol{\cdot }(\boldsymbol{U}W)}+(R{\it\delta}^{4})^{-2/3}\overline{\langle \boldsymbol{{\rm\nabla}}_{\bot }\boldsymbol{\cdot }(\boldsymbol{u}w)\rangle }=:M_{0}(\hat{r}).\end{eqnarray}$$
Therefore, using regularity at the origin, and
 $W_{0}({\it\delta}^{-1})=0$
, we have from integration of (A 60)
 $$\begin{eqnarray}\displaystyle W_{0}(\hat{r}) & = & \displaystyle \int _{{\it\delta}^{-1}}^{\hat{r}}\frac{\text{d}r^{\prime }}{r^{\prime }}\int _{0}^{r^{\prime }}sM_{0}(s)\,\text{d}s=\int _{{\it\delta}^{-1}}^{\hat{r}}(\ln \hat{r}-\ln s)sM_{0}(s)\,\text{d}s\nonumber\\ \displaystyle & & \displaystyle +\,\left(\int _{0}^{{\it\delta}^{-1}}sM_{0}(s)\,\text{d}s\right)(\ln \hat{r}-\ln {\it\delta}^{-1}).\end{eqnarray}$$
However, using the divergence condition and pipe-wall boundary condition at
 $\hat{r}={\it\delta}^{-1}$
, the expression (A 60) for
 $M_{0}(\hat{r})$
implies
 $$\begin{eqnarray}\displaystyle \hspace{-20.00003pt}\int _{0}^{{\it\delta}^{-1}}sM_{0}(s)\,\text{d}s & = & \displaystyle \frac{1}{2{\rm\pi}}\int _{0}^{{\it\delta}^{-1}}\hat{r}\,\text{d}\hat{r}\int _{0}^{2{\rm\pi}}\,\text{d}{\it\theta}\boldsymbol{{\rm\nabla}}_{\bot }\boldsymbol{\cdot }(\boldsymbol{U}W)\nonumber\\ \displaystyle & & \displaystyle \hspace{-20.00003pt}+\,(R{\it\delta}^{4})^{-2/3}\frac{{\it\alpha}}{4{\rm\pi}^{2}}\int _{0}^{2{\rm\pi}/{\it\alpha}}\,\text{d}z\left[\int _{0}^{{\it\delta}^{-1}}\hat{r}\,\text{d}\hat{r}\int _{0}^{2{\rm\pi}}\,\text{d}{\it\theta}\boldsymbol{{\rm\nabla}}_{\bot }\boldsymbol{\cdot }(\boldsymbol{u}w)\right]=0.\end{eqnarray}$$
It follows that
 $W_{0}^{\prime }({\it\delta}^{-1})=0$
. This implies that the period-averaged friction at the wall remains the same as for Poiseuille flow. However, since the calculation is with a fixed pressure gradient, the flux for these new travelling states is smaller, and hence the friction factor is higher. On integration by parts, and using the expression for
 $M_{0}$
, (A 61) implies
 $$\begin{eqnarray}W_{0}(\hat{r})=\int _{{\it\delta}^{-1}}^{\hat{r}}(\overline{UW}+\overline{\langle uw\rangle })(s)\,\text{d}s.\end{eqnarray}$$
The integral representation (A 63) also explains the flatness of the
 $k=0$
mode of the streak in the neighbourhood of the origin as the integrand is small when both rolls and waves are small, as found in the numerical calculations. Now, consider the
 $m$
th azimuthal component of the wave which in scaled form satisfies
 $$\begin{eqnarray}\left(\frac{\text{d}^{2}}{\text{d}\hat{r}^{2}}+\frac{1}{\hat{r}}\frac{\text{d}}{\text{d}\hat{r}}-\frac{m^{2}}{\hat{r}^{2}}\right)W_{m}=-2\hat{r}U_{m}+[\boldsymbol{{\rm\nabla}}_{\bot }\boldsymbol{\cdot }(\boldsymbol{U}W)]_{m}+\left(\frac{1}{R{\it\delta}^{4}}\right)^{2/3}\langle \boldsymbol{{\rm\nabla}}\boldsymbol{\cdot }(\boldsymbol{u}w)\rangle _{m}=:M_{m}(r),\end{eqnarray}$$
where the subscript
 $m$
denotes
 $\cos (m{\it\theta})$
Fourier-component for
 $m\geqslant 2$
. Therefore, by requiring
 $W_{m}$
to be regular at
 $\hat{r}=0$
and to be zero at
 $\hat{r}={\it\delta}^{-1}$
, we have
 $$\begin{eqnarray}W_{m}(\hat{r})=\frac{\hat{r}^{m}}{2m}\int _{{\it\delta}^{-1}}^{\hat{r}}{\it\rho}^{1-m}M_{m}({\it\rho})\,\text{d}{\it\rho}-\frac{\hat{r}^{-m}}{2m}\int _{0}^{\hat{r}}{\it\rho}^{1+m}M_{m}({\it\rho})\,\text{d}{\it\rho}+B_{m}\hat{r}^{m},\end{eqnarray}$$
where
 $$\begin{eqnarray}B_{m}=\frac{{\it\delta}^{2m}}{2m}\int _{0}^{{\it\delta}^{-1}}{\it\rho}^{1+m}M_{m}({\it\rho})\,\text{d}{\it\rho}.\end{eqnarray}$$
A.3.1 Far-field behaviour of streak for 4-fold symmetry
$(m_{0}=4)$

We now consider the behaviour of
 $M_{m}$
using the behaviour of the rolls
 $\hat{U} _{m}=(U_{m},V_{m})$
derived earlier, for
 $m=4n$
,
 $n\geqslant 1$
. These are the 4-fold azimuthally symmetric roll and streaks for states such as
 $C2$
that we have computed. We have already deduced that
 ${\it\psi}_{4n}(\hat{r})\sim \hat{r}^{-2n}$
for
 $n\geqslant 1$
and therefore, it will follow that
 $(U_{4n},V_{4n})\sim \hat{r}^{-2n-1}$
. It is consistent to assume (see (A 74) and (A 75) in the ensuing) that the wave contribution to
 $M_{4n}$
is negligible and hence from the decay of
 $(U_{4n},V_{4n})$
it follows at once that
 $M_{4n}\sim \hat{r}^{-2n}$
,
 $W_{4n}\sim \hat{r}^{-2n+2}$
for
 $n\geqslant 1$
. We also note that this implies that
 $M_{0}$
, which has no contribution from the
 $2rU_{0}$
term, will have the asymptotic behaviour
 $\hat{r}^{-4}$
and therefore the asymptotic behaviour of
 $W_{0}(r)\sim \hat{r}^{-2}$
in the regime
 $1\ll \hat{r}\ll {\it\delta}^{-1}$
. In particular, we note that the streak has a dominating contribution like
 $W(\hat{r},{\it\theta})\sim W_{4}(\hat{r})\cos (4{\it\theta})\sim \cos (4{\it\theta})$
in the asymptotic regime. In other words, the streak does not decay and continues to the far field, until the wall effect becomes important. This is seen in figure 18, though limitations in the largeness of
 $R$
, the regime
 $1\ll \hat{r}\ll {\it\delta}^{-1}$
is not quite visible.
A.3.2 Far-field behaviour of streak for 2-fold symmetric states
We now consider the behaviour of
 $M_{m}$
, using the behaviour of rolls
 $\hat{U} _{m}=(U_{m},V_{m})$
derived earlier, for
 $m=2n$
,
 $n\geqslant 1$
. These are the 2-fold azimuthally symmetric roll and streaks for states such as
 $C1$
that we have computed. Recall, we derived
 ${\it\psi}_{2}$
,
 ${\it\psi}_{4}\sim \hat{r}^{-2}$
,
 ${\it\psi}_{2n}\sim \hat{r}^{-2n+2}\ln \hat{r}$
for
 $n\geqslant 3$
. This implies
 $(U_{2},V_{2}),(U_{4},V_{4})=O(\hat{r}^{-3})$
and
 $(U_{2n},V_{2n})\sim \hat{r}^{-2n+1}\ln \hat{r}$
for
 $n\geqslant 3$
, implying from neglect of the wave contribution (see (A 74) and (A 75)) that
 $M_{2},M_{4}\sim \hat{r}^{-2}$
and
 $M_{2n}\sim \hat{r}^{-2n+2}\ln \hat{r}$
, for
 $n\geqslant 3$
. This implies that
 $W_{2}\sim {\hat{c}}_{2},W_{4}\sim {\hat{c}}_{4}$
, which are constants, and
 $W_{2n}\sim \hat{r}^{4-2n}\ln \hat{r}$
for
 $n\geqslant 3$
. We also note that
 $M_{0}$
, which has no contribution from the
 $2rU_{0}$
term since
 $U_{0}=0$
, has asymptotic behaviour
 $\hat{r}^{-4}$
and therefore the asymptotic behaviour of
 $W_{0}(r)\sim \hat{r}^{-2}$
in the regime
 $1\ll \hat{r}\ll {\it\delta}^{-1}$
. In particular, we note that the streak has a dominating contribution like
 $W(\hat{r},{\it\theta})\sim {\hat{c}}_{2}\cos (2{\it\theta})+{\hat{c}}_{4}\cos (4{\it\theta})$
in the asymptotic regime. In other words, the streak does not decay and continues to the far field, until the wall effect becomes important. However, this behaviour is not clear in figure 16, because the behaviour becomes more complicated by the expected occurrence of
 $\hat{r}^{-1}\sin (4{\it\theta})$
in the roll streamfunction appearing in a higher-order analysis and the fact that
 ${\it\delta}$
is not so small in the numerical calculations.
A.4 Analysis of far-field wave equation
Substituting
 $$\begin{eqnarray}p=\mathop{\sum }_{m=0}^{\infty }p_{m}(\hat{r},z)\cos (m{\it\theta})\end{eqnarray}$$
into (4.45) (with
 ${\it\delta}_{3}={\it\delta}^{2}$
), which is valid in the far field for both NVC and VWI states, it is clear that
 $p_{m}(\hat{r},z)$
will satisfy
 $$\begin{eqnarray}\displaystyle & & \displaystyle \partial _{\hat{r}}^{2}p_{m}+\frac{1}{\hat{r}}\partial _{\hat{r}}p_{m}-\frac{m^{2}}{\hat{r}^{2}}p_{m}-\left[\frac{2}{(c_{1}-\hat{r}^{2}+W)}(-2\hat{r}+\partial _{\hat{r}}W)\partial _{\hat{r}}p\right]_{m}\nonumber\\ \displaystyle & & \displaystyle \quad -\frac{1}{\hat{r}^{2}}\left[\frac{2\partial _{{\it\theta}}W}{(c_{1}-\hat{r}^{2}+W)}\partial _{{\it\theta}}p\right]_{m}+{\it\delta}^{2}\partial _{z}^{2}p_{m}=0.\end{eqnarray}$$
If
 $W_{r}\ll \hat{r}$
and
 $W_{{\it\theta}}\ll \hat{r}^{2}$
, which is the case both for 2-fold and 4-fold azimuthally symmetric streaks, then the behaviour in the regime
 $1\ll \hat{r}\ll {\it\delta}^{-1}(1-R^{-1/2+{\it\epsilon}})$
is given by
 $$\begin{eqnarray}\partial _{\hat{r}}^{2}p_{m}-\frac{3}{\hat{r}}\partial _{\hat{r}}p_{m}-\frac{m^{2}}{\hat{r}^{2}}p_{m}+{\it\delta}^{2}\partial _{z}^{2}p_{m}=0\end{eqnarray}$$
with corresponding radial and azimuthal velocities satisfying
 $\partial _{z}u_{m}\sim \hat{r}^{-2}\partial _{\hat{r}}p_{m}$
and
 $\partial _{z}v_{m}=\pm m\hat{r}^{-3}p_{m}$
and axial wave velocity component satisfying
 $\partial _{z}w_{m}\sim -2\hat{r}^{-1}u_{m}$
. The general solution of (A 69) is given in terms of Bessel functions:
 $$\begin{eqnarray}p_{m}(\hat{r},z)=\hat{r}^{2}\mathop{\sum }_{l}\text{e}^{\text{i}{\it\alpha}lz}(C_{l,m}I_{\sqrt{4+m^{2}}}(l{\it\delta}{\it\alpha}\hat{r})+D_{l,m}K_{\sqrt{4+m^{2}}}(l{\it\delta}{\it\alpha}\hat{r})).\end{eqnarray}$$
The equations have to be modified in the regime
 ${\it\delta}\hat{r}-1=O(R^{-1/2})$
to account for the wall boundary layer. However, the radial component
 $u_{m}$
of the wave velocity must be zero to the leading order as the wall boundary layer is approached; hence the only consistent solution corresponds to the choice
 $C_{l,m}=0$
. Now, since
 ${\it\delta}\ll 1$
, in the regime
 $1\ll \hat{r}\ll {\it\delta}^{-1}$
, the expected behaviour of
 $p_{m}$
is given by
 $$\begin{eqnarray}p_{m}(\hat{r},z)\sim \hat{D}_{l,m}\text{e}^{\text{i}l{\it\alpha}z}(\hat{r})^{2-\sqrt{m^{2}+4}}+\text{c.c.}\end{eqnarray}$$
Using (4.73), this gives the leading-order decay rate for wave velocity components perpendicular to the axis
 $$\begin{eqnarray}(u,v)\sim -\frac{1}{\text{i}{\it\alpha}}\text{e}^{\text{i}{\it\alpha}z}\hat{r}^{-2(\sqrt{2}-1)-3}((2\sqrt{2}-2)\sin (2{\it\theta}),2\cos (2{\it\theta}))+\text{c.c.}\end{eqnarray}$$
Using (4.74), it follows that the axial velocity behaves as
 $$\begin{eqnarray}w\sim -\frac{1}{{\it\alpha}^{2}}\text{e}^{\text{i}{\it\alpha}z}\hat{r}^{-2(\sqrt{2}-1)-4}(2\sqrt{2}-2)\sin (2{\it\theta})+\text{c.c.}\end{eqnarray}$$
Also, it may be deduced that the
 $m$
-azimuthal mode for
 $m\geqslant 2$
satisfies
 $$\begin{eqnarray}\displaystyle & (u_{m},v_{m})\sim \hat{r}^{-\sqrt{m^{2}+4}-1} & \displaystyle\end{eqnarray}$$
 $$\begin{eqnarray}\displaystyle & w_{m}\sim \hat{r}^{-\sqrt{m^{2}+4}-2}. & \displaystyle\end{eqnarray}$$
This is quite consistent with the numerical profiles for waves corresponding to the
 $C2$
solution shown in figure 20. Similar decay is observed for the
 $C1$
mode as well.



