I. INTRODUCTION
TiO2 nanomaterials have attracted considerable interest due to their potential applications in photocatalysts, lithium batteries, gas sensors, and solar cells.Reference Kiatkittipong, Scott and Amal1–Reference Nair, Zhu, Babu, Yang and Ramakrishna6 It has been known that the properties of TiO2 nanomaterials depend on their crystal structure, size, and morphology. Recently, many methods have been developed for synthesis of TiO2 nanomaterials with various crystal structures and dimensions.Reference Mao and Wong7–Reference Chen and Mao9 Among these methods, hydrothermal route is a simple and effective way for obtaining TiO2 nanomaterials. TiO2 nanotubes, nanorods, and nanowires/nanoribbons with various crystal phases were prepared by heat treatment of titanate nanotubes and nanowires/nanoribbons at selected temperatures.Reference Armstrong, Armstrong, Canales, Garcia and Bruce3, Reference Mao and Wong7, Reference Shen, Bao, Zheng, Gupta, An and Yanagisawa10–Reference Li, Wan, Zhou, Li and Xu13
In the recent years, doping or surface modification with nonmetals have received great attention.Reference Chen and Mao9, Reference Mitoraj and Kisch14–Reference Sudhagar, Asokan, Ito and Kang16 Carbon-modified TiO2 nanomaterials have been studied due to their excellent physicochemical properties. C-doped TiO2 nanotubes, nanowires, and nanorods were synthesized by thermal treatment of titanate nanotubes with adsorptive ethanol molecules, and the enhanced photocatalytic activity under both visible and simulated solar light irradiation was found.Reference Wu, Dong, Zhao, Wang, Liu and Guan17 Wu et al.Reference Fu, Liu, Zhang, Li, Zhang, Wu and Wu18 prepared TiO2/C core–shell nanocomposites by heat treatment of the TiO2/polyacrylonitrile precursor, which show a better cycle performance and a higher diffusion coefficient of lithium ions. TiO2-B/C core–shell nanoribbons with excellent discharge specific capacity were obtained by a hydrothermal route.Reference Li, Zhang, Liu, Li, Yu, Wang, Li, Liu, Hou, Zou, Zou, Cui and Zou19 Thereafter, anatase TiO2/C composite nanotubes were prepared by a similar hydrothermal route and shown improved electrochemical performance.Reference Zhang, Yan, Zhang, Cai, Wu and Zhang20 These studies have demonstrated that the carbon shell could improve the properties of the TiO2 core. However, there is still limited study for preparing TiO2/C nanostructure with various crystal phases. In this paper, we prepared TiO2@C core–shell nanostructures with different crystal structures of TiO2-B, anatase, and rutile by a simple hydrothermal process and posttreatments. The formation mechanism of the TiO2@C core–shell nanostructures with various crystal structures was discussed.
II. EXPERIMENTAL
A simple synthesis process was performed according to the similar hydrothermal and postheat treatment route of the previous report.Reference Li, Zhang, Liu, Li, Yu, Wang, Li, Liu, Hou, Zou, Zou, Cui and Zou19 In a typical synthesis, 0.5 g of TiO2 (Degussa P25) powder and 0.2 g of glucose were added to 14 mL of 10 M NaOH aqueous solution and stirred for 30 min. The mixture was then transferred into 18 mL autoclave and held at 180 °C for 24 h. The sodium titanate nanoribbons and the hydrogen titanate nanoribbons were obtained by washing the resulting hydrothermal precipitate with distilled water and 0.5 M HCl solution several times until the pH value reached approximately 7 and 6, individually. The sodium titanate nanoribbons and the hydrogen titanate nanoribbons were dried in air at 80 °C for 12 h. For obtaining different TiO2@C nanostructures with various crystal structures, the hydrogen titanate nanoribbons were further heated in a vacuum at 400, 500, 600, 700, 800, 900, and 1000 °C for 4 h, respectively. The structural and compositional information of the products were characterized by Renishaw inVia Raman spectrometer (Renishaw, Gloucestershire, UK) with exciting laser wave length of 514.5 nm and NICOLET AVATAR 370DTGS Infrared (IR) Spectrometer (Nicolet, Madison, WI). The morphologies of the products were characterized by a HITACHI H-8100 transmission electron microscopy (TEM) (Hitachi, Tokyo, Japan) with accelerating voltage of 200 kV.
III. RESULTS AND DISCUSSION
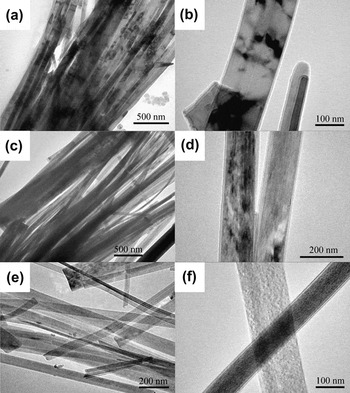
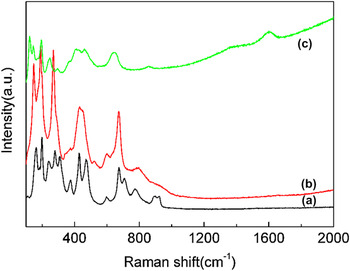
For synthesizing TiO2@C nanostructures, the intermediate products of sodium titanate@carbonaceous nanoribbons and hydrogen titanate@carbonaceous nanoribbons were prepared first. Then, TiO2@C nanostructures with different phases were obtained by heating the hydrogen titanate@carbonaceous nanoribbons at various temperatures in a vacuum. Figure 1 shows the TEM images of the sodium titanate nanoribbons (a, b), the hydrogen titanate nanoribbons (c, d), and the TiO2-B@C nanoribbons (e, f). All the samples are composed of nanoribbons, which are about 50–200 nm in width and several micrometers in length. From the high-resolution TEM images [Figs. 1(b), 1(c), and 1(f)], the samples are all covered with thin sheaths. According to the previous study,Reference Li, Zhang, Liu, Li, Yu, Wang, Li, Liu, Hou, Zou, Zou, Cui and Zou19 it is reasonable to deduce that the shell of the sodium titanate nanoribbons and hydrogen titanate nanoribbons is carbonaceous organic matter originated from aromatization and hydrolyzation of glucose under hydrothermal conditions; the shell of TiO2-B nanoribbons is carbon derived from carbonization and graphitization of the carbonaceous shell under high temperature in a vacuum. The Raman spectra of the sodium titanate nanoribbons, the hydrogen titanate nanoribbons, and the TiO2-B@C nanoribbons are shown in Fig. 2. The Raman spectra [Figs. 2(a) and 2(b)] of the sodium titanate@carbonaceous nanoribbons and the hydrogen titanate@carbonaceous nanoribbons are in good agreement with those of Na2Ti3O7 and H2Ti3O7.Reference Li, Zhang, Liu, Li, Yu, Wang, Li, Liu, Hou, Zou, Zou, Cui and Zou19, Reference Kukovecz, Hodos, Horvath, Radnoczi, Konya and Kiricsi21 There is no Raman signal of the carbonaceous organic matter detected in these samples. A representative Raman spectrum of the TiO2@C nanoribbons is shown in Fig. 2(c). It clearly indicates that the composition of the sample is TiO2-B and carbon.Reference Li, Zhang, Liu, Li, Yu, Wang, Li, Liu, Hou, Zou, Zou, Cui and Zou19 There are two peaks of carbon located at around 1380 cm−1 (D band of amorphous carbon) and 1595 cm−1 (G band of graphite).Reference Ilie, Durkan, Milne and Welland22 Obviously, these results show that the TiO2@C nanoribbons were derived from the H2TiO3@carbonaceous nanoribbons, which combined the dehydration of H2TiO3 cores and the carbonization of the carbonaceous organic shells under high temperature (400 °C) in a vacuum.
TEM images of Na2TiO3@carbonaceous nanoribbons (a and b), H2TiO3@carbonaceous nanoribbons (c and d), and TiO2-B@C nanoribbons (e and f, calcined at 400 °C in a vacuum).

Raman spectra of Na2TiO3@carbonaceous nanoribbons (a), H2TiO3@carbonaceous nanoribbons (b), and TiO2-B@C nanoribbons (c).

In typical hydrothermal process,Reference Mao and Wong7, Reference Li, Zhang, Liu, Li, Liu, Li, Ma, Yu, Wang, Zou, Li, Zou, Cui and Zou11 the sodium titanate formed by the hydrothermal reaction of the high concentration NaOH solution and TiO2 powders. The hydrogen titanate H2Ti3O7 was obtained by washing the sodium titanate with dilute HCl solution. Finally, TiO2 was prepared by heat treating the hydrogen titanate H2Ti3O7. The reaction equations were described as following:
 $$3{\rm{TiO}}_2 + 2{\rm{NaOH}} \to {\rm{Na}}_{\rm{2}} {\rm{Ti}}_3 {\rm{O}}_7 + {\rm{H}}_2 {\rm{O\quad,}}$$
 $${\rm{Na}}_{\rm{2}} {\rm{Ti}}_3 {\rm{O}}_7 + 2{\rm{HCl}} \to {\rm{H}}_{\rm{2}} {\rm{Ti}}_3 {\rm{O}}_7 + 2{\rm{NaCl}}\quad,$$
 $${\rm{H}}_{\rm{2}} {\rm{Ti}}_3 {\rm{O}}_7 \buildrel {{\rm{\Delta}}} \over \longrightarrow \,3{\rm{TiO}}_2 + 2{\rm{H}}_2 {\rm{O}} \uparrow {\rm{\quad,}}$$
In our case, the glucose acts as a carbon source for formation the Na2Ti3O7@carbonaceous nanoribbons and dose not influence the morphology of the final product during hydrothermal reaction.Reference Li, Zhang, Liu, Li, Yu, Wang, Li, Liu, Hou, Zou, Zou, Cui and Zou19 It has been found that the carbonaceous shell of the Na2Ti3O7@carbonaceous nanoribbons is permeable for some ions such as K+ and Na+.Reference Li, Zhang, Liu, Li, Yu, Wang, Li, Liu, Hou, Zou, Zou, Cui and Zou19 Therefore, in our experiment, the Na2Ti3O7@carbonaceous nanoribbons were prepared by hydrothermal reaction and further converted into H2Ti3O7@carbonaceous nanoribbons after acid washing. The H2Ti3O7@carbonaceous nanoribbons were calcined at high temperature in a vacuum. The H2Ti3O7 converts into TiO2; meanwhile, the carbonaceous organic shells transform into carbon shells by carbonization and graphitization.
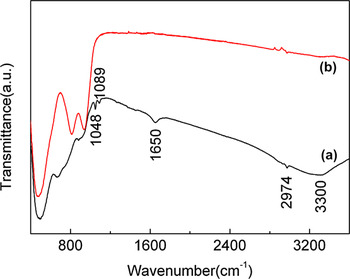
To further demonstrate the transformation from the H2TiO3@carbonaceous nanoribbons to the TiO2@C nanoribbons, IR analysis was performed for these samples. The IR spectra of the H2TiO3@carbonaceous nanoribbons and the TiO2@C nanoribbons are shown in Fig. 3. The strong absorption peaks [Fig. 3(b)] below 1000 cm−1 correspond to titania crystal lattice vibrations.Reference Jiang, Wang, Herricks and Xia23–Reference Wei, Zhou, Konishi, Ichihara, Sugiha and Arakawa25 The bands at around 3300 and 1650 cm−1 observed in the spectra for the H2TiO3@carbonaceous nanoribbons [Fig. 3(a)] are attributed to stretching mode of water and hydroxyl.Reference Jiang, Wang, Herricks and Xia23–Reference Wei, Zhou, Konishi, Ichihara, Sugiha and Arakawa25 The peaks at around 1048, 1089, and 2974 cm−1 are also suggested that organic components exist in the H2TiO3@carbonaceous nanoribbons.Reference Wei, Zhou, Konishi, Ichihara, Sugiha and Arakawa25 In Fig. 3(b), the peaks in the range of 1000–4000 cm−1 are invisible in the TiO2@C nanoribbons indicating that the organic component was removed from the H2TiO3@carbonaceous nanoribbons by the heat treatment. The aforementioned analysis results confirmed that the TiO2@C nanoribbons were obtained from heating the H2TiO3@carbonaceous nanoribbons under high temperature in a vacuum.
IR spectra of H2TiO3@carbonaceous nanoribbons (a) and TiO2-B@C nanoribbons (b).

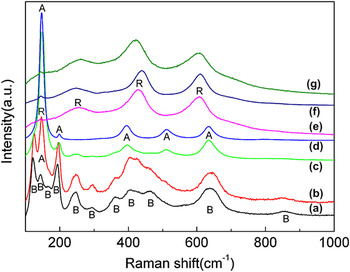
To synthesize TiO2@C nanostructures with different crystal structures, the H2TiO3@carbonaceous nanoribbons were calcined at high temperature (400–1000 °C) and analyzed by Raman and TEM. Figure 4 shows the Raman spectra of the samples heated at different temperatures (500–1000 °C). The TiO2-B@C nanoribbons were obtained by heating the H2TiO3@carbonaceous nanoribbons at 400 °C in a vacuum [Figs. 1(e), 1(f), and 2(c)]. As shown in Figs. 4(a)–4(d), the TiO2-B phase transforms into anatase phase during the temperature range of 400–700 °C. With the increase of temperature, the peaks from anatase become intense and those from TiO2-B become weak. At 700 °C, only anatase phase exists in the sample, which indicates that TiO2-B transforms into anatase completely. In the range of 800–1000 °C, all the Raman peaks originate from rutile phase, indicating that the anatase phase completely transforms into rutile phase at about 800 °C. This phase transition temperature is lower than that of the pure TiO2 nanowires/nanofibers (above 900 °C).Reference Yoshida, Susuki and Yoshikawa26, Reference Pavasupree, Suzuki, Yoshikawa and Kawahata27
Raman spectra of (a–g) the samples heated at 400, 500, 600, 700, 800, 900, and 1000 °C, respectively. B = TiO2-B phase; A = anatase phase, and R = rutile phase.

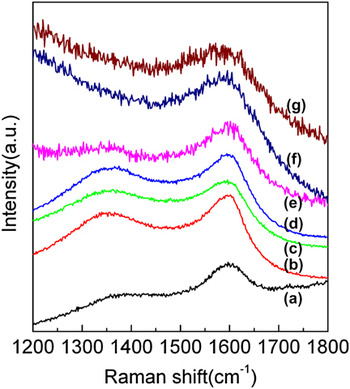
Figure 5 shows the Raman spectra for carbon shells of the TiO2@C samples. The intensity of the Raman band at ∼1380 cm−1 (amorphous carbon) decreased with the increase of heating temperature and disappeared above 800 °C. Only one Raman band at ∼1595 cm−1 is visible above 800 °C, which is attributed to the graphitized carbon. It is clear that the amorphous carbon converts into graphite with the increase of the calcination temperature.
Raman spectra showing graphitic modes in TiO2@C samples heated at (a) 400 °C, (b) 500 °C, (c) 600 °C, (d) 700 °C, (e) 800 °C, (f) 900 °C, and (g) 1000 °C, respectively.

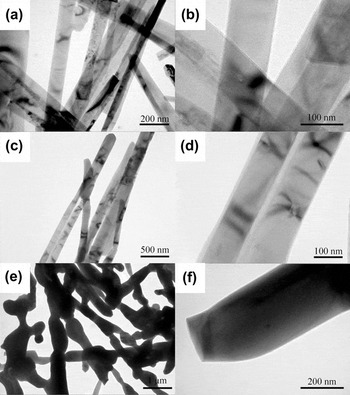
Figure 6 shows the typical TEM images of the samples heated at different temperatures. It is clear that the morphology of the core–shell nanoribbons was retained up to 800 °C during heat treatment. A noticeable change in morphology was observed at 1000 °C; the nanoribbon shape has been changed into a lotus-root-like shape and the size of these lotus roots is larger than that of the original nanoribbons. Combined with Raman data (Figs. 4 and 5), these results show that rutile TiO2 core was obtained at 1000 °C (Fig. 6) with significant increase of the size, but the carbon shell is still remained. The TEM results show that the core–shell nanoribbon structure was maintained up to 800 °C, which is more stable than previous report about TiO2-B nanowires.Reference Yoshida, Susuki and Yoshikawa26 This result suggests that the integrated carbon shells restrain the TiO2 core to further grow and maintain their core–shell nanoribbon morphology up to 800 °C.
TEM images of the samples heated at (a, b) 700 °C, (c, d) 800 °C, and (e, f) 1000 °C, respectively.

It is already known that the phase transformation sequence is TiO2-B–anatase–rutile with the increase of temperature under heat treatment of titanate nanoribbons.Reference Li, Zhang, Liu, Li, Yu, Wang, Li, Liu, Hou, Zou, Zou, Cui and Zou19, Reference Yoshida, Susuki and Yoshikawa26, Reference Pavasupree, Suzuki, Yoshikawa and Kawahata27 In our study, similar transformation sequence was found in the H2TiO3@carbonaceous nanoribbons. When the titanate H2Ti3O7 was heated at 400 °C, the TiO2-B phase was obtained, as shown in Fig. 2(c). At about 500 °C, the TiO2-B@C nanoribbons began to change into anatase TiO2@C nanoribbons and completed at about 700 °C, which is in good accordance with that of TiO2-B nanowires/nanofibers.Reference Yoshida, Susuki and Yoshikawa26, Reference Pavasupree, Suzuki, Yoshikawa and Kawahata27 However, it should be noted that the transformation temperature from anatase to rutile of TiO2-B@C nanoribbons (∼800 °C) is lower than that of TiO2-B nanowires/nanofibers without carbon shell (above 900 °C).Reference Yoshida, Susuki and Yoshikawa26, Reference Pavasupree, Suzuki, Yoshikawa and Kawahata27 This result indicates that the carbon shell plays an important role in influencing the thermal stability of TiO2-B@C nanoribbons. It has been found that carbon layer increases the phase transformation temperature from anatase to rutile in TiO2@C nanoparticles.Reference Shanmugam, Gabashvili, Jacob, Yu and Gedanken28, Reference Lin, Lin, Zhu, Zhao, Xie, He and Zhu29 The carbon layer acts as a barrier for the phase transformation, which is contrary to our result. Comparing with the Raman data for TiO2@C nanoparticlesReference Shanmugam, Gabashvili, Jacob, Yu and Gedanken28 treated at high temperatures in details, we found obvious difference in the graphitization degree of carbon shell. In their samples, the intensity of Raman peak for amorphous carbon is much higher than that in ours at the same temperature, which indicates poor graphitized carbon coated on TiO2 nanoparticle cores in their samples but highly graphitized carbon shells coated TiO2 nanoribbon in our samples. We thus suggest that the difference in the phase transformation temperature is mainly related to the graphitization degree of carbon. A higher graphitized carbon shell might be helpful to transmit the energy to the TiO2 core and improve the phase transformation and then reduce phase transformation temperature due to its higher thermal conductivity.
IV. CONCLUSIONS
In summary, a simple hydrothermal and heat treatment route has been designed for the synthesis of TiO2@C core–shell nanostructures. The TiO2@C nanostructures with various crystal phases were obtained from the heat treatments of the titanate@carbonaceous nanoribbons under high temperature 400–1000 °C in a vacuum. The hydrogen titanate@carbonaceous nanoribbons transformed into TiO2-B@C nanoribbons at 400 °C and further transformed into anatase TiO2@C nanoribbons at 700 °C. Then, the rutile TiO2@C nanoribbons were obtained at 800 °C. Our results show that the morphology of the nanoribbons can be retained up to 800 °C. The transformation temperature (800 °C) from anatase to rutile phase is lower than that of TiO2-B nanowires/nanofibers without carbon layer and anatase TiO2@C nanoparticles. We suggest that the carbon shell of TiO2@C nanoribbons is helpful to remain the morphology of the TiO2 nanoribbons under high temperature and promotes the phase transition from anatase to rutile phase at relative low temperature. Our study provides an opportunity for the further investigation of the TiO2@C nanostructures.
ACKNOWLEDGMENT
This work was supported financially by the National Basic Research Program of China (2011CB808200) and the NSFC (10979001, 51025206, 51032001, 21073071, 11004075, 11004072, 11004138).