I. INTRODUCTION
Ni–8.0 at.%V (Ni–7.0 wt%V) is an important diffusion barrier layer used in the flip chip technologies.Reference Tu and Zeng1–Reference Tsai, Lin and Kao12 Although it is known that interfacial reactions are crucial to the reliability of the solder joints, there are only few studies on the interfacial reactions between solders and the Ni–V substrates.Reference Tu and Zeng1–Reference Tsai, Lin and Kao12 Chen et al.Reference Chen, Chen and Kao2–Reference Chen, Chen and Chang6 found that a new T phase formed in the Sn/Ni–8.0 at.%V couples, and this T phase was a mixture of nanosize Ni3Sn4 phase and an amorphous Sn–V phase. Osenbach et al.Reference Osenbach, Amin, Bachman, Baiocchi, Bitting, Crouthamel, Delucca, Gerlach, Goodell, Peridier, Stahley and Weachock11 and Tsai et al.Reference Tsai, Lin and Kao12 reported that the Sn–V phase was porous with prolonged aging but gave no information on the T phase. Other researchers also observed Sn–V and Sn–Ni–V reaction layers,Reference Liu, Tu, Sheng, Tung, Frear and Elenius7–Reference Jang and Duh10 though the structures and the compositions of these phases were not analyzed. The primary purpose of this study is to examine the microstructural evolutions in the Sn/Ni–8.0 at.%V couples and to correlate the results with those in the literature.Reference Tu and Zeng1–Reference Tsai, Lin and Kao12
II. EXPERIMENTAL
The 0.5 × 6 × 6 mm3 piece of commercial Ni–8.0 at.%V foils (ALFA, Ward Hill, MA) were cut and polished finally with 0.3μm Al2O3 suspension. The polished Ni(V) foil and pure Sn shots (99.97 wt% purity; Showa, Tokyo, Japan) of 2.0 g were encapsulated in a 6mm×8mm quartz tube under a 2 × 10⁻⁵ bar vacuum. It needs mentioning that the “Ni–V” is sometimes referred as “Ni(V)” for briefing and also reflecting the fact that the Ni–V substrate is a Ni solid solution with V solubility. The sample capsules were placed in a furnace at 400 °C for 30 s to ensure proper wetting and followed by water-quenching. The ampoules were then reacted at 210 or 250 °C for predetermined lengths of reaction time.
The reacted couples were mounted in epoxy and polished with 1.0 and 0.3μm Al2O3 suspension. The microstructures of the couples were examined by using optical microscopy (Olympus, BH, Tokyo, Japan) and scanning electron microscope (S-2500, Hitachi, Tokyo, Japan). The accelerating voltage was 15 kV. To have better image contrast, some of the couples were etched with etchant, 95 vol.% HNO3 + 5 vol.% DI water, for 30 s. The compositions of reaction phases were determined from those nonetched samples by using energy dispersive spectroscopy (Oxford 6587, Oxfordshire, England) and field-emission electron probe microanalysis (EPMA) (JXA-8500F, JEOL, Tokyo, Japan). For the EPMA measurements, pure element standards and ZAF corrections were used.Reference Flewitt and Wild13
For the Sn/Ni–8.0 at.%V couple reacted at 250 °C for 40 min, the intermetallic compounds were further analyzed by transmission electron microscope (TEM; FEI Tecnai G2 F-20, Philips, Eindhoven, Netherlands) with 200kV acceleration electron voltage. The TEM specimen was prepared by using the focus ion beam technique (FEI Nova 200, Tokyo, Japan). The microstructures were observed by using bright field mode (BF), and their diffraction patterns were obtained using selected area diffractions mode. Commercial software, Gatan Digital Micrograph (Warrendale, PA), was used to analyze the BF images.
III. RESULTS AND DISCUSSION
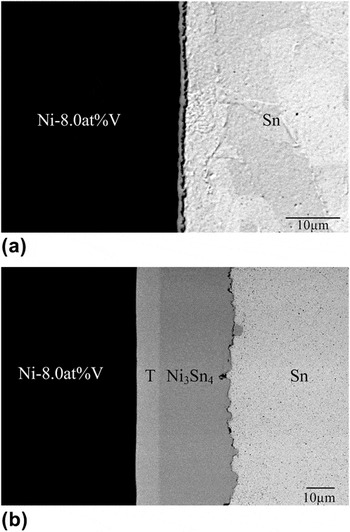
Figure 1(a) is the backscattered electron imaging (BEI) micrograph of the as-prepared Sn/Ni–8.0 at.%V couple. The solder and the substrate were held at 400 °C for 30 s before they were quenched in water. As shown in Fig. 1(a), a reaction layer of 1∼2 μm was formed. Figure 1(b) is the BEI micrograph of the couple reacted at 210 °C for 24 h, and two reaction layers can be observed. Compositional analysis results of the two layers are Sn–20.57 at.%Ni–63.84 at.%V and Sn–43.54 at.%Ni, indicating the T phase layer and the Ni3Sn4 layer, respectively. These results are similar to those previously reported by Chen et al.Reference Chen and Chen3, Reference Chen, Chen and Chang4 Accordingly, it is concluded that the reaction paths in the solid/solid Sn/Ni–8.0 at.%V couples are Sn/T/Ni–V and then Sn/T/Ni3Sn4/Ni–V. It needs mentioning that although the T phase region appears like a single phase region and it is named the “T” phase for consistency with the nomenclature in the literature,Reference Chen and Chen3, Reference Chen, Chen and Chang4 the results in this study and previous studiesReference Chen and Chen3, Reference Chen, Chen and Chang4 have clearly demonstrated that the T phase region is indeed a two-phase mixture.
Backscattered electron imaging (BEI) micrograph of the Sn/Ni–8.0 at.%V couple: (a) as-prepared and (b) reacted at 210 °C for 24 h.

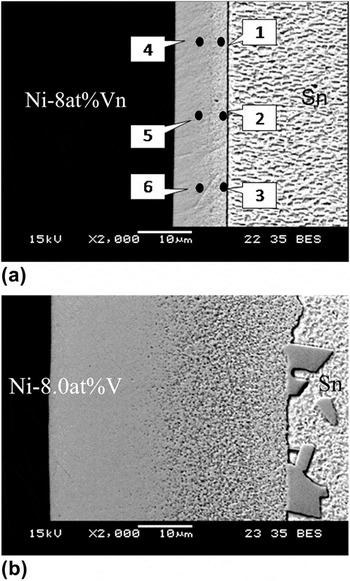
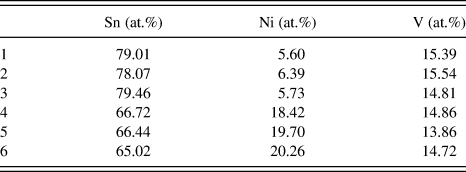
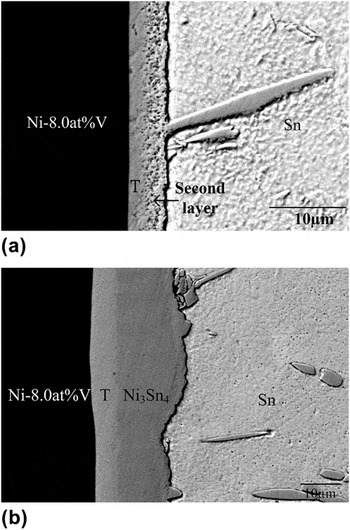
Figures 2(a) and 2(b) are the BEI micrographs of the etched results of the Sn/Ni–8.0 at.%V couples reacted at 250 °C for 40 min and for 24 h, respectively. Two continuous reaction layers and Ni3Sn4 particulates either attached to the second layer or dispersed in the Sn matrix are found. The EPMA measurements along the two different layers are shown in Table I. The positions of the measurement numbers as shown in Table I are marked on Fig. 2(a). Based on the compositional measurements, the gray phase adjacent to the Ni–8.0 at.%V is the T phase as reported by Chen et al.Reference Chen, Chen and Kao2–Reference Chen, Chen and Chang6 The second phase layer adjacent to the Sn phase has lower Ni content and has not been reported previously.Reference Tu and Zeng1–Reference Tsai, Lin and Kao12 It should be mentioned that the contrast between the second phase layer and the Sn matrix is not clear, and the second phase layer can be easily overlooked without etching.
BEI micrograph of the etched Sn/Ni–8.0 at.%V couple: (a) reacted at 250 °C for 40 min and (b) reacted at 250 °C for 24 h.

The electron probe microanalysis measurements along the two different layers in the Sn/Ni–8.0 at.%V couples reacted at 250 °C for 24 h.

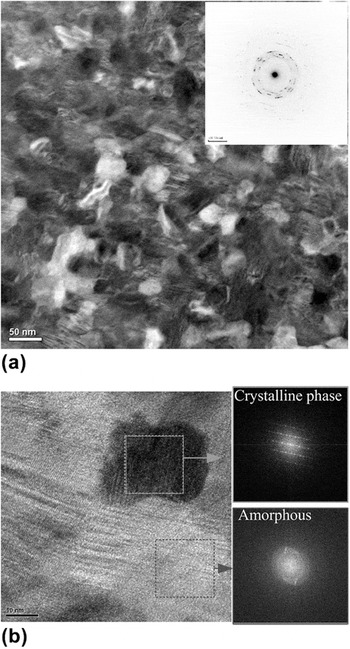
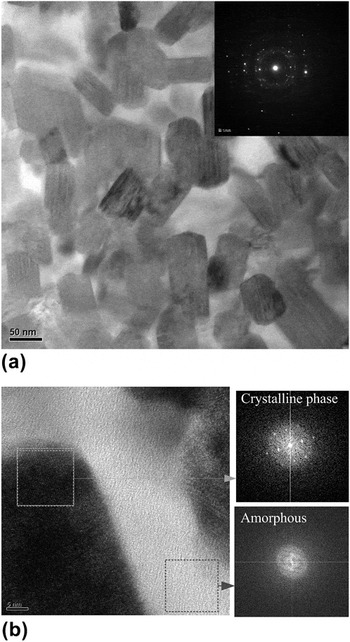
Figure 3(a) is the TEM BF image and the diffraction pattern of the T phase in the Sn/Ni–8.0 at.%V couple reacted at 250 °C for 40 min. From the BF image, it is observed that the T phase has a very fine grain structure with a grain size of about 30 nm. The diffraction pattern of the T phase is shown in the right-side of Fig. 3(a). The diffraction spots are mixed with diffraction rings and are likely to be contributed from the ultrafine grains and an amorphous phase, respectively. Figure 3(b) is another TEM BF image of the T phase with higher magnification, together with two highlighted squares obtained by using the fast Fourier transform (FFT) of highlighted squares in Fig. 3(b). Both from Figs. 3(a) and 3(b), it can be seen that the T phase is composed of a crystalline phase region and an amorphous phase region. The crystalline phase region is the Ni3Sn4 phase while the amorphous phase region is a V-rich region. These results are consistent with the TEM studies by Chen et al.Reference Chen, Chen and Kao2, Reference Chen, Chen and Chang4, Reference Chen, Chen and Chang5
T phase in the Sn/Ni–8.0 at.%V couple reacted at 250 °C for 40 min: (a) Transmission electron microscope (TEM) bright field (BF) image and (b) TEM BF image with higher magnification rate.

Figures 4(a) and 4(b) are TEM BF images and the corresponding diffraction patterns of the second phase layer as shown in Figs. 2(a) and 2(b). It appears that there are darker particulates with size of 50–80 nm dispersed randomly in a brighter continuous matrix. The diffraction patterns on the upper-right corner of Fig. 4(a) are similar to those as shown in Fig. 3(a), which represents a mixture of crystalline phase and an amorphous phase. Moreover, as shown in the right-side of Fig. 4(b), two distinct diffraction patterns, obtained through the FFT, are further indication of the crystalline particulates and the amorphous matrix. The EPMA-determined composition of the darker particulate phase region is Sn–4.2 at.%Ni–17.3 at.%V and that of the brighter phase region is Sn–1.1 at.%Ni–0.5 at.%V. The brighter matrix region is primarily the Sn phase, with very limited solubility of Ni and V.
TEM BF image of the second phase layer in the Sn/Ni–8.0 at.%V couple: (a) reacted at 250 °C for 40 min and (b) reacted at 250 °C for 24 h.

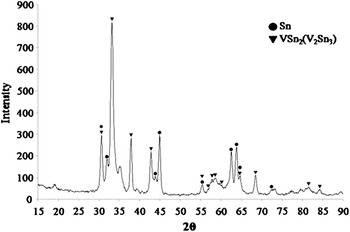
To further analyze the reaction layers, the Sn matrix in the Sn/Ni–8.0 at.%V couple reacted at 250 °C for 24 h was removed. The removal was conducted by very careful polishing so that the Sn layer was completely removed but not overpolished so that the second reaction layer was preserved. Figure 5 is a diffractogram of the reaction layer using the grazing angle x-ray diffraction analyzer, showing both Sn phase and “VSn2(V2Sn3)” phase. It should be mentioned that the phase diagram of the Sn–V binary system has been revised,Reference Chen, Gierlotka and Chen14 confirming that the V2Sn3 phase is better described as VSn2. To avoid confusion, the terminology “VSn2(V2Sn3)” is used in this study.
Diffraction pattern of the reaction layer using the grazing angle x-ray diffraction analyzer.

It is proposed that the T phase layer in the Sn/Ni–8.0 at.%V couple is formed by the fast diffusion of Sn into Ni(V) matrix.Reference Chen, Chen and Kao2–Reference Chen, Chen and Chang6 At 250 °C, the Ni in the outer region of the T phase layer diffuses outward to the molten Sn. The Ni-depleted T phase region transforms into the loosely connected VSn2(V2Sn3) phase, as shown in Fig. 4(a). Since Sn is molten at 250 °C, the liquid penetrates into the reaction layer and mixes with the VSn2(V2Sn3) phase, and the two phases together form the second reaction layer. The reaction path evolutions in the molten Sn/solid Ni–8.0 at.%V couples are liquid/T/Ni–V, liquid/liquid + Ni3Sn4/T/Ni–V, liquid/liquid + Ni3Sn4/liquid + VSn2(V2Sn3)/T/Ni–V, and liquid/liquid + Ni3Sn4/liquid + VSn2(V2Sn3). In the study by Osenbach et al.Reference Osenbach, Amin, Bachman, Baiocchi, Bitting, Crouthamel, Delucca, Gerlach, Goodell, Peridier, Stahley and Weachock11 which was conducted at 150 °C, the solid Sn could not fill in the voids when the loosely connected VSn2(V2Sn3) phase was formed, and thus the reaction layer was porous.
However, no porous VSn2(V2Sn3) phase layer or a reaction phase layer composed of Sn and VSn2(V2Sn3) phases was observed in the solid/solid solder/Ni–8 at.%V couples reacted at 210 °C in this study or those at lower temperatures by Chen et al.Reference Chen, Chen and Kao2–Reference Chen, Chen and Chang6 It is likely the outward Ni-flux from the reaction phase layers into the solid Sn phase is not as large as that into the molten Sn, and it can be balanced by the inward flux from the Ni–V substrate. Thus the reaction layers, the T phase and the Ni3Sn4 phase layer, are sustained without transformation to the porous SnV2(V2Sn3) phase when there is remaining Ni–V substrate.
Figure 6(a) is a BEI micrograph of the Sn/Ni–8.0 at.%V couple reacted at 400 °C for 120 s, and two reaction layers are observed. Figure 6(b) is micrograph of the same couple further heat-treated at 210 °C for another 24 h. It is found that the T phase and the Ni3Sn4 phase grow, while the Sn + SnV2(V2Sn3) layer shrinks. The results indicate that the Ni flux from the Ni–V substrate in the solid/solid Sn/Ni–V couples can “heal” the Ni-deficient layer produced by the liquid/solid reaction at higher temperatures.
BEI micrograph of the Sn/Ni–8.0 at.%V couple: (a) reacted at 400 °C for 120 s and (b) reacted at 400 °C for 120 s and further heat-treated at 210 °C for another 24 h.

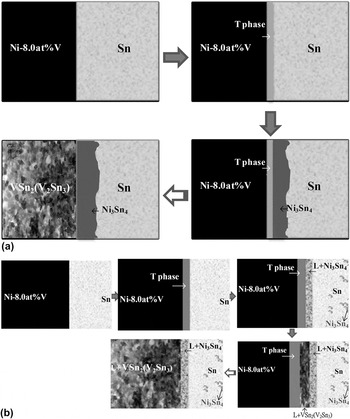
These results support the proposed mechanism in which the T phase is not converted into the porous VSn2(V2Sn3) phase in the solid/solid reactions if there is unreacted Ni–8 at.%V substrate. In contrast to the samples used by Osenbach et al.Reference Osenbach, Amin, Bachman, Baiocchi, Bitting, Crouthamel, Delucca, Gerlach, Goodell, Peridier, Stahley and Weachock11 which had a limited supply of Ni, the samples used in this study and those by Chen et al.Reference Chen, Chen and Kao2–Reference Chen, Chen and Chang6 have relatively thicker Ni–8.0 at.%V layer. Since the Ni–V layer is not completely consumed, the porous VSn2(V2Sn3) phase is thus not observed. This mechanism is further supported by the observation that no porous reaction layer is observed at the solder/Ni–V Under bump metallurgy (UBM) interface in the initial stage of reactionsReference Liu, Tu, Sheng, Tung, Frear and Elenius7–Reference Osenbach, Amin, Bachman, Baiocchi, Bitting, Crouthamel, Delucca, Gerlach, Goodell, Peridier, Stahley and Weachock11 when there are unreacted Ni–V substrates. According to all experimental results determined in this study and those in the literature,Reference Tu and Zeng1–Reference Tsai, Lin and Kao12 the reaction paths in the solid/solid Sn/Ni–8.0 at.%V couples can be further expanded to longer reaction time and are Sn/T/Ni–V, Sn/Ni3Sn4/T/Ni–V, and Sn/Ni3Sn4/VSn2(V2Sn3). The evolution of the solid/solid and liquid/solid paths in the Sn/Ni–8.0 at.%V reaction couples are shown in Figs. 7(a) and 7(b), respectively.
The evolution of the reaction path in the Sn/Ni–8.0 at.%V couple: (a) solid/solid reaction and (b) liquid/solid reaction.

The electrical resistance in the Sn–Pb/UBM(Al/Ni(V)/Cu) couples was determined by Osenbach et al.Reference Osenbach, Amin, Bachman, Baiocchi, Bitting, Crouthamel, Delucca, Gerlach, Goodell, Peridier, Stahley and Weachock11 For reaction at 150 °C up to 463 h, the electrical resistance is almost constant, but the electrical resistance increases almost 500 times to 900 ohms at the end of the reaction for 800 h. According to the reaction paths shown in Figs. 7(a) and 7(b) and the electrical property measurements,Reference Osenbach, Amin, Bachman, Baiocchi, Bitting, Crouthamel, Delucca, Gerlach, Goodell, Peridier, Stahley and Weachock11 it can be concluded that the formation of the amorphous phase region in the solder/Ni(V) interface in the early stage does not cause significant change of the electrical resistance. The formation of the porous Sn–V phase layer is the main cause for the degradation of electrical properties.
IV. CONCLUSIONS
In the initial stage of reaction in the Sn/Ni–8.0 wt%V couples, fast diffusion of Sn into the Ni–V substrate results in the formation of the T phase which is a mixture of crystalline Ni3Sn4 phase and an amorphous Sn–V phase. With further reaction with molten Sn, the outflow of Ni in the T phase to the Sn matrix produces a Ni-depletion second layer and is a mixture of VSn2(V2Sn3) phase and liquid Sn. However, with further reaction at solid/solid state, the outward flux of Ni from the reaction phases is by the Ni flux from the Ni–V substrate, and the porous VSn2(V2Sn3) phase is not formed until the Ni–V substrate has been completely consumed.
ACKNOWLEDGMENT
Authors acknowledge the financial support of the National Science Council of Taiwan (NSC97-2221-E-007-067-MY3).