



1. Introduction
The resonant free-surface response in a narrow gap, gap resonance, is a weakly damped hydrodynamic phenomenon. This may occur between two side-by-side vessels in close proximity where waves cannot efficiently radiate outwards from the narrow gap. One practical application is an offloading operation between a floating liquefied natural gas (FLNG) facility and a carrier (Zhao et al. Reference Zhao, Milne, Efthymiou, Wolgamot, Draper, Taylor and Eatock Taylor2018).
Pioneering studies (Molin Reference Molin2001; Molin et al. Reference Molin, Remy, Kimmoun and Stassen2002) demonstrated that the gap resonance modes are standing waves in the gap and the gap length is close to an integer number of half-wavelengths of each mode. The gap resonances with different but close mode frequencies superpose in the gap, making the resonance motions rather complicated. The narrow width, compared with its length, makes it difficult for wave energy to ‘escape’ from the gap, leading to large responses at resonance. In such a scenario where radiation damping is small, viscous damping becomes relatively important.
Considerable effort has focused on the estimation of the response amplitudes, e.g. by introducing different methods to account for viscous damping (e.g. Chen Reference Chen2005; Faltinsen & Timokha Reference Faltinsen and Timokha2015) or nonlinearity in the free-surface boundary conditions (e.g. Feng & Bai Reference Feng and Bai2015). More recent systematic reviews on the numerical and experimental studies of gap resonance can be found in, e.g. Sun, Eatock Taylor & Taylor (Reference Sun, Eatock Taylor and Taylor2010) or Zhao et al. (Reference Zhao, Wolgamot, Taylor and Eatock Taylor2017).
Much work has looked at linear excitations, where the incoming wave frequency is around that of the gap resonance, with linear transfer functions (LTFs) being heavily investigated. However, gap resonances driven through nonlinear processes are also of practical interest, as the incident wave frequencies can be substantially lower than the resonant frequencies for narrow gaps typical of LNG transfer operations from an FLNG facility. In a wave basin, Zhao et al. (Reference Zhao, Wolgamot, Taylor and Eatock Taylor2017) successfully excited gap resonances using wave groups whose peak frequency was half that of the first gap mode, and found that the gap resonance component driven by frequency doubling could be as significant as the linear response. There are some important open questions remaining on the excitation mechanism, e.g. (1) whether gap resonance can be driven by other higher-order nonlinear processes, giving frequency tripling or even higher multiples; (2) if so, how the gap resonance will behave.
A comprehensive study of gap resonance was made by Sun et al. (Reference Sun, Eatock Taylor and Taylor2010) using potential flow diffraction theory at first and second order. Unfortunately, no method is available to explicitly calculate the third-order cubic transfer function (CTF) for gap resonances. Calculation of complete high-order transfer functions would be very computationally intensive even if it was possible and thus it would be beneficial if a reasonable approximation could be found. Taylor et al. (Reference Taylor, Zang, Walker and Eatock Taylor2007) and Grice et al. (Reference Grice, Taylor, Eatock Taylor, Zang and Walker2015) investigated the sum quadratic transfer function (QTF) of the waves between the legs of multi-column structures, and found that the QTF is a strong function of the output frequency sum and virtually independent of the frequency difference. This observation makes it possible to approximate the whole QTF matrix using only the leading diagonal terms, reducing the number of matrix elements to be calculated from  $O(N^2)$ down to
 $O(N)$. This approximation has a similar empirical form to the Newman (Reference Newman, Bishop and Price1974) approximation for second-order difference force QTF, though the physics is different. Inspired by this, it is reasonable to ask whether a similar approximation can be applied for the sum-frequency QTF of gap surface responses. To answer this question, the structure of the high-order transfer functions for gap surface elevations needs to be examined.
In light of the above, we conducted a series of experiments (using the same set-up as in Zhao et al. Reference Zhao, Wolgamot, Taylor and Eatock Taylor2017) with the focus on the gap resonant behaviour driven through linear and nonlinear excitations. The gap resonance is excited by focused transient wave groups normally incident on two fixed boxes. A brief description of the experimental set-up follows in § 2. Significant gap resonances, which are driven through linear to quartic wave excitations, are reported in § 3. These gap resonances, no matter how they have been driven, behave remarkably similarly. It is striking to observe in § 4.1 that important aspects of the nonlinear sum-frequency transfer functions are very similar (in shape) to each other. It would be too difficult to calculate the complete cubic or quartic transfer functions, but the structure of the QTF is explored in detail in § 4.2. The QTF matrix, in the bi-frequency plane, seems to have a near-flat form in the direction perpendicular to the leading diagonal, leading to the ‘flat’ QTF approximation in § 4.3. A set of narrow-banded irregular wave tests are conducted in § 5, where gap responses are excited both linearly and through nonlinear interactions, e.g. frequency doubling and frequency tripling. For second-order gap responses driven by irregular waves, a reasonable match is achieved between tank test results and prediction using the ‘flat’ QTF approximation. Finally, some conclusions are drawn at the end of this study.
2. Experimental set-up
The experiments were carried out in the deepwater wave basin at Shanghai Jiao Tong University. This wave basin is 50 m long, 40 m wide and the water depth can be adjusted from 0 m to 10 m using an artificial bottom; here the depth was set to 10 m.
As shown in figure 1, two identical rectangular boxes were used in the experiments. The boxes are prismatic and are 3.333 m long. In cross-section they are 0.767 m wide with round corners at both bilges, each with a radius of 0.083 m running along the length. The two boxes are 0.425 m high and immersed such that the undisturbed draft is 0.185 m, leading to a 0.102 m high immersed vertical surface. The two boxes were rigidly mounted on a gantry in the central area of the wave basin in a side-by-side configuration, forming a narrow gap of 0.067 m. The gantry is very robust, so provided enough stiffness to prevent vibration of the box models at frequencies of interest in this study.
Sketch of the two identical side-by-side fixed box hulls in the wave basin in (a) plan view, (b) side view and (c) a snapshot of the two box hulls (yellow) rigidly connected to the gantry (blue).

A resistance-type wave gauge – marked by the red cross in figure 1 – is fixed at the mid-point of the gap, to measure the surface elevations with and without the model in place. The mid-point of the gap was 25.06 m away from the wave paddles and 20 m from the side walls of the wave basin. The experimental set-up is the same as in Zhao et al. (Reference Zhao, Wolgamot, Taylor and Eatock Taylor2017, Reference Zhao, Taylor, Wolgamot, Molin and Eatock Taylor2020), except that the distance (from the wave paddles to the gap) here is increased to allow for a longer measurement window. The quality of the data has been demonstrated in Zhao et al. (Reference Zhao, Wolgamot, Taylor and Eatock Taylor2017), analysis of which is not repeated here.
The experimental models represent 1 : 60 scaled versions of simplified geometry, but we maintain their narrow gap, at around 4 m at full scale. We emphasise that testing such a narrow gap requires a large-scale experiment such that the gap width is much larger than the thickness of the oscillatory boundary layers and, therefore, particularly in beam seas, a large basin. The focus of our tests is to explore the structure of the high-order transfer functions for gap surface responses, aiming to reduce computational effort.
3. Gap resonance driven through different mechanisms
Three sets of experiments are conducted representing different excitation mechanisms, i.e. linear, quadratic and cubic wave excitations. NewWave-type transient wave groups (Tromans, Anaturk & Hagemeijer Reference Tromans, Anaturk and Hagemeijer1991; Jonathan & Taylor Reference Jonathan and Taylor1997) are used as the input waves to excite gap responses. These wave groups are generated based on a narrow-banded Gaussian spectrum, whose spectral peak frequency ( $f_p$) is chosen to be close to the frequency of the first gap mode (
 $f_{m=1}$) in the forms
 $f_p=f_{m=1}$ (linear excitation),
 $2\times {f_p}=f_{m=1}$ (quadratic excitation) and
 $3\times {f_p}=f_{m=1}$ (cubic excitation), respectively. The surface elevations at the centre of the gap were sampled at 40 Hz, with and without the model in place. We note that although the three input wave groups have different centre frequencies, they have the same bandwidth and, equivalently, the same width in time of the group envelope of
 ${\sim }$10 s. Spectral analysis and harmonic decomposition are conducted to investigate the behaviour of the gap resonances and their transfer functions.
3.1. Spectral structure of the incident waves and corresponding gap responses
We obtain three sets of undisturbed incident waves ( $\eta$) in the absence of the model and the corresponding gap surface elevations (
 $\varphi$) with the model in place. The measurement lasts until the wave field is contaminated by reflected waves from the side walls of the wave tank. Spectral analysis is conducted on the undisturbed and response surface elevations, to facilitate the demonstration of the different excitation mechanisms. Figure 2 shows the amplitude spectra obtained from the tests of the linear (with the subscript
 $1\times$), quadratic (
 $2\times$) and cubic (
 $3\times$) wave excitations, respectively. It is worth noting that only the first few odd gap modes are excited due to the symmetry of the experimental set-up. The subplots above the spectral peaks in figure 2 demonstrate the corresponding mode shapes, with the upper (yellow) and lower (light blue) parts referring to the area above and below the still water level in the gap, respectively.
Amplitude spectra of the surface elevations at the centre of the gap with and without the model in place. The dotted curves represent the undisturbed waves  $\eta$ in the absence of the model, and the solid curves the response surface elevations
 $\varphi$ with the model in place. Both
 $\eta$ and
 $\varphi$ are measured at the same position using the same wave gauge. The subscripts
 $1\times$,
 $2\times$ and
 $3\times$ in the legend denote the linear, quadratic and cubic excitation processes, respectively. The shapes of the gap modes are demonstrated above the corresponding spectral peaks.

The spectra of the undisturbed incident waves (dotted lines) exhibit little nonlinearity, as shown in figure 2. Large responses at the first few gap resonance modes are excited in the linear ( $1\times$) case (blue curves), which is not surprising. The most striking observation from figure 2 is that significant surface elevations at the gap resonance modes have been excited in the
 $2\times$ (red curves) and
 $3\times$ (dark green curves) cases, much higher in frequency than the main incident wave components. Thus, they must be driven through nonlinear interactions, i.e. frequency doubling and tripling, where the output sum frequencies are close or equal to the frequencies of the gap resonance modes.
3.2. Nonlinear excitation mechanism
To facilitate the analysis, we discuss the nonlinear wave excitation mechanism here. The undisturbed linear surface elevation at the position of the structure can be written as
 \begin{equation} \eta^{1}=\sum_{j}a_j\exp({\mathrm{i}(2{\rm \pi}{f_j}t+\theta_j)}), \end{equation}
where  $a_j$,
 $f_j$ and
 $\theta _j$ refer to the amplitude, frequency and phase information of the
 $j\textrm {th}$ wave component.
Here we simply take the cubic wave excitation as an example. For a Stokes-type expansion, the cubic frequency gap response can be written as a triple product of linear wave components multiplied by the cubic sum-frequency transfer function. This transfer function is a function of the individual frequencies of three linear wave components,
 \begin{equation} \varphi^{3+}=\sum_{j}\sum_{k}\sum_{l}\mathrm{CTF}(f_j,f_k,f_l)a_ja_ka_l \exp({\mathrm{i}[2{\rm \pi}(f_j+f_k+f_l)t+(\theta_j+\theta_k+\theta_l)]}). \end{equation}
The output frequency of each contribution to the cubic (sum-frequency) gap response is simply the sum of the frequencies of the three linear wave components.
There are two problems associated with evaluating this cubic frequency response: first, the CTF is unknown in general, and secondly, even if it was available, the effort to evaluate the response is  $O(N^3)$, where
 $N$ is the number of components used to define the linear input.
Our assertion, with support being given in § 4, is that this (three-dimensional) cubic transfer function in the tri-frequency space is flat in the two directions away from the sum output frequency direction. Thus, we can write
 \begin{equation} \mathrm{CTF}(f_j,f_k,f_l) {\approx}\mathrm{CTF}_{\mathrm{flat}}\left(\frac{f_j+f_k+f_l}{3},\frac{f_j+f_k+f_l}{3},\frac{f_j+f_k+f_l}{3}\right)= \mathrm{CTF}_{\mathrm{flat}}(\mathcal{F}), \end{equation}
as the assumed flat form of the transfer function is only a function of a single variable, the output sum frequency,  $\mathcal {F}=f_j+f_k+f_l$.
Another simplification of the cubic response term is the efficient identification of the triple product of linear input components. Using the trigonometric expansions for multiple angles, we can replace the cubic amplitude and triple frequency term using
 \begin{equation} A^3\cos3\varTheta=[(\eta^1)^2-3(\eta^1_{H})^2]\eta^1 \end{equation}
for narrow-banded waves, where  $A$ is the local wave amplitude, assumed slowly varying in time, and
 $\varTheta$ is the local phase (Walker, Taylor & Eatock Taylor Reference Walker, Taylor and Eatock Taylor2004). The subscript
 $H$ denotes the Hilbert transform. Then we obtain a simple approximation for the cubic response in the form of a frequency convolution
 \begin{equation} \varphi^{3+}{\approx}\mathrm{CTF}_{\mathrm{flat}}(\mathcal{F}){\circledast}{[(\eta^1)^2-3(\eta^1_{H})^2]\eta^1}. \end{equation}
By analogy, the gap responses driven by other sum-frequency wave excitations are equivalent, e.g. the source terms are  $(\eta ^1)^2-(\eta ^1_{H})^2$ for the quadratic response and
 $[(\eta ^1)^2-(\eta ^1_{H})^2]^2-4(\eta ^1)^2(\eta _H^1)^2$ for the quartic.
3.3. Temporal structure of the frequency harmonics
To better illustrate the nonlinear processes, we examine the frequency harmonics of the gap resonances. In each set of the experiments, we run the same paddle signal four times, but with each input Fourier component being phase shifted at each run. This generates a set of four-wave series, i.e. nominally crest-focused ( $0^\circ$), up-crossing (
 $90^\circ$), trough-focused (
 $180^\circ$) and down-crossing (
 $270^\circ$), all with the same linear envelope. The four-phase wave signals are then combined to extract the first four harmonics, i.e.
 $\eta ^1$,
 $\eta ^{2+}$,
 $\eta ^{3+}$ and
 $\eta ^{4+}$, referring to the terms with frequencies around
 $f_p$,
 $2f_p$,
 $3f_p$ and
 $4f_p$, respectively. The extracted harmonics are associated with the Stokes-type expansion for nonlinear waves. The same idea holds for the corresponding gap resonant responses and, thus, we can separate the first four gap resonance harmonics
 $\varphi ^1$,
 $\varphi ^{2+}$,
 $\varphi ^{3+}$ and
 $\varphi ^{4+}$. For the sake of space, we do not repeat the four-phase decomposition theory here, but details can be found in Fitzgerald et al. (Reference Fitzgerald, Taylor, Eatock Taylor, Grice and Zang2014) or Zhao et al. (Reference Zhao, Wolgamot, Taylor and Eatock Taylor2017). We stress that we look at the harmonics in terms of wave frequency, which should be distinguished from the order of the expansion in terms of nonlinearity (steepness).
The first four harmonics of the undisturbed incident wave groups and the gap resonances are extracted through the four-phase decomposition method. The undisturbed wave field is dominated by the linear component with only small second harmonics being visible and, thus, we only show the first two harmonics. However, here we show the gap resonance signal up to the third harmonics, as we are interested in both frequency doubling and tripling. Figure 3 shows the harmonic components in the case of linear excitation. One can see that the second harmonic  $\eta ^{2+}_{1\times }$ is much smaller than the linear component
 $\eta ^{1}_{1\times }$, confirming little nonlinearity in the undisturbed incident wave field. Significant gap resonant responses with a strong beating pattern in time, which is a result of the gap mode interactions, are excited as shown by the linear component
 $\varphi ^1_{1\times }$ in figure 3. This is not surprising, as the incident wave frequencies are around those of the first few gap resonant modes. The high frequency harmonic signals, which are simply the bound wave harmonics of the linear response, are much smaller than the linear components.
Harmonics of the undisturbed incident wave groups ( $\eta$) and the gap responses (
 $\varphi$) driven by linear excitation, where the incident wave frequencies fall around the frequencies of the gap resonances. The superscripts 1,
 $2+$ and
 $3+$ refer to the linear, second and third sum-frequency harmonics, while the subscript
 $1\times$ represents the linear wave excitation. The undisturbed and response surface elevations are aligned in time, where
 $t=0$ s refers to the focal time of the undisturbed crest-focused wave group.

More interesting phenomena are observed in the quadratic excitation (see the beginning of § 3 for definition) shown in figure 4, where the second harmonic response  $\varphi ^{2+}_{2\times }$ is as large as the linear component
 $\varphi ^{1}_{2\times }$, while the third harmonic
 $\varphi ^{3+}_{2\times }$ is small. The most striking observation is from the cubic excitation shown in figure 5, where a significant third harmonic response is excited. The second harmonic in figure 4 and the third harmonic in figure 5 must be driven through nonlinear processes, i.e. frequency doubling and tripling, respectively, as there is no linear incident wave energy anywhere near the frequencies of the gap modes (see the input spectra in figure 2).
Same as in figure 3, but for the quadratic excitation (marked as  $2\times$).

Same as in figure 3, but for the cubic excitation (marked as  $3\times$). Note the different vertical scales with figure 3. The
 $\hat {\varphi }$ terms (dotted curves) in the bottom subplot refer to a repeated run with smaller incident wave amplitude. Here
 $\zeta$=1.61 is the ratio of the linear incident wave amplitudes between these two experiments.

To support the assertion of the frequency tripling process, we repeat the cubic excitation experiment with incident waves of smaller amplitude, i.e. the linear amplitude ratio of the larger incident wave group to the smaller being  $\zeta$=1.61. The first and third gap response harmonics (dotted curves) obtained from the smaller wave test are given in figure 5, with each being scaled by
 $\zeta$ and
 $\zeta ^3$, respectively. The good agreement between these two sets of experimental results clearly confirms the idea of a frequency tripling process with a cubic dependency on wave amplitude.
Having identified the gap responses driven by frequency tripling, it is an obvious step to explore whether gap resonance can be excited through frequency quadrupling of four linear input components from the low side of the spectral peak. To facilitate the analysis, we provide the spectra of the first four gap response harmonics obtained from the cubic experiment in figure 6(a). The fourth harmonic spectrum (purple curve) shows local peaks in the frequency range 1.0 to 1.2 Hz, corresponding to the gap mode frequencies. We would expect the fourth harmonic signals to obey the same scaling relation between the two experiments of different input wave amplitudes. Figure 6(b) shows the fourth harmonics where the one from the smaller wave test is amplified by a coefficient of  $\zeta ^4=1.61^4$. The amplitude and general shape of these two curves match well, although a slight phase shift is observed. There is probably some contribution to the fourth harmonic response from the simple double frequency bound wave of the frequency doubled gap response as well as a direct quartic response via the local combination of four linear components. It is worth noting that the magnitude of the fourth harmonic response in the smaller wave test is extremely small, i.e.
 ${\sim }$0.3 mm, and, thus, the slight phase misalignment is somewhat unsurprising. Given the discussion above, we believe most of the gap resonance signal
 ${\varphi }^{4+}_{3\times }$ shown in figure 6 is excited by a frequency quadrupling process.
Same (cubic excitation) tests as in figure 5, but focusing on the fourth harmonics. (a) Spectra of the harmonic components in the cubic excitation test (with larger incident wave amplitude). (b) The fourth harmonics of the gap responses, where the one obtained from the smaller wave test  $\hat {\varphi }^{4+}_{3\times }$ is amplified by
 $\zeta ^4=1.61^4$.

The gap resonances, no matter how they have been driven, e.g. linearly, quadratically, cubically or quadruply by compact wave groups, show very similar profiles in time – decaying slowly with similar beating patterns. The slowly decaying process is associated with the weak radiation (wave energy ‘escaping’ from the gap) and small viscous damping for narrow gaps. The beating pattern is a simple interference of the first few gap modes.
4. Structure of nonlinear transfer functions for gap resonances
To shed further insight on the overall gap resonance behaviour in the different sets of experiments, here we examine the structure of the nonlinear transfer functions for gap resonances.
4.1. Geometric similarity in nonlinear transfer functions
The overall gap resonances driven through different mechanisms show very similar behaviour, as demonstrated by the normalised (by their maxima) time histories plotted together in figure 7. The linearly excited gap resonance is not shown for comparison here, because the duration of the excitation by the linear wave group is much longer in time. The gap resonance time history in the quadratic excitation agrees very well with that in the cubic excitation. The one excited through frequency quadrupling agrees slightly less well here, simply because the centre frequency of the input wave group is chosen to excite the cubic interactions efficiently. We would expect to get a better match for the four-wave excitation of the gap with a lower centre frequency. Now we provide some discussion as to why the gap resonances driven through different mechanisms behave so similarly.
Normalised (by their maxima) gap resonances driven through different nonlinear mechanisms, i.e. frequency doubling ( $\varphi ^{2+}_{2\times }$), tripling (
 $\varphi ^{3+}_{3\times }$) and quadrupling (
 $\varphi ^{4+}_{3\times }$) processes. Note the
 $\varphi ^{2+}_{2\times }$ signal is shifted towards the left by 1 s (
 $\sim$ one gap period), to align with the
 $\varphi ^{3+}_{3\times }$ signal at the response peak.

It is convenient to use the term  $n$-TF for the quadratic, cubic and quartic transfer functions, with
 $n=2$, 3 and 4 for what we are calling QTF, CTF and Q
 $^4$TF, respectively. The responses of the gap driven nonlinearly can be written as a
 $n$-multiple integral over the
 $n$-TF
 $\times$
 $n$-products of linear wave components, e.g. (3.2) for the cubic case. Of course, we note that no general diffraction code is currently available for
 $n>2$, yet we aim to provide a method for approximating gap resonances for
 $n=3$ and 4. For the tests, the incident wave group is ‘focused’, so at relative time of zero the phases of all the incident linear components are very close to zero. The phase of the
 $n{\mathrm {th}}$ harmonic bound wave, approximated as the
 $n$-products of linear wave components, should also be zero. The spectra of the groups are Gaussian in form. In terms of output sum-frequency variation across the gap mode frequencies of interest, i.e. the first to third gap modes, the excitation is close to ‘flat’. As far as the gap mode frequencies are concerned, the excitation is zero phase and flat in frequency, so approximates to an impulse excitation. It is therefore expected that the mode response is essentially the impulse response of the gap, and that the variation in time of the gap response should be the same irrespective of whether the excitation is quadratic or cubic. However, we would expect to see some difference for the quartic case as the excitation, estimated from four-wave combination towards the low frequency tail of the input spectrum, is not completely flat in output frequency and, thus, the first three gap modes (
 $m=1$, 3, 5) are not equally excited.
The  $n$-TFs must reflect the output resonant behaviour of the gap – lightly damped resonant peaks at each of the gap modes. Hence, the
 $n$-TFs will have strong variation along the output frequency (
 $n$-sum of linear input frequencies) direction, but little if any variation in all other directions perpendicular to this. We can then approximate the
 $n$-TF in terms of a one-dimensional form along the leading diagonal which is flat in all directions perpendicular to this, e.g. (3.3) for
 $n=3$. As a result, apart from a simple constant scaling factor for each
 $n$-TF, we would expect the modal excitation in the gap to be simply the
 $n$-product of the linear incident wave components combined with the transfer functions in the output frequency direction. If the assumption introduced above is correct, we would then expect that the relative amplitude and phase for all the
 $n$-TFs should look the same, along the output frequency direction.
Based on the measured data, we calculate the LTF and approximate the sum-frequency quadratic, cubic and quartic transfer functions for gap responses. The LTF is obtained simply through the ratio of the spectra between the linear gap response and the linear incident wave, both being extracted through the four-phase decomposition of the measured data, as in Zhao et al. (Reference Zhao, Wolgamot, Taylor and Eatock Taylor2017). The  $n$-TFs are simply approximated as the LTF between the
 $n{\mathrm {th}}$ harmonic of the gap response
 $\varphi ^{n+}$ and the
 $n$-product of the linear waves
 $\eta ^1$, e.g. (3.4) for
 $n=3$. Both the
 $\eta ^1$ and
 $\varphi ^{n+}$ time histories are obtained through the four-phase decomposition of the measured data. We are using the estimated
 $n$-linear wave approximation for the
 $n{\mathrm {th}}$ harmonic, because it represents a simple model which makes it possible to predict the
 $n{\mathrm {th}}$ harmonic excited gap response once the linear input and the
 $n$-TFs are given.
Figure 8 shows the transfer functions for  $n=1$, 2, 3 and 4, as high in frequency as our experiments allow us to go. It is striking that the
 $n$-TFs with
 $n>1$ show very much the same shape both in amplitude and phase. Interestingly, the net phase across the
 $m=1$ gap mode changes by
 ${\rm \pi}$ and again by another
 ${\rm \pi}$ for
 $m=3$. This is consistent with a series of simple one-degree-of-freedom systems, where the phase of the output changes by
 ${\rm \pi}$ across each resonance. The LTF shows a similar shape in amplitude, but with the relative phase being different to that of the CTF. This may be relevant to the details of the excitation process going from the incident waves to the forcing of the gap modes. For the linear excitation (
 $n=1$), the wavelength of the incident wave is of the same order of magnitude as the length of the gap. Hence, the local waves are significantly diffracted. This is different to the
 $n>1$ cases, where the incident free-wave wavelength is
 $n^2\times$ the scale required to drive the gap linearly, so less linear diffraction will occur. The phase for odd order transfer functions is
 ${\rm \pi}$ for frequencies below the first (
 $m=1$) gap mode, whereas it is 0 for the even order transfer functions. This is consistent with the forcing process, i.e.
 $(-1)^n\times n$-product of linear terms.
Transfer functions of the surface resonant responses at the centre of the gap with broadside wave incidence, (a) amplitude for the linear and cubic transfer functions, (b) amplitude for the quadratic and quartic transfer functions, (c) phase for linear and cubic transfer functions, and (d) phase for the quadratic and quartic transfer functions. The non-dimensional transfer functions are written as  $\varphi ^{n+}/L=n\text {-}\textrm {TF}{\circledast }(\eta ^1/L)^n$, so that they are independent of the length (
 $L$) of the model. Here ‘Q
 $^4\textrm {TF}$’ in the legends refers to the quartic transfer function, and the integers 4, 9 and 60 are simply chosen to match the amplitudes of the transfer functions at the
 $m=1$ mode. Note the phase difference
 ${\rm \pi}$ between the phases of (c,d), and the horizontal axis
 $f$ refers to output frequency in these plots.

Given the good similarity between the geometric shapes of these transfer functions, it might be possible to deduce the quadratic, cubic and quartic transfer functions of gap resonances based on as simple as linear-type transfer functions, which would greatly reduce the computational effort. The good similarity, together with the discussion above, supports that the higher-order transfer functions, e.g. CTF in tri-frequency space, should show similar geometric characteristics to the sum-frequency QTF in a bi-frequency plane.
4.2. Near-flat form of gap surface QTF – potential flow calculation
It is possible to calculate the full sum QTF matrix for the gap resonant responses, but it is not clear that it is feasible to calculate the full sum matrices for the cubic and quartic transfer functions. As a consequence, we focus on examining the structure of the sum-frequency QTF matrix here. To achieve this, we calculate the gap response between the two fixed structures (for the configuration in figure 1), by neglecting viscous damping.
The potential flow code DIFFRACT has been used for the numerical simulations. A detailed description of the relevant theory can be found in Chau & Eatock Taylor (Reference Chau and Eatock Taylor1992) and Sun, Eatock Taylor & Taylor (Reference Sun, Eatock Taylor and Taylor2015), and verification of this programme has been demonstrated in previous publications, e.g. Sun et al. (Reference Sun, Eatock Taylor and Taylor2010). Numerical and grid convergence has been confirmed for the results presented here. It is well known that the free-surface elevation at the second order can be written as (see Malenica, Eatock Taylor & Huang (Reference Malenica, Eatock Taylor and Huang1999) for example)
 \begin{equation} \eta^{(2)}={-}\frac{1}{g}\left[\frac{\partial\phi^{(2)}}{\partial t}+\frac{1}{2}\boldsymbol{\nabla}\phi^{(1)}\boldsymbol{\cdot}\boldsymbol{\nabla}\phi^{(1)}-\frac{1}{g}\frac{\partial \phi^{(1)}}{\partial t}\frac{\partial^2\phi^{(1)}}{\partial z \partial t}\right]. \end{equation}
There is a natural separation into potential and quadratic terms to facilitate the interpretation of computed results; see Molin (Reference Molin1979) and Kim & Yue (Reference Kim and Yue1990), for example. In the present case, as in Malenica et al. (Reference Malenica, Eatock Taylor and Huang1999), the resonant response is associated with the potential contribution (the first term in (4.1)).
The sum-frequency QTF matrix of the gap response is calculated at the centre of the gap with broadside wave incidence. We focus on the leading diagonal terms in the bi-frequency plane, by looking at frequency pairs  $(f_j,f_k)$ where
 $j=k$. Figure 9(a) shows the calculated gap surface QTF (modulus) along the leading diagonal. This is very similar in shape to, though larger than, that obtained from the experiments (see figure 8). It is worth noting that the potential flow calculation does not account for any viscous damping, explaining the larger amplitude in the numerical simulations than that from the experiments.
Second-order sum-frequency surface QTF at the centre of the gap from potential flow calculations. (a) Shows the modulus of the transfer function along the leading diagonal and (b) the off-diagonal QTF terms ( $f_j-f_k$) with the corresponding frequency sum (
 $f_j+f_k$) fixed at the frequencies for the
 $m=1$,
 $m=2^*$ and
 $m=3$ modes, respectively. The blue solid dots are calculated using a truncated mesh with meshed radius of
 $0.6\times$ gap length, while the remaining are based on a full mesh with meshed radius of
 $5\times$ gap length. Note
 $m=2^*$ is simply chosen to be the frequency (1.085 Hz) at which the QTF is a minimum between
 $m=1$ and
 $m=3$ modes, as the gap centre is a node for the
 $m=2$ mode which would not be excited in this symmetric configuration.

Here we take advantage of numerical simulations to evaluate the relative importance of the free-surface forcing terms in the gap, and outside the gap. By reducing the radius of the surface over which the free-surface terms are integrated, we show that the results are negligibly affected by the outer free-surface integral and dominated by the local forcing. The approximate results in figure 9 indicate the small differences caused by including the outer free surface, and show the flat behaviour of the local forcing. Further, the calculation shows that scattering of the incident second-order potential is negligible at the peaks of the QTF for gap response.
We then explore the off-diagonal terms in the direction perpendicular to the leading diagonal, i.e. varying the frequency difference ( $f_j-f_k$) when keeping the frequency sum (
 $f_j+f_k$) constant, for the
 $m=1$,
 $m=2^*$ and
 $m=3$ modes, respectively. Figure 9(b) clearly shows that the second-order sum-frequency QTF ridge at the
 $m=1$ mode is approximately constant close to but perpendicular to the leading diagonal. Further away from the leading diagonal, this approximation becomes less reliable. We believe the variation is smaller in the experiments, where viscous damping is included leading to smaller response amplitudes in general. Rather than running as many calculations as for the
 $m=1$ mode, we run four sets for the
 $m=3$ mode, showing clearly a close to flat form for the gap surface QTF. It is worth noting that the
 $m=2^*$ mode here is simply chosen to be the trough between the
 $m=1$ and
 $m=3$ modes, as no anti-symmetric modes could be excited in this symmetric configuration and the gap centre is a node for the
 $m=2$ gap mode.
The second-order potential flow calculation strongly supports the idea that the sum-frequency QTF matrix of gap response, both at and off resonance, has a near-flat form in the direction perpendicular to the leading diagonal in the bi-frequency plane. It is therefore appropriate to assume a ‘flat’ QTF form, so that one can approximate the full sum-frequency QTF matrix based on the leading diagonal terms. We note that a realistic irregular sea state has a high concentration of energy around the spectral peak, and, thus, the quadratic excitation terms are also localized around the leading diagonal.
4.3. Flat QTF approximation
Calculating the full QTF matrix is very time consuming, but the near-flat structure makes it possible to reduce the computational effort greatly. As noted earlier, the sum-frequency QTF of the gap response is a strong function of the output frequency sum ( $f_{j}+f_{k}$) and nearly independent of the frequency difference (
 $f_{j}-f_{k}$).
Here, we approximate the full sum QTF matrix by assuming  $H_{jk}=H_{kj}=H_{((\,{j+k})/{2})((\,{j+k})/{2})}$ with
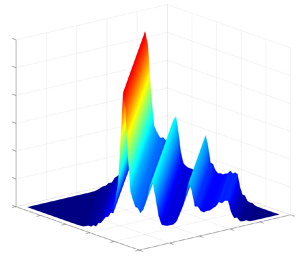
 $H_{((\,{j+k})/{2})((\,{j+k})/{2})}$ being the leading diagonal terms – so a ‘flat’ QTF approximation. As noted, the leading diagonal terms in the QTF matrix could be obtained from the quadratic excitation testing (as shown in figure 4), where the incident wave is a transient wave group with a narrow-band underlying spectrum (see figure 2). These are given in figure 8. Based on the ‘flat’ form approximation, the off-diagonal terms can be easily obtained simply by ‘stretching’ each leading diagonal term along the perpendicular direction. Figure 10 shows the approximated QTF matrix, being ‘flat’ in the perpendicular direction to the leading diagonal in the bi-frequency plane.
Sum-frequency gap surface QTF matrix based on the ‘flat’ approximation. The upper triangular area is for phase information, while the lower part is for modulus. In this bi-frequency plane the leading diagonal terms produced by  $f_j+f_k$ with
 $j=k$ are the same as in figure 8(b) for modulus (divided by 4) and 8(d) for phase. In the perpendicular direction to it, the off-diagonal terms, produced by
 $f_j-f_k$ with
 $f_j+f_k$ being constant, are given in the form of
 $H_{jk}=H_{kj}=H_{((\,{j+k})/{2})((\,{j+k})/{2})}$, with the latest term being from the leading diagonal. Each dashed line, representing an output frequency sum (
 $f_j+f_k$), marks the frequency of each gap mode.

The ‘flat’ QTF approximation reduces the number of calculations significantly from  ${\sim } N^2/{2}$ to
 $N$ for a random sea state, where
 $N$ is the number of linear frequency components used to discretise the wave spectrum. The effectiveness of this approximation is further supported by the experimental data in irregular waves, which is detailed in the following section.
5. Flat QTF performance in irregular waves
Nonlinear transfer functions for gap responses have been approximated based on a ‘flat’ approximation. The ‘flat’ QTF approximation has been supported by both experiments of transient wave groups and numerical diffraction calculations at the second order. To examine the performance of this approximation, we conduct experiments where the gap surface elevation is excited by irregular waves with a realistic relatively narrow-banded spectrum.
5.1. Gap response driven nonlinearly in irregular waves
A unidirectional sea state with a JONSWAP-type form is generated in the basin to excite gap surface responses for the same set-up as for the transient wave tests in § 2. In the experiment the wave generation lasts for 30 min, with the sea state being characterised by significant wave height  $H_s= 0.081$ m, spectral peak frequency
 $f_p= 0.43$ Hz and peak enhancement parameter
 $\gamma =5$. This represents a realistic scenario of swells approaching the gap with broadside incidence.
To facilitate the discussion, the time histories and spectra of the undisturbed incident waves ( $\eta$) and the gap responses (
 $\varphi$) are given in figure 11. The undisturbed incident wave energy is distributed within the frequency range 0.3 to 0.85 Hz – lower than the frequencies of the gap modes. As a consequence, there is no linear wave energy input to excite the gap modes of interest, whose frequencies concentrate around 1.0 to 1.3 Hz. It is worth noting that there are still gap responses being excited, i.e. the blue part of
 $\varphi$ under the incident wave spectrum. These are simply linear responses of the gap surface to the incident waves, where no gap mode is involved – so off resonance. Through frequency doubling, i.e.
 $2\times [0.3,0.85]=[0.6, 1.7]$ Hz, the gap modes can be well excited at resonance. This explains the large gap responses (red
 $\varphi$) beyond the incident wave frequency range. By analogy, the frequency tripling process, producing a frequency range
 $[0.9, 2.55]$ Hz with energy centred at 1.29 Hz, could also contribute to the red part of
 $\varphi$, though its contribution is expected to be extremely small.
Time histories and spectra of the surface elevations at the centre of the gap with and without the model in place. The dotted curve represents the undisturbed waves  $\eta$ in the absence of the model, and the solid curve the response surface elevations
 $\varphi$ with the model in place. The blue part of
 $\varphi$ is driven linearly by the incident waves, while the red part represents those by a nonlinear process. Both
 $\eta$ and
 $\varphi$ are measured at the same position using the same wave gauge.

It is straightforward to distinguish the gap responses driven by linear and nonlinear processes for the case here, based on simple digital frequency filtering. However, the frequency overlapping makes it hard to distinguish the relative contributions between frequency doubling and frequency tripling processes, though the former one dominates. Therefore, we run four-phase testing for the irregular waves as for the transient wave group testing in § 3.3, in an attempt to extract the first four harmonics of the gap responses. The separated harmonic signals allow us to examine the performance of the ‘flat’ QTF (and CTF) in detail.
5.2. Harmonic analysis – calculation vs experiment
Similar to the transient wave group tests in § 3.3, four-phase decomposition is conducted for the irregular wave tests, separating the first four harmonics of the undisturbed incident waves and the corresponding gap responses. For the gap responses, it is noted that the higher harmonic responses beyond the third are negligible, with the third harmonic being small. Therefore, we calculate each of the first three harmonics of the gap responses, using the LTF, QTF and CTF, respectively. The QTF matrix is obtained using the ‘flat’ approximation as demonstrated in figure 10, and the CTF matrix is constructed similarly. The second and third gap response harmonics can be estimated in the way discussed in § 3.2, e.g. using (3.2) for the calculation of the third harmonic, while it is straightforward to calculate the linear harmonic here, i.e. a convolution of incident wave signal ( $\eta ^1$) and the LTF.
The estimated and experimentally determined harmonics of the gap responses are given in figure 12, together with the undisturbed incident waves. One can see that the undisturbed wave field  $\eta$ (with mild steepness
 $k_pH_s=0.06$) is dominated by the linear component with the second harmonic being negligible. As shown in figure 11, the linear wave energy lies outside the gap resonance frequency range, where the components of LTF (not shown here) are smooth and only slightly varying with frequency, quite different to the strongly structured part (due to gap mode resonances) shown in figure 8(a).
Harmonics of the surface elevations at the centre of the gap with and without the model in place. The undisturbed waves in the absence of the model are marked as  $\eta$, and the response surface elevations with the model in place are marked as
 $\varphi$. The subscript ‘
 $e$’ refers to the experimentally determined harmonics, while ‘
 $c$’ represents the results calculated based on the transfer functions shown in figure 8. Note the different scales in the vertical axes.

The linear gap responses show good agreement, which is not surprising. It is however striking that the estimation of second gap response harmonic based on the ‘flat’ QTF matches well to the experimentally determined result. This supports the assumption that the sum-frequency QTF matrix for gap resonances has a close to flat form in the direction perpendicular to the leading diagonal, in the bi-frequency plane.
The agreement in the third harmonic is less satisfactory, which is to be expected. The irregular waves here produces a peak frequency of 1.29 Hz through frequency tripling, which is outside the major gap mode frequencies interested here and, thus, only triggering weak gap resonances. Extracting such a small harmonic signal is much harder in irregular waves than in the transient wave groups in which all harmonics focus at the same time. The experimentally determined third harmonic of the gap response here is thus expected to be less reliable, compared with the first and second harmonics. Given this, the less satisfactory agreement in the third harmonics seems to be understandable – a rather weak support of ‘flat’ CTF. It is worth emphasizing that this irregular wave testing is designed to drive the gap resonances through frequency doubling, with weak frequency tripling being a ‘bonus’.
5.3. Conditioning analysis: application to linear and nonlinear harmonics
The prior section demonstrates the effectiveness of ‘flat’ QTF on a wave-by-wave basis. Here we are interested in its performance on peak responses on an averaged basis in irregular waves.
We now seek to adopt the NewWave-type concept (Tromans et al. Reference Tromans, Anaturk and Hagemeijer1991; Jonathan & Taylor Reference Jonathan and Taylor1997), to look at the average shape of the large incident wave in time (the so-called NewWave) and the resultant gap responses, similar to our analysis for the tertiary wave-structure interactions in Zhao et al. (Reference Zhao, Taylor, Wolgamot and Eatock Taylor2019). This type of analysis allows us to extract NewWave-type profiles and the associated gap responses from the irregular wave test. As a result, it facilitates the comparison of the irregular wave testing results with the transient wave group tests in § 3.3.
The basic idea of this type of analysis involves constructing NewWave-type profiles (similar to the incident wave record in figure 4) from random signals, e.g. the irregular wave elevations, and the associated response profiles. It is noted in § 5.2 that the undisturbed incident waves show little nonlinearity, so are dominated by linear components, while the gap responses beyond the third harmonics are negligible. Therefore, here we focus on the linear incident wave component (marked as  $\eta$ in this section for simplicity) and the linear and second harmonics of the gap responses. A NewWave-type profile is obtained from averaging a given number of the ordered largest profiles in the record, by creating shorter time series with maxima at (relative) time zero. In this study we selected short segments of time history centred at each of the top 15 linear crests in the undisturbed incident wave to obtain the average shape, the so-called NewWave profile (
 $\eta _{e}$) as shown in figure 13(a).
NewWave profile of the (linear) undisturbed incident wave surface elevations ( $\eta$) in the absence of the model, and the harmonic separation of the corresponding gap responses (
 $\varphi$) with the model in place. The subscripts ‘
 $e$’ and ‘
 $c$’ have the same meaning as in figure 12. The shading represents 95 % confidence intervals on the estimation of the mean signals (the solid black curves).

To obtain the associated gap responses, a conditioning process is introduced when performing the averaging process. The reference times, which are used for selecting the peaks of the undisturbed waves when constructing the NewWave profile, are also used to obtain the corresponding local gap responses. Figure 13(b,c) shows the linear ( $\varphi ^1_{e}|\eta _{e}$) and second (
 $\varphi ^{2+}_{e}|\eta _{e}$) harmonics of the gap responses given the NewWave profile of the incident wave. A flowchart which clearly demonstrates the conditioning process has been given in Zhao et al. (Reference Zhao, Taylor, Wolgamot and Eatock Taylor2019), and, thus, we do not repeat it here. It is worth noting that the process here is relatively straightforward, as the first four harmonics are separated, as shown in § 5.2, based on the four-phase signals obtained from running the same wave paddle signals four times with each Fourier component being shifted at each run.
After obtaining the NewWave profile of the incident wave ( $\eta _{e}$), we also calculate the associated gap response harmonics using the LTF and the ‘flat’ QTF. The estimated linear and second harmonics of the gap responses (dotted lines), are compared with the experimentally determined results (black solid lines) in figure 13. Given that the experimentally determined gap surface responses are obtained from an irregular sea excitation with limited duration, the agreement with the estimation is fairly good, though might be improved by increasing the experimental duration. Overall, these results provide some support for the ‘flat’ QTF assumption.
By analogy, we construct the ‘NewResponse’ profiles (average shape of large responses) from the first ( $\varphi ^{1}_{e}$) and second (
 $\varphi ^{2+}_{e}$) harmonics of the gap responses, respectively, and extract the incident wave profiles that give the large responses – the so-called design waves
 $\eta |\varphi ^{1}_{e}$ and
 $\eta |\varphi ^{2+}_{e}$ in figure 14. The design waves are then used as input waves to estimate the first and second gap response harmonics, respectively, together with the LTF and ‘flat’ QTF. Figure 14 shows good agreement between the estimated (dotted lines) and experimentally determined (black solid lines) NewResponse profiles – the most probable maximum responses.
Similar to figure 13, but for the design waves and their produced NewResponse profiles for the linear and second gap response harmonics.

The NewResponse profile  $\varphi ^1_{e}$ shows considerable similarity to its design wave
 $\eta |\varphi ^1_{e}$, though with phase being shifted and amplitude being reduced. This is simply because the LTF is close to be constant (approximately 0.5) across the incident wave frequencies 0.25 to 0.85 Hz as shown in figure 11, where there is no gap resonance.
More interesting phenomena are observed for the second harmonics. The design wave  $\eta |\varphi ^{2+}_{e}$ (in figure 14) with amplitude one-quarter of the NewWave
 $\eta _{e}$ (in figure 13), but with much more critical wave frequency content and phasing, gives rise to the most energetic excitation (the expected maximum gap response), which is now 1.5 times as large. This is a result of the resonant responses of multiple gap modes. Hence, as far as the nonlinear excitation of the gap responses is concerned, the design wave is not the most extreme wave in the incident sea state.
In any future experimental testing or simulations in computational fluid dynamics, the design wave  $\eta |\varphi ^{2+}_{e}$ would be an ideal waveform for examining extreme gap responses driven by a nonlinear frequency doubling process.
6. Conclusions
An extensive set of experiments has been conducted with two identical fixed boxes under the excitation of transient wave groups and irregular waves. The purpose has been to investigate the gap resonances driven through different mechanisms and to explore the structure of the high-order transfer functions for gap surface elevation, associated with such lightly damped multi-mode resonant phenomena.
With various input Gaussian wave groups, significant gap resonances have been excited successfully through different wave excitation mechanisms, i.e. linear excitation, frequency doubling and frequency tripling. Gap resonance, albeit small here, is also excited by frequency quadrupling of components on the low side of the wave group designed to drive the cubic case. We believe the significant resonant fluid response driven by frequency tripling may be a new observation for wave-structure interactions. This phenomenon is somewhat similar to frequency upshifting for light in laser physics (see, for example, Craxton Reference Craxton1981). The frequency quadrupling excitation is probably of academic interest only, but the frequency doubling and perhaps tripling phenomena may be of practical importance for offshore operations involving vessels with narrow gaps and long period incident swell waves such as those generated from severe storms in the Southern Ocean.
The gap resonances behave remarkably similarly once excited, no matter whether they are driven linearly or through a nonlinear process. It is striking to observe that the quadratic, cubic and quartic transfer functions show the same shape in both amplitude and phase. This suggests that the sum-frequency gap resonant transfer function is a strong function of the output frequency sum, and virtually independent of the frequency difference. In terms of the spatial structure, the sum-frequency high-order transfer function matrices would then have a near-flat form in the direction perpendicular to the leading diagonal. This can then be approximated as a perfectly flat form, to reduce computational effort for irregular wave excitations.
We have provided evidence, through direct numerical simulations and analysis of experimental data, to support the flat approximation for the sum-frequency QTFs of gap surface elevations. The flat QTF approximation here is similar, at least in form, to the Reference Newman, Bishop and PriceNewman approximation (Reference Newman, Bishop and Price1974) for difference frequency force QTFs for single bodies in irregular waves. The Newman approximation has the form  $T_{jk}=T_{kj}=(T_{jj}+T_{kk})/{2}$ and works quite well for
 $f_j-f_k\rightarrow 0$, i.e. close to the
 $f_j =f_k$ line; while our flat approximation for sum-frequency QTFs of gap surface elevations has the form
 $H_{jk}=H_{kj}=H_{((\,{j+k})/{2})((\,{j+k})/{2})}$ and apparently does not need to be constrained to the immediate neighbourhood of the leading diagonal. One can infer from this study that the flat form approximation should also hold for the cubic (or quartic) transfer function matrix of gap resonances, though no general third- (or fourth-)order diffraction theory is currently available to confirm this.
The observations in this study show significant value in practical applications. For instance, one can approximate the whole sum QTF matrix using the leading diagonal terms based on the ‘flat’ form approximation. It avoids the lengthy calculation of the whole sum QTF matrix, without losing much accuracy. The approximation makes it possible to predict the complex gap resonant responses driven in an irregular sea state with reasonable accuracy up to the third order, which has not been possible previously.
The NewWave-type analysis, which has been adopted within the scope of linear excitation such as for a M4 wave energy converter (Santo et al. Reference Santo, Taylor, Carpintero Moreno, Stansby, Eatock Taylor, Sun and Zang2017), is further extended to explore the design wave that gives the most probable maximum gap response through a nonlinear frequency doubling process. It is anticipated that this approach may be applicable to a wider range of other nonlinear wave-structure interaction phenomena.
It is worth noting that this study has been focused on gap resonances driven by waves with broadside incidence. Further studies are recommended to explore the effect of different wave headings and the floating body motion, the authors do not see any reason why flatness of the transfer functions in appropriate directions would not hold for these more complex cases as well.
Acknowledgements
The first author is grateful to Churchill College at the University of Cambridge for hosting him as a By-Fellow while most of this paper was prepared.
Funding
This work was funded by research and development grants from the University of Western Australia and was undertaken as part of the Industrial Transformation Research Hub for Offshore Floating Facilities which is funded by the Australian Research Council, Woodside Energy, Shell, Bureau Veritas and Lloyd's Register (grant no. IH140100012). W.Z. is grateful for the DECRA fellowship (grant no. DE190101296) awarded by the Australian Research Council.
Declaration of interests
The authors report no conflict of interest.



