Implications
Incorporating DNA information in beef cattle breeding can increase the effectiveness of genetic evaluations by facilitating the use of abattoir carcass information. This concept could enable faster genetic progress than current genetic technology. The practical requirements needed for successful implementation of this scheme are described in detail.
Introduction
Genomic selection (GS) has been readily adopted by the dairy cattle industry worldwide. The commercial success of this approach is evidenced by the large proportion of semen sales in North America now coming from young genomically tested bulls that have not been progeny proven (Hoards Dairyman, 2011). Furthermore, the methodology has been validated by high correlations between genomic breeding values (GBV) of young bulls and their eventual deregressed daughter-based proofs (Wiggans et al., Reference Wiggans, Van Raden and Cooper2011). The structure of dairy cattle breeding, with high rates of artificial insemination (AI), purebred commercial herds and low effective population sizes (N e), has facilitated this fundamental shift in animal evaluations. AI companies, which are the major disseminators of improved dairy genetics, have been the drivers of this uptake of GS. The high value of prospective AI bulls and the ready-made validation through progeny testing has afforded a relatively low-risk implementation of GS in dairy breeding. AI organisations adopting GS have been able to increase the efficiency of progeny testing (Konig and Swalve, Reference Konig and Swalve2009) through more accurate selection of sire candidates, as well as gaining a competitive advantage through sales of high index genetics.
In contrast, beef-breeding structures in most countries, including the United Kingdom, lack many of these predisposing factors. For example, in the United Kingdom, the influence of AI companies in beef breeding is low, with commercial beef herds almost exclusively using natural service (NS) bulls (Todd et al., Reference Todd, Woolliams and Roughsedge2011). Furthermore, no one breed dominates the market for these bulls; with the top four each contributing between 10% and 30% of the total (Todd et al., 2011). Moreover, correlations between the market value of these bulls and their terminal index (TI) values are modest (Todd et al., Reference Todd, Woolliams and Roughsedge2011). Evidence of selection through positive genetic trends is generally only seen in terminal growth and muscle traits (Garrick, Reference Garrick2011; Todd et al., Reference Todd, Woolliams and Roughsedge2011). The potential financial benefit from genotyping NS bulls is therefore less clear than with the genotyping of elite Holstein AI candidates in the dairy sector.
The NS bulls that disseminate improved terminal genetics in the beef industry are bred in elite purebred herds and then used in cross-breeding commercial suckler herds. In the United Kingdom, there is currently no information flow from the performance of commercial progeny of purebred bulls, and therefore there is no inclusion of this data in the evaluation of elite breeding populations. The genetic correlation between pure and commercial performance (ρ X) is therefore unknown in the United Kingdom and a level of inefficiency, through reranking of sires, may be built into evaluations as a result. This problem could be circumvented by including commercial progeny phenotypes in evaluations in combined purebred cross-bred selection as described by, for example, by Bijma and van Arendonk (Reference Bijma and van Arendonk1998). The ideal GS Scenario will therefore be one that most accurately predicts the performance of purebred genes in the cross-bred cattle population, as described in the simulation studies of Toosi et al. (Reference Toosi, Fernando and Dekkers2009) and Ibanez-Erische et al. (Reference Ibanez-Erische, Fernando, Toosi and Dekkers2009).
Given these structural issues, the path towards implementation of GS in beef breeding has lagged behind the dairy sector. Nevertheless, the first within-breed genomic evaluations have taken place in beef cattle and GBV are now published in US Angus cattle (American Angus Association, 2012). Garrick (Reference Garrick2011) reports correlations of between 0.5 and 0.7 for genomic predictions in US Angus bulls and their deregressed conventional EBV.
The aim of this study is therefore to investigate the genetic gain in terminal traits from a combination of the use of GS with training populations (TP) of varying sizes, made up of single-breed NS sires with phenotypes from their commercial progeny.
Material and methods
Breeding goal and index traits
A TI based on the UK beef value index developed by Amer et al. (Reference Amer, Crump and Simm1998) was used as the selection goal in a deterministic simulation to model the effects of including genomic information in UK beef cattle breeding on genetic gain. This index is derived from 11 selection criteria and five goal traits and is constructed as follows.
Eight selection criteria are currently recorded in live purebred pedigree animals: birth weight direct (BWT-direct), 200-day weight (WT200), 400-day weight (WT400), muscle score (MSC), fat depth (FD), muscle depth (MD), gestation length direct (GL-direct) and calving difficulty direct (CD-direct). A further three selection criteria, carcass weight (CW), carcass conformation score (CCS) and carcass fatness score (CFS), were assumed for the purposes of this study to be available as recorded phenotypes from abattoirs and represent the potential future recording of commercial carcass phenotypes. These three carcass traits together with the two calving traits (GL-direct and CD-direct) constitute the five goal traits in the existing beef value and in the TI used in this study.
Breeding value convention
In this study, traditional breeding values, which are estimated via BLUP and do not include a genomic component, will be referred to as EBV. GBV, which are calculated from genomic information only, will be referred to as GBV. In the literature, GBVs are sometimes referred to as direct genomic values (DGV). The combination of EBV and GBV will be referred to as GEBV, where the breeding value is an index of both traditional and genomic information.
Index methodology
Selection index software developed by Abacus Biotech (NZ) was used to model genetic gain in TI from selection when cross-bred phenotypes of slaughter carcass traits are available to create a genomic predictor for selection in the national beef evaluation. In this model, which considers only additive genetic effects, genomic marker information and cross-bred carcass traits were incorporated as correlated traits within a conventional selection index format as per Dekkers (Reference Dekkers2007a and Reference Dekkers2007b), and the philosophy of this approach is outlined in Supplementary Table S1.
In the Dekkers methodology, a given trait has separate (but genetically correlated) phenotypic (P) and marker (Q) values. This allows conventional BLUP-derived breeding values to be combined with genomic information for greater accuracy when markers do not capture all of the additive genetic variance. Furthermore, with the assumption in this study that only male selection candidates will be genotyped because of cost considerations, not all purebred animals included in evaluations would have GBV information. The accuracy of the marker estimated breeding value (EBV) using the marker data for the component of the genetic value that is associated with the markers (
 $$r_{\mathord{\buildrel{\lower3pt\hbox{$\scriptscriptstyle\frown$}}\over Q}} $$
) for a given trait was predicted following the approach of Daetwyler et al. (Reference Daetwyler, Villanueva and Woolliams2008):
 $$r_{{\hat{Q}}} =\sqrt {{{\lambda h_{o}^{2} } \over {\lambda h_{o}^{2} {\plus}1}}} $$
In Equation (1) h 0 2 is the heritability of the trait, which in this study is interpreted as the squared accuracy of a progeny test, considering 20 offspring records per sire in the TP. λ is the number of phenotypes recorded in the TP divided by the number of QTL underlying the trait. In this study, the number of genotyped animals was varied from 500 to 20 000. The number of QTL affecting the trait was approximated by the effective number of independent segments, following Meuwissen (Reference Meuwissen2009) as:
 $$M_{{\rm e}} =\mathop{\sum}\limits_{i=1}^c {(2N_{{\rm e}} L_{i} )/} {\rm ln}\:{\rm (4}N_{{\rm e}} L_{i} {\rm )}$$
where N e is the effective population size, c is the number of autosomes (29) and L i is the length of autosome i in the bovine map. Equations 1 and 2 allow the model to be applied with varying effective population size and assuming different sizes of TP. The method allows flexibility in the number of traits in the index and it is possible to include or exclude GBV for individual traits. The index values therefore capture the conventional EBV information and the additional information from the GBVs through the correlations in the index model. The maximum GBV accuracy achievable was set at 0.9 in the model used in this study, in accordance with the findings of Daetwyler (Reference Daetwyler2009).
In the current UK Signet genetic evaluations, it is assumed that ρ X is 1.0. In practice, it is likely that ρ X is <1.0 (Nunez-Dominguez et al., Reference Nunez-Dominguez, Van Vleck, Boldman and Cundiff1993; Newman et al., Reference Newman, Reverter and Johnston2002 ), and therefore sensitivity to ρ X was investigated by multiplying existing genetic correlations, which are estimated from purebred data, by a range of ρ X values from 0.4 to 1.0. Within each separate Scenario, genetic correlations were modified by the same value for ρ X.
Parameters for modelling
The UK Limousin breed was used an example population in this study. Phenotypic and genetic parameters for the eight existing recorded traits comprising the TI were taken from national pedigree evaluations of this breed (see Supplementary Tables S2 to S6). The three new recorded commercial carcass traits (CW, CCS and CFS) were assumed to have the same genetic parameters as the existing carcass goal traits (Supplementary Table S3). It was assumed in this study that these parameters were relevant to purebreds. Phenotypic correlations for these new traits with existing recorded traits were not available and therefore values identical to the genetic correlations were used. Purebred and commercial cross-bred versions of the same trait were also assumed to have identical heritabilities (Supplementary Table S1). Given the need to estimate these parameters used in constructing this model, a weighted bending procedure was incorporated to make the correlation matrices positive-definite (Jorjani et al., Reference Jorjani, Klei and Emanuelson2003). The pedigree-based estimate of Ne by Bouquet et al. (Reference Bouquet, Venot, Laloë, Forabosco, Fogh, Pabiou, Moore, Eriksson, Renand and Phocas2010) for the Irish Limousin population (a population of similar size and genetic origin to that in the United Kingdom), of ~300, was adopted for the current study. The bovine autosomal chromosome lengths were taken from Deukwhan and Vasco (Reference Deukwhan and Vasco2011). Information sources for relatives were parameterised according to the level of performance recording for each trait currently taking place in the UK pedigree Limousin population (BASCO, 2012), (see Supplementary Table S7). Generation intervals (5.5 years for male and 6.2 years for female) and proportions of candidates selected (0.2 for male and 0.86 for female) used in the simulations also reflected those currently observed in this population (Todd et al., Reference Todd, Roughsedge, Coffey and Woolliams2012). These assumptions on generation interval will be discussed later in the paper.
Animals genotyped
It was assumed that genotypes of sires with progeny born in commercial herds would be available to constitute the TP to create the genomic predictor. Male selection candidates in the elite population would be genotyped to estimate GBV, with the estimated numbers of these (1600 per year) taken from Todd et al. (Reference Todd, Roughsedge, Coffey and Woolliams2012). The practical genotyping requirements needed to fulfil these assumptions will be discussed later in the paper.
Scenarios modelled
Three scenarios were used to investigate the genetic gain from incorporating GS and cross-bred phenotypes in the TI evaluations. For each of the Scenarios, genetic gains were calculated for TP sizes of between 500 and 20 000 individuals and for three values of ρ X (0.4, 0.7 and 1.0). GBV was included as an option for selection in males, but selection in females was restricted to conventional BLUP-derived EBV only, which reflected the assumption that only male candidates were genotyped. As such, female selection accuracy remained constant in all scenarios, whereas male accuracy increased with increasing TP size. Consequently, total genetic gain (male plus female) was not directly proportional to male accuracy in this study. A further Scenario (4) was considered to evaluate the genetic gain from a conventional progeny test without GS.
Scenario 1: purebred
This Scenario modelled selection for the existing TI comprising eight recorded traits. These traits were first evaluated as EBV only, that is, TP=0, with no genomics which is the equivalent of current gain from BLUP-based selection. The impact of combining these EBVs with genomic information (GBV) to produce GEBVs for these traits in purebred animals was predicted for a range of TP sizes from 500 to 20 000 individuals.
Scenario 2: commercial carcass traits
This Scenario modelled the genetic gain when GBVs were generated from combining phenotypic carcass records of commercial slaughter animals with genotype information from their purebred sires in the TP. In this Scenario, the TI includes information from the three new recorded commercial carcass traits (CW, CCS and CFS) evaluated as GBV, in addition to the purebred EBV information in Scenario 1.
Scenario 3: comprehensive
This Scenario modelled the combination of Scenarios 1 and 2, with the assumption that GBVs were available for commercial carcass traits together with both EBV and GBV for the eight purebred recorded TI traits. This Scenario demonstrates what additional benefit over Scenario 2 is obtained from including GBV for the traits currently recorded for existing TI in addition to the conventional evaluation of these traits.
Scenario 4: conventional progeny test
Genetic gain in TI, using a commercial herd progeny test and not using genomics was also investigated. In this case, genetic gain was predicted when male selection candidates in the elite pedigree population were assumed to have commercial progeny with phenotypic records for the three new commercial carcass traits. Two variations of progeny numbers per sire were considered, 5 and 20. This progeny test Scenario demonstrates the potential inclusion of commercial carcass traits if the United Kingdom were to have a fully comprehensive, traceable and integrated carcass recording system in place in the beef industry combined with a planned progeny testing programme. The same generation intervals assumed for Scenarios 1 to 3 were also used in this Scenario, and this will be discussed later.
Results
Scenario 1: purebred
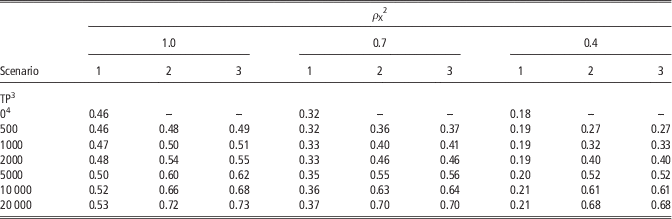
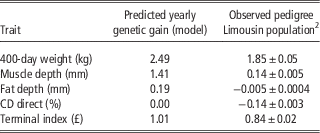
In this case, GS was modelled for purebred traits alone without additional information from commercial phenotypes. The value for TI genetic gain without GS was £1.01 per animal per year at TP=0, which corresponds to current gain from BLUP-based selection. When GS was used with a TP of 2000 sires and a ρ X value of 1.0, 5% extra gain was predicted over current selection. Even for larger TP sizes, male selection accuracy remained low in this Scenario (Table 1). Considering a lower ρ X resulted in a reduction in financial gains in TI, however, the proportional increase in gain with increasing TP size remained the same. The predicted gains of individual traits within the TI, at ρ X=1.0 in Scenario 1, is shown in Table 2, together with the actual corresponding genetic trends (mean over 5 years) observed in the UK Limousin population (BASCO, 2012). Although the overall TI and 400dw predicted gains are similar to actual population trends, greater muscling, fat and lower calving difficulty are predicted than has been actually observed.
Terminal index accuracy for male selection in ScenariosFootnote 1 1 to 3, with varying genomic TP sizes and values of ρ X Footnote 2

1 Scenario 1 represents genomic selection (except for TP=0) using phenotypes and genotypes from purebred live animals only. Scenario 2 represents genomic selection using phenotypes from commercial cross-bred animals with carcass records, together with genotypes from their purebred sires. Scenario 3 represents the combination of Scenarios 2 and 3, with genomic selection using phenotypes from both purebred live animals and the commercial cross-bred animal carcasses, together with genotypes from their purebred sires.
2 ρ X is the genetic correlation between purebred and cross-bred performance.
3 TP is the genomic training population.
4 TP=0 represents the equivalent of current gain with BLUP-based selection.
A comparison of UK pedigree Limousin population genetic trends and the genetic gains predicted by the selection index model used in this study when ρ X=1.0 1

CD=calving difficulty.
1 ρx is the genetic correlation between purebred and cross-bred performance.
2 Regression coefficient of mean EBV or index with s.e. over the period 2005 to 2010 (BASCO, 2012).
Scenario 2: commercial carcass traits
The use of commercial carcass records as phenotypes for TP animals to enable GS in these traits was modelled in this Scenario. The extra gain over Scenario 1 was larger with 15% extra gain with TP=2000 for ρ X=1.0. When assuming ρ X=0.7, the predicted benefit over current gain increased substantially to 38% with TP=2000. With TP=5000 this gain increased to 64%. Notable increases in accuracy were predicted for TP >20 000.
Scenario 3: comprehensive
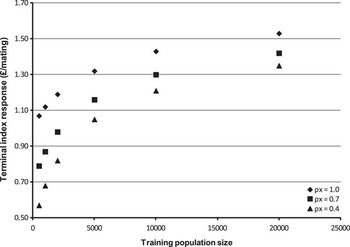
This represents the combination of information from Scenarios 1 and 2, with GS applied to both purebred and commercial carcass traits. Predicted accuracies are of similar magnitude to Scenario 2, with differences reducing as they asymptote. Although accuracy is higher with greater ρ X values, this effect is mitigated with increasing TP size and accuracies gradually converge (Figure 1). Marker information alone (i.e. GBV only for all 11 recorded traits) was predicted to give an accuracy of 0.45 (with ρ X=1.0 and TP=2000), compared with 0.55 for GEBV.
Terminal index genetic gain (£/mating) for Scenario 3 with three variations of genetic correlation between purebred and cross-bred performance, ρ X. Scenario 3 represents genomic selection using phenotypes from both live purebred animals and the commercial cross-bred animal carcasses, together with genotypes from their purebred sires.

Scenario 4: conventional progeny test
A commercial progeny test without GS was predicted to result in a TI gain of £1.23 p.a. per animal, with a male selection accuracy of 0.63 (when ρ X=1.0) for five progeny tests per elite sire. With 20 progeny tests, these values increase to £1.53 and 0.80 male, respectively. The former gain is similar to that in Scenario 3 with a TP of 5000, when the comparison is based on accuracy alone without taking into account potential reductions in generation interval reductions with GS.
Discussion
Genetic gain
This study shows that a synergy between the use of GS and commercial carcass phenotypes has the potential to significantly increase genetic gain over current BLUP selection for terminal beef traits in the United Kingdom, where cross-breeding is the dominant production system. This benefit is possible even without change in selection intensity or generation interval by UK beef breeders. In addition, the inclusion of more commercially relevant phenotypes in the evaluation of elite purebred animals could encourage commercial breeders as a whole to have more confidence in the value of selection indices. Consequently, elite breeders may therefore apply greater selection intensity than currently exists in the UK pedigree Limousin population. The results clearly show that implementation of GS with purebred records alone would result in little extra gain and would miss major opportunities arising from the inclusion of commercial carcasses phenotypes. However, such opportunities would require the joining up of animal data records from several national and commercial sources: British Cattle Movement Service (BCMS), commercial abattoir databases and pedigree genetic evaluation services. It will also be necessary to genotype sires with commercial progeny, and therefore the establishment of suitable DNA repositories within the breed organisations will be necessary to develop suitable TP.
With GS in beef cattle in its infancy, there is limited evidence in the literature with which to compare the genetic gains predicted in this study. Two other simulation studies, Brito et al. (Reference Brito, Braccini Neto, Sargolzaei, Cobuci and Schenkel2011) and Van Eenennaam et al. (Reference Van Eenennaam, van der Werf and Goddard2011), predicted increases in accuracy from the use of GS in terminal beef traits of similar magnitude to this study. Saatchi et al. (Reference Saatchi, McClure, McKay, Rolf, Kim, Decker, Taxis, Chapple, Ramey, Northcutt, Bauck, Woodward, Dekkers, Fernando, Schnabel, Garrick and Taylor2011) reported GBV accuracies of between 0.2 and 0.6 in an evaluation of 3570 US Angus bulls, which used deregressed EBV as phenotypes. Johnston et al. (2012) report GBV accuracy between 0.25 and 0.47 for carcass traits with a relatively small TP of 1031 genotypes of Australian Angus cattle and an increase in accuracy of 0.04 to 0.06 in GEBV over GBV, when blended. The accuracies predicted in the current study are therefore similar to those found in genomic prediction studies in beef cattle. Although the TP levels in these studies were of moderate size, the current study suggests that it may require considerably in excess of 20 000 genotypes to approach the upper end of accuracy achievable with existing single nucleotide polymorphism (SNP) genotyping panels (Table 1).
Estimation of SNP effects
The current study proposes the estimation of SNP effects by genotyping purebred bulls and using phenotypes (for carcass traits) from their commercial progeny. In practice, these offspring would most likely be cross-bred in the United Kingdom (Todd et al., Reference Todd, Woolliams and Roughsedge2011). Another option would be to genotype the cross-bred progeny directly. Here, the sire genotyping has been preferred as this will deliver unbiased breeding values for purebred bulls used as cross-breeding sires even if there is dominance and epistatic variance, whereas using cross-bred data directly can result in biases. As observed by Toosi et al. (Reference Toosi, Fernando and Dekkers2009), the accuracy of GBV can be reduced by the presence of non-additive effects. The bias can be circumvented if it is feasible to identify the parent of origin of the gametes in the cross-breds. This would require additional genotyping and a corresponding increase in cost.
Role of genomics
A key issue with the philosophy adopted in the current study is whether GS is required to achieve the genetic gains in the pedigree population observed in this study. Theoretically, commercial carcass phenotypes could be used in existing conventional BLUP selection without GS. There are three categories of beef sire that have commercial progeny: AI sires, NS bulls used in commercial herds, and NS bulls used in both commercial and pedigree herds. The commercial progeny of AI sires rarely have sire information recorded in BCMS (Todd et al., Reference Todd, Woolliams and Roughsedge2011), and therefore currently cannot be included in genetic evaluations. The offspring of pedigree NS bulls that are only used in commercial herds are effectively the grand progeny of elite sires in the pedigree population, and it is unrealistic to think that selection could be made on this basis, given the large generation interval involved. It is not possible to estimate the numbers of NS bulls that have both commercial and pedigree progeny in the United Kingdom owing to the low level of sire information in BCMS. Pabiou (Reference Pabiou2012) suggested that only 1% of pedigree NS sires in commercial herds in Ireland, a country with a very similar beef breeding structure to that in the United Kingdom, also have pedigree progeny. It therefore appears unlikely that adequate numbers of elite sires with commercial phenotypes can be included in conventional BLUP evaluation with the existing level of UK animal recording. GS can circumvent this problem by genotyping pedigree bulls and thus establishing DNA relationships between those bulls that end up as sires in commercial herds, and obtain progeny with commercial carcass phenotypes and those that are retained as elite sires in the pedigree sector but have no commercial progeny.
One option to include commercial carcass phenotypes without GS, which would require a restructuring of animal recording, would be a commercial progeny test at the point of selection of elite sire candidates. This study has shown that if five commercial progeny per candidate could be recorded, then a genetic gain approximately equivalent to GS with a TP of 5000 sire genotypes could be achieved (Scenario 2, ρ X=1.0). The practicalities of such a progeny test would require three key elements: (1) semen collection of young elite sires that does commonly take place in the United Kingdom; (2) laying-off of bulls during their progeny waiting period; and (3) distribution of this semen to commercial breeders with an incentive to use it within a preset timescale and accurately record sire information in cattle passports. The difficulties, both financial and logistic, in achieving points 2 and 3, have meant that large-scale progeny testing has never been adopted in the UK beef industry. Although the timescale required for a beef progeny test would be similar to the current generation interval in the Limousin population, it is worth noting that lower generation intervals could be achieved with GS. This Scenario has not been investigated in this study as it would require a substantial change in the practices of elite UK beef breeders.
Genomic infrastructure
The size of TP, which is practically feasible in UK beef breeds, will depend primarily on genotyping costs, NS bull population size and practical issues regarding DNA collection. Given that sires of commercial progeny need to be genotyped (and traced through BCMS), a TP of 5000 would require the genotyping of over half the NS Limousin bulls whose commercial progeny have sire information recorded from the total of UK population of 27 000 NS Limousin bulls and considering ~30% of Limousin-sired progeny have sire information in BCMS from Todd et al. (Reference Todd, Woolliams and Roughsedge2011). A total of 2000 genotypes therefore seems a more realistic initial proposition, with the numbers being augmented year on year through retraining and validation of the genomic predictor. In the future, it will be more practical to genotype young bulls bred in elite herds before they are sold as commercial sires and this should increase the size of TP practically achievable. Further reductions in costs could be achieved if imputation from lower density SNP panels is feasible (Garrick, Reference Garrick2011), an avenue that will require investigation in the United Kingdom. Should genotyping costs fall upon the individual owners of these bulls, it is unlikely to be a barrier to implementation, given the value of elite beef bulls (measured in £1000s; British Limousin Cattle Society, 2012) and the falling costs of genotyping (measured in £100’s). Furthermore, the potential revenue from the sales of semen from these bulls is likely to be enhanced with availability of DNA information, particularly in export markets.
Given the NS bull population estimates in Todd et al. (Reference Todd, Woolliams and Roughsedge2011), four other UK breeds are likely to have the numbers of bulls required (and adequate level of sire information in BCMS) for a TP of 2000, namely: Charolais, Simmental, Angus and Hereford. As observed by Garrick (Reference Garrick2011), if effective multi-breed SNP panels are not developed, breeds with small pedigree populations could be marginalised by GS.
Adequacy of the model
The selection index model used in this study was parameterised as far as possible with actual pedigree Limousin population data; however, assumptions were necessary for certain parameters that were unavailable. In particular, identical phenotypic and genetic correlations were used for carcass traits. Gregory et al. (Reference Gregory, Cundiff and Koch1995) reported phenotypic and genetic correlations between carcass weight and carcass fat of 0.67 and 0.51, respectively. Similarly, Hickey et al. (Reference Hickey, Keane, Kenny, Cromie and Veerkamp2007) reported values of 0.22 and 0.26 for the same parameters. Therefore, although the magnitude of these correlations varies across studies (depending on factors such as breed), the relative difference between phenotypic and genetic correlations within study are small, suggesting that the assumption in the current study was a reasonable first approximation. A further assumption was made in ρ X variations, with all traits being modified by the same ρ X value. In practice, it is likely that different groups of traits will display varying magnitudes of genotype by environment interactions (Nunez-Dominguez et al., Reference Nunez-Dominguez, Van Vleck, Boldman and Cundiff1993). However, TI genetic gain was shown in the current study to be largely driven by one trait, 400-day growth (Table 2). Therefore, the value of ρ X for this trait will dominate the predictions, and deviations from this value in other traits will be unlikely to have major consequences on genetic gain predictions. Nunez-Dominguez et al. (Reference Nunez-Dominguez, Van Vleck, Boldman and Cundiff1993) provided estimates of ρ X for 365-day weight averaging 0.77, and therefore ρ X=0.7 is probably the most relevant value used in the current study. Importantly, the cross-bred evaluation envisaged in the current study would provide insight into this key parameter in the United Kingdom.
Although the overall TI genetic gain is very similar between the model and what is observed, some of the predicted trait genetic gains are different from those observed currently (see Table 2). The model simulates selection for the TI and this has resulted in greater genetic gain in muscling traits than that actually observed in the UK Limousin population. In contrast, calving difficulty (CD direct) has virtually no genetic gain in the model, whereas this trait has a negative genetic trend in the UK Limousin population. With only moderate uptake of the TI index (Todd et al., Reference Todd, Woolliams and Roughsedge2011), clearly certain individual traits, such as muscle depth, may be less strongly selected in practice than is reflected by their economic weighting in the TI. This may be because of a continued reliance, by some breeders, on visual appraisal of carcass characteristics in elite selection candidates. This model therefore represents an idealised selection, which nonetheless results in a very similar overall TI genetic gain. The model does, however, predict that current TI gain could be achieved without undesirable reductions in calving ease, through a comprehensive use of EBV and index technology.
Conclusion
In proportional terms, the additional genetic gain from the inclusion of GS and commercial carcass phenotypes was considerable, particularly when considering a realistic ρ X of 0.7 and a feasible TP size of 2000. The increase in genetic gain predicted is similar to that observed in TI after the introduction of BLUP EBV in UK beef evaluations. Implementation using commercial carcass phenotypes in terminal traits could provide a platform for GS in other traits. Importantly, the scheme described in this study does not require major change in UK beef breeding practices.
Obtaining relevant sire genotypes is likely to be the main practical obstacle to GS implementation in the beef sector. To overcome this issue, those breed organisations considering future adoption of GS would be advised to implement a comprehensive programme of DNA collection of young bulls before their sale to commercial herds.
Acknowledgements
Funding for this study was provided by BBSRC and KTN Biosciences. Tim Roughsedge receives funding from the Scottish Government. The authors also wish to acknowledge SIGNET/BASCO for allowing access to data, and the staff of EGENES for help with data management. The authors also thank Peter Amer for constructive discussions.