


Introduction
Within the European Project for Ice Coring in Antarctica (EPICA), drillings of deep ice cores are under way at two sites: Dome C (75˚06′ S, 123˚21′ E; 3233ma.s.l.) in the Indian/Pacific sector, and Kohnen station (75˚00′ S, 0˚04′ E; 2882ma.s.l.) in Dronning Maud Land (DML) in the Atlantic sector of Antarctica. The low accumulation rates at Dome C ensure a climatic record over several glacial cycles. The higher accumulation rates in DML (64 kgm–2 a–1) allow for a more detailed record over the last glacial cycle. Additionally, the possible link between the climate of the Atlantic sector of Antarctica and that of central Greenland via the Atlantic Ocean was a reason to choose the drilling site in DML.
The drilling site in DML was selected after an intensive pre-site survey programme with contributions from Norway, Sweden, the Netherlands, the United Kingdom and Germany. The programme included ice-thickness measurements by airborne radio-echo sounding surveys (Reference Steinhage, Nixdorf, Meyer and MillerSteinhage and others, 1999), ice-flow measurements by global positioning system (GPS), chemical–glaciological investigations (Reference Göktas, Fischer, Oerter, Weller, Sommer and MillerGöktas and others, 2002) and glaciological- and climatological-related investigations (Reference Van den BroekeVan den Broeke and others, 1999; Reference OerterOerter and others, 2000; Reference SommerSommer and others, 2000; Reference GrafGraf and others, 2002). The new deep ice core is labelled EDML (EPICA Dronning Maud Land).
This paper presents the first results of stable-isotope measurements available at a depth resolution of 50cm from the new EDML ice core down to 450m depth. In addition, we investigated with high depth resolution a 50 m section of the EDML ice core. Additionally, we discuss δ18O, deuterium excess and accumulation rate and their variation along the pre-site survey core B31, which are not caused by temperature but probably by changes of the seasonal distribution of accumulation. Further, the paper deals with the relationship between 18O and 2H content and deuterium excess d, the second-order parameter calculated according to
 . It is investigated along the 50m section of EDML and also in the uppermost snow layers adjacent to the deep-drilling site.
The deuterium excess has attracted much attention during recent decades. The δ18O–d relationship in sub-annual resolved profiles has been used to assess the origin of precipitation in Greenland (Reference Johnsen, Dansgaard and CJohnsen and others, 1989) and Antarctica (Reference Ciais, White, Jouzel and PetitCiais and others, 1995). Reference Petit, White, Young, Jouzel and KorotkevichPetit and others (1991) discussed the deuterium excess in recent Antarctic snow. Their considerations are based on the Rayleigh model, which includes kinetic effects (Reference Jouzel and MerlivatJouzel and Merlivat, 1984). Reference Vimeux, Masson, Jouzel, Stiévenard and PetitVimeux and others (1999) found that the deuterium excess over a full glacial cycle is anticorrelated with the Earth’s orbital obliquity. Reference Johnsen, Clausen, Cuffey, Hoffmann, Schwander, Creyts and HondohJohnsen and others (2000) pointed out that the δ18O–d relationship is not stable during metamorphism and that diffusion processes in firn and ice lead to an in-phase relationship of δ18O and d profiles.
Field and Experimental Work
During the EPICA pre-site survey in the austral summer of 1997/98, two medium-depth ice cores, B31 and B32, were drilled (Fig. 1). Near-surface snow around the EDML drilling site was sampled several times. Here we use samples from the snow pit SS0302 dug in the 2002/03 season (Table 1). The sampling interval was small enough (1–1.5 cm) to ensure the detection of seasonal variations in the isotope profiles.
Area under investigation on Amundsenisen, DML, with ice-core and snow-pit locations mentioned in the text: Kohnen station (EDML core), DML05 (B32 core) and DML25 (snow pit) as well as DML07 (B31 core) (see also Table 1). CV marks the location of Camp Victoria (Reference HolmlundHolmlund and others, 2000).

Snow pit and ice cores used in this study
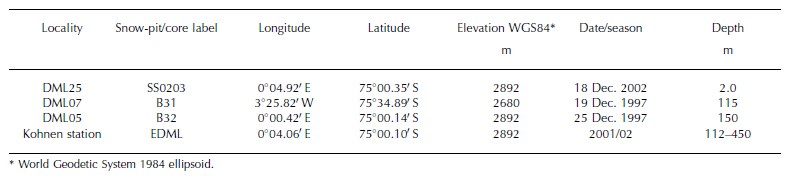
In the 2000/01 field season a borehole was drilled from 12.6m below surface down to 113m depth, and the core (78mm diameter) was recovered. The hole was later reamed to put the casing in. This core section has not been analyzed so far, but ice core B32 drilled at DML05 close to Kohnen station (Table 1) can supplement the EDML record. Finally, in the 2001/02 field season the deep drilling for the EDML ice core (98mm diameter) started with a core recovery from 113 m down to 450 m depth. Here we present results of the analysis of 50 cm samples and results of the 50m section from 123 to 173m depth, which was analyzed in greater detail (5cm interval). Dielectric profiling (DEP) of the cores had already been performed in the field. For isotope analysis the cores were subsampled in the cold laboratory at the Alfred Wegener Institute (AWI), Bremerhaven. Stable-isotope analyses were performed at the laboratories of the former GSF-Institute for Hydrology, Neuherberg, and of AWI, Potsdam. Isotope results are given as deviation from the standard Vienna Standard Mean Ocean Water in %; the accuracy of the measurements is in general better than ±1% for δ2H, ±0.1% for δ18O and therefore ±1.5% for the deuterium excess d.
Snow pit SS0203 was stratigraphically dated using the δ18O profile. The ice cores to medium depth were first dated with the continuous flow analysis profiles and a densification model (Reference SommerSommer and others, 2000); later the dating of core B32 was slightly revised by additional layer counting from 84.5m (AD 1100) down to the bottom of the core at 148.8m depth (personal communication from F. Traufetter and others, 2003). Accordingly, core B31 reaches 115m depth at AD 460 and core B32 reaches 148.8m depth at AD 166 ± 24. A preliminary time-scale for the EDML core was established with the DEP profile, by comparison with the Dome C ice core, and a densification model (personal communication from J. Schwander, 2003).
Results and Discussion
Ice core EDML: low-resolution profiles
The records of the EDML and B32 cores were synchronized using the DEP profiles and profiles for non-sea-salt (nss) sulphate of B32 (personal communication from F. Traufetter and others, 2003) as indicators for volcanic horizons. Following the dating of B32, the two records overlap in the time-span AD 166–612. The accumulation rates and the mean isotope contents are somewhat different at the two locations. The accumulation rate at the EDML ice-core site is 3.7% higher than at DML05 (B32), and the mean 18O content at Kohnen station (EDML) is 0.33% higher than at DML05 (B32).
The EDML core was measured for a first inspection at a much lower time resolution (50 cm samples or about 8 years) than B32 (about 1 year). To combine the records, 10 year means were calculated (Fig. 2). The two records are not correlated, a clear indication of the low signal-to-noise variance ratio at this time period in DML (cf. Reference GrafGraf and others, 2002). The whole record goes about 7000 years back in time and displays a stable Holocene climate. However, there is a remarkable decrease in δ18O values by 0.16%ka–1, which starts around 4000 BP. Similar tendencies have been found in other places in Antarctica, at Remote Plateau (Reference Mosley-Thompson, Bradley and JonesMosley-Thompson, 1992) and Taylor Dome (Reference SteigSteig and others, 2000), but not at Dome C (Reference JouzelJouzel and others, 2001; Reference StenniStenni and others, 2001). There is no explanation for this so far.
Time series of 18O contents (10 year means) deduced from ice cores B32 and EDML, which were drilled at slightly different positions (Table 1) and supplement each other. The smoothed curve (thick line) has been calculated using a Gaussian low-pass filter over 300 years. Note the decrease in δ18O since 4000 BP (regression line). The depth section of the EDML core (123–173 m) for which higher-resolution measurements are available (Fig. 3) is marked by arrows.

Ice core EDML: high-resolution profiles
Isotope measurements were done on the EDML ice core in the depth range 123–173 m, for high-resolution analysis on 5 cm long subsamples corresponding to about 70% of the annual-layer thickness (Fig. 3). The records are characterized by low variability and reveal this period of the Holocene (about 1330 to 2030 BP), also in this time resolution, as climatically stable.
Depth profiles of the 18O contents and deuterium excess values of the EDML ice core at 123–173m depth. Raw data and profiles filtered with a Gaussian low-pass filter over 7.5 m. The low-pass filtered profiles were sampled every 5 m (cf. Fig. 4).

This part of the ice core was also used to investigate the δ18O–d relationship. For this purpose, high- and low-pass filtered profiles were calculated, which consist of all harmonics with wavelengths <0.5m and >7.5m, respectively. The low- and high-frequency parts of δ18O and d profiles are differently correlated (Fig. 4). A positive correlation exists between the high-pass filtered profiles. This is probably due to diffusion processes which affect the δ18O and δ2H profiles differently and force the d profile to vary in phase with the δ18O profile (see Reference Johnsen, Clausen, Cuffey, Hoffmann, Schwander, Creyts and HondohJohnsen and others, 2000). The δ18O profile is more strongly smoothed by diffusion than the δ2H profile due to different fractionation factors and this can create an artificial annual cycle in the deuterium excess, which is in phase with the annual cycles of δ18O and δ2H. Such post-depositional effects can probably also be seen in sub-annually resolved profiles from snow-pit samples (cf. Fig. 7). The correlation between the low-pass filtered profiles (cut-off wavelength >1 m) is always negative.
Correlation between deuterium-excess d and δ18O data: high-pass filtered profiles (left) and low-pass filtered profiles (right). The low-pass filtered profiles were sampled every 5 m, as indicated in Figure 3, because there are no independent elements in the low-pass filtered profiles.

δ18O and d depth profiles at the position of snow pit SS0203, close to the EDML drilling site (Table 1). The vertical lines indicate the annual layering and mark the austral summer (December–January).

This could indicate either changes in the evolution of the snow cover or temperature fluctuations, yet the gradient d(d)/d(δ18O) of –0.6 favours climate fluctuation. Gradients of about –0.6 are expected for temperature fluctuations (cf. Reference Petit, White, Young, Jouzel and KorotkevichPetit and others, 1991, Fig. 2), assuming that the temporal and spatial slopes are similar, whereas lower values of about –1.0 are expected for changes of the seasonality within the snow cover as indicated by snow-pit data (see below). Changes in the seasonal evolution of the snow cover have not been observed at the EDML drilling site, but may occur at other locations in DML as the following study of core B31 shows.
The 1500 year 18O, deuterium-excess and accumulation-rate records of B31
Cores B31 and B32 were analyzed for both the 2H and 18O content so that time series of the deuterium excess could be derived at sites DML07 and DML05, as well as the record of the accumulation rates (Reference SommerSommer and others, 2000) and the 18O contents. At the position DML05 (core B32) none of these series is striking. However, at the position DML07 (B31) drastic changes of all parameters occur within 200 years from AD 1000 to 1200 (Fig. 5; Table 2). 2H and 18O contents decrease, whereas the accumulation rates and the deuterium excess increase. Possible causes for the observations are changes in temperature or changes in the seasonal distribution of accumulation.
Annually resolved time series of the accumulation rates, 18O contents and deuterium excess values deduced from ice core B31 at site DML07. The core was dated back to AD 1030 by annual-layer counting, and before that date by means of a densification model, assuming a constant accumulation rate (Reference SommerSommer and others, 2000). Means over the periods AD 500–1000 and 1200–2000 are shown. Notice the contemporaneous changes of all parameters between AD 1000 and 1200 (Table 2).

2H and 18O contents, deuterium excess values (d) and accumulation rates (A) at DML07 (core B31) before AD 1000 and after AD 1200

Temperature changes can be ruled out for three reasons. Firstly, the decrease of the 2H and 18O contents (decrease in temperature) is not compatible with the simultaneous increase of the accumulation rates, because temperatures and accumulation rates are positively correlated. This is indicated by spatially distributed data in DML (Reference OerterOerter and others, 2000) and by the stacked DML records (Reference GrafGraf and others, 2002). Secondly, the increase of the deuterium excess is too great (in comparison to the decrease of the 18O content) to be temperature-induced. Finally, at no other drilling site in DML have similar changes of isotope content been found, neither in the north at site DML05 nor in the south at Camp Victoria (CV; Fig. 1) (Reference HolmlundHolmlund and others, 2000).
Most probably, the records vary because of changing seasonality in the snow cover. The simultaneous changes of all parameters could be explained to a great extent assuming a higher summer-to-winter precipitation ratio before than after AD 1000. Further, the low accumulation rates before AD 1000 are the result of slightly reduced summer and strongly reduced winter precipitation preserved in the snowpack. The reverse trend in δ18O and d corresponds to the negative correlation of 18O contents and deuterium excess values in the newly fallen surface snow (see below). These qualitative considerations are illustrated in Figure 6. The isotopic profiles were calculated with an equation which was also used in diffusion experiments by Reference Cuffey and SteigCuffey and Steig (1998) and assuming a δ18O–d relationship of d(δ18O)/d(d) = –1. This interpretation of the data is supported by the nss-sulfate record. Along core B31 they change together with the other parameters and are higher before than after AD 1000 (Reference GöktasGöktas, 2002). This is compatible with a higher summer-to-winter accumulation ratio. Note that nss-sulfate concentrations are highest in the summer layers.
Change in the seasonality of the snow cover which could explain the time series of the isotope content (δ18O, d) and accumulation rates at site DML07 (B31). The isotopic profiles were calculated with an equation, which was also used in diffusion experiments by Reference Cuffey and SteigCuffey and Steig (1998).

There are clear indications from ground-penetrating radar measurements that the accumulation rate decreases upstream of the drilling site (Reference Rotschky, Eisen, Wilhelms, Nixdorf and OerterRotschky and others, 2004). Possibly, the accumulation record at DML07 reflects the spatial distribution at the surface. In any case, this example demonstrates impressively that the stable-isotope content is a multi-parameter proxy. Along the EDML core, it is not expected that the seasonality of the snow cover will change. At least there are no indications for a change from the accumulation pattern (Reference Rotschky, Eisen, Wilhelms, Nixdorf and OerterRotschky and others, 2004) and the distribution of the 18O and 2H contents of the firn upstream of the drilling site.
Near-surface snow
The correlation of the δ18O and d is different for low- and high-pass filtered profiles, as demonstrated above with the high-resolution isotope measurements for the EDML core. Further investigations were made of the δ18O–d relationship in near-surface snow. The δ18O profile of snow pit SS0203 exhibits seasonal variations, very similar to those of an older pit, where the annual layering was confirmed by chemical profiles (Reference Göktas, Fischer, Oerter, Weller, Sommer and MillerGöktas and others, 2002) (Fig. 7). This indicates, that the snow cover is built up from precipitation of all seasons. The records from an automatic weather station operated by University of Utrecht at DML05 support this, but also show that most of the accumulation occurs during single snowfall events (Reference ReijmerReijmer, 2001). The δ18O profile gives no hint of the episodic occurrence of snowfall events; rather the profile is smooth. It may be that the precipitation temperatures change moderately or that diffusion or the redistribution and erosion of the snow surface by wind action has smoothed the profiles. Some seasonal layers in the profiles are missing (e.g. the summer layer 1996/97). The uppermost two annual layers in pit SS0203 look disturbed. This might be due to field activities in the year before the pit was excavated.
The 18O content as well as the d values vary with the season, showing clear and systematic signals. The δ18O and the d profiles seem to vary in anti-phase in the upper layers and become in phase in older layers. Model experiments will clarify whether diffusion processes (Reference Johnsen, Clausen, Cuffey, Hoffmann, Schwander, Creyts and HondohJohnsen and others, 2000) can induce this change in the phase relationship, so that the d and δ18O values, out of phase by 180° in the newly fallen snow, tend to become in phase during snow metamorphism (Fig.8).
Cross-correlations between the 18O content and the d values in the snow cover at SS0203, sampled on 18 December 2002. To perform the correlation, the profile data were converted to monthly resolved time series using 18O stratigraphy for dating and assuming equal accumulation rates throughout the year. For further explanation see text.

Conclusion
The new EDML ice core demonstrates a stable Holocene climate over the last 7000 years. During the last 4000 years, a small decrease in the 18O content is observed, which might indicate a slight cooling in this part of Antarctica.
Generally, stable-isotope records are influenced by many parameters. The components have to be separated to extract the component of interest (e.g. the climate signal). In the case of noise, techniques for noise reduction are well known from geophysics, which are based on the different frequency spectrum of the noise and the signal. These techniques have been used to reduce the noise in ice-core records either by stacking several individual records (Reference Fisher, Reeh and ClausenFisher and others, 1985; Reference JohnsenJohnsen and others, 1997; Reference GrafGraf and others, 2002) or by low-pass filtering of the time series.
Another component in the records may be introduced by changing seasonality in the snow cover. In the example of core B31 given above, it is probably the seasonality and not the temperature that displays a strong signal in the 18O record at site DML07. The records of accumulation rates and deuterium excess values from the same site and the isotope records from other sites in DML do not justify any other interpretation.
Processes during the metamorphism of snow to firn and ice may introduce a further component in the record. The phase relationship between the δ2H, δ18O and d profiles is one type of signal in the isotope profiles. Metamorphism changes this signal as Reference Johnsen, Clausen, Cuffey, Hoffmann, Schwander, Creyts and HondohJohnsen and others (2000) pointed out. As diffusion proceeds, the 2H and 18O profiles come in phase with the d profile. The resulting positive correlation can clearly be seen in the 50m section of the EDML record, which has been measured with high depth resolution.
Acknowledgements
We thank A. Olfmann and P. Seibel (GSF) as well as L. Schönicke and H. Manthey (AWI) for doing the isotope measurements. Thanks go to S. Kipfstuhl, F. Fundel and K. Weiler for snow-pit sampling as well as to all members of the field teams. We thank B. Stenni and an unknown reviewer for helpful comments. Financial support by Deutsche Forschungsgemeinschaft (Project Se 491/5-1) is gratefully acknowledged. This work is a contribution to the ‘European Project for Ice Coring in Antarctica’ (EPICA), a joint European Science Foundation (ESF)/European Commission (EC) scientific program, funded by the EC and by national contributions from Belgium, Denmark, France, Germany, Italy, the Netherlands, Norway, Sweden, Switzerland and the United Kingdom. This is EPICA publication No. 77. Data are available under http://www.pangaea.de/PangaVista?query=@Ref2649.



