Implications
The selection of Lusitano horses for functionality has become increasingly important as the breed has been more frequently used in sports, mainly in dressage. Performance traits, namely dressage results, usually present low heritabilities, mainly because of a strong environmental influence. Results of evaluations of movement in hand could possibly be used as less biased genetic predictors of later performance than performance results, as they may be less subject to sources of environmental variation. This work attempted to evaluate genetic parameters and repeatability for objectively measured kinematic traits under field conditions, in order to potentially use them as indicators of precocious gait quality in future selection of this breed.
Introduction
The Lusitano is the most important equine breed in Portugal, with a registered population of about 5000 broodmares and 1000 stallions (Vicente et al., Reference Vicente, Carolino and Gama2012). The official studbook of the Lusitano breed was established in 1967. Since then, the breed has become increasingly popular as a riding horse and relatively successful in various equestrian disciplines, such as carriage driving, working equitation and dressage.
The Lusitano Studbook regulations rely mostly on morphofunctional scores and performance results. Nevertheless, the importance of defining objective criteria that contribute to the improvement of the breed’s performance in equine sports, namely dressage, and including them in a future selection program, has been recognized.
Competition results at advanced levels, especially in dressage, are achieved late in a sport horse’s life (Viklund et al., Reference Viklund, Thorén-Hellsten, Näsholm, Strandberg and Philipsson2008). Early life kinematic evaluation poses the opportunity to extend the information basis for the genetic evaluations of breeding goal traits by (highly) correlated indicator traits like movement in hand, which could efficiently be used as genetic predictors of later performance (Ducro et al., Reference Ducro, Koenen, van Tartwijk and Bovenhuisa2007). Hence, the possibility of using objectively measured kinematic traits as indirect selection criteria for performance could prove to be advantageous, both because it could potentially reduce the influence of environmental effects, and because it could allow a precocious genetic evaluation of the animals. Moreover, the study of highly repeatable data provides a better opportunity to evaluate the effect of the horse and could be used to predict his phenotypical value (Lewczuk and Ducro, Reference Lewczuk and Ducro2012).
Videographic measurement of kinematic traits is an objective method that has been used to evaluate gait quality in horses under experimental and field conditions (Back et al., Reference Back, Barneveld, Bruin, Schamhardt and Hartman1994; Clayton, Reference Clayton1995; Morales et al., Reference Morales, Manchado, Cano, Miró and Galisteo1998). It can also be useful in the definition of gait quality indicators (regularity, range of limb flexion, engaged hindquarters or hock action), which can contribute to early identification of superior gaited horses to be considered in breeding plans (Barrey et al., Reference Barrey, Desliens, Poirel, Biau, Lemaire, Rivero and Langlois2002a). Nevertheless, the estimation of genetic parameters using kinematic traits has only been carried out for data collected under treadmill conditions with low numbers of animals (130 horses; Molina et al., Reference Molina, Valera, Galisteo, Vivo, Gómez, Rodero and Agüera2008; Valera et al., Reference Valera, Galisteo, Molina, Miró, Gómez, Cano and Agüera2008), mainly because the displacement of horses to experimental facilities poses logistic and financial difficulties. If results obtained under field conditions were proven to be equally reliable, this would mean the methodology could potentially be used to systematically obtain records from horses at stud farms or at young horse conformation and performance tests, thus allowing the collection of data suitable to genetic evaluation.
The aim of this work was, first, to perform the estimation of genetic parameters of kinematic variables at trot for Lusitano horses, as means of evaluating their potential use as selection criteria in this breed; and second, to compare the repeatabilities of the measured kinematic traits between three different subpopulations (dressage, bullfighting and untrained), in order to evaluate the horse’s gait ability and regularity of the movements between these groups.
Material and methods
A total of 176 male Lusitano horses, registered in the studbook, were recorded at trot in hand under the same experimental and environmental conditions in different studs in Portugal. Of these, 70 were untrained horses (with an average withers height of 164.6 cm); 76 were dressage horses (average withers height of 163.0 cm); and 30 were horses used in the traditional bullfighting exhibitions in Portugal (average withers height of 164.3 cm). The animals came from 53 stud farms, of which 39.6% trained horses for dressage, 15.1% for bullfighting, 33.9% kept only untrained horses and 11.4% kept both untrained and trained horses. The average age of horses was 7±3.60 years, similar in each group and ranging between 4 and 14 years.
Biokinematic analysis at trot in hand
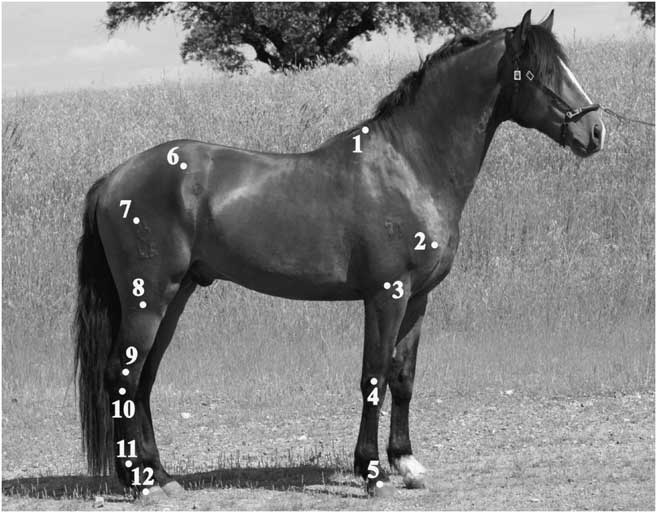
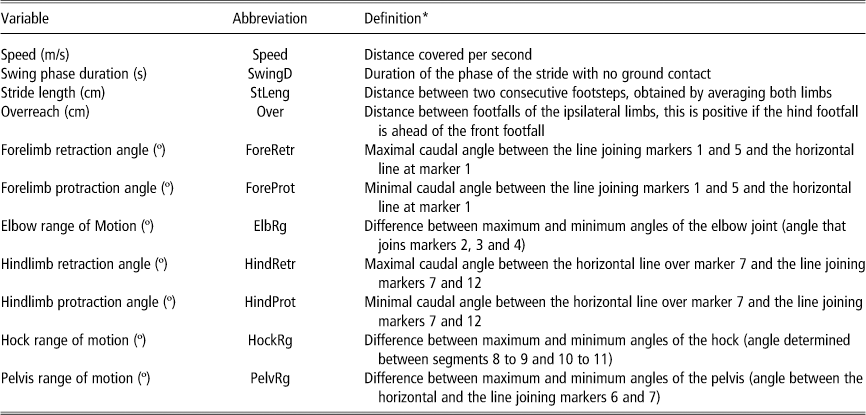
To allow biokinematic measurements, 12 hemispherical markers were applied by the same person over palpable anatomical references on the right side of the horse’s body (Figure 1). All horses were presented by the same experienced handler, who had no previous contact with the horses, in order to minimize error. The animals were video recorded at trot in hand on a sand track 16 m long and 2 m wide after 24 h at rest, using two digital cameras (SONY HCR 23E, Sony Electronics Inc., Park Ridge, New Jersey, USA) placed diagonally to the plane of movement on the right side, according to the methodology described by Miró et al. (Reference Miró, Santos, Garrido-Castro, Galisteo and Medina-Carnicer2009). For each horse, four strides were analyzed. A lighting device was used to synchronize the recording sequences in all the cameras (Degueurce et al., Reference Degueurce, Dietrich, Pourcelot, Denoix and Geiger1996). Kinematic variables were obtained from digitized videos in a 3D semiautomatic analysis system ucoTrackTM (former SOMCAM3D; Garrido-Castro et al., Reference Garrido-Castro, Medina-Carnicer and Galisteo2006), which enabled calculations to be made of three-dimensional coordinates in each frame of the markers on the skin (Galisteo et al., Reference Galisteo, Cano, Morales, Vivo and Miró1998), at a rate of 50 frames/s. In total, the speed and 10 kinematic variables (temporal, linear and angular) were included in this study (Table 1).
Position of the markers placed on the horse for the study of biokinematic variables at hand-led trot. 1, withers, 2, greater tubercle of the humerus (caudal part), 3, lateral collateral ligament of the elbow joint, 4, processus styloideus lateralis radii, 5, coronet of the fore hoof (over the pastern axis), 6, tuber coxae, 7, major trochanter of the femur (caudal part), 8, lateral collateral ligament of the stifle joint, 9, lateral malleolus of the tibia, 10, base of the 4th metatarsal bone, 11, lateral collateral ligament of the hind fetlock joint, 12, coronet of the hind hoof (over the pastern axis).

Description of the biokinematic variables analyzed in Lusitano Purebred horses

* For a more detailed explanation, see Cano et al. (Reference Cano, Miró, Vivo and Galisteo1999).
Genetic and statistic analysis
A preliminary statistical analysis was performed using the ‘Statistica for Windows’ version 8.0 package (StatSoft Inc., 2007). A general linear model was used including speed and age as covariates and the stud and type of training as fixed effects. Least squared means for the kinematic traits were computed using the speed as a continuous variable, for the global data set and separately for the three types of training. Moreover, a Duncan's multiple-range test to mean difference between groups within the types of training was computed.
The phenotypic and genetic parameters (heritabilities, genetic correlations and repeatabilities) of these traits were estimated using the VCE 6, v.6.0 software (Groeneveld et al., Reference Groeneveld, Kovac and Mielenz2008). The following multivariate animal model was used, including all the effects statistically significant in the previous statistical analysis:
 $$\eqalign{y_{{ijklmn}} = \ \mu {\plus}{\mathop{\rm cov}} \left( {L_{i} S} \right){\plus}{\mathop{\rm cov}} \left( {L^{2} _{j} A} \right){\plus}S_{k} {\plus}U_{l} {\plus}P_{m} \cr {\plus}G_{n} {\plus}e_{{ijklmn}} $$
where, y ijklmn is the observed trait; μ the overall mean; L i S the linear covariate speed; L 2 j A the quadratic covariate age; S k the fixed effect of stud; U l the fixed effect of training (dressage, bullfighting or untrained); P m the random permanent environmental animal effect; G n the additive genetic effect; and e ijklmn the random residual effect.
The number of records in the pedigree file was 1540 animals. To complete the pedigree for the calculation of the relationship matrix, all recorded ancestors of the evaluated animals were used, giving an average of equivalently complete generations of 7.32. The average relatedness between the analyzed animals was 0.09 and the inbreeding rate was 0.10.
In order to analyze the repeatability parameter for the horse’s type of training individually, the multivariate animal model (removing the fixed effect of horse’s training) for each group was contrasted with the global model. Standard errors of repeatabilities were calculated as described in Lewczuk and Ducro (Reference Lewczuk and Ducro2012).
Results
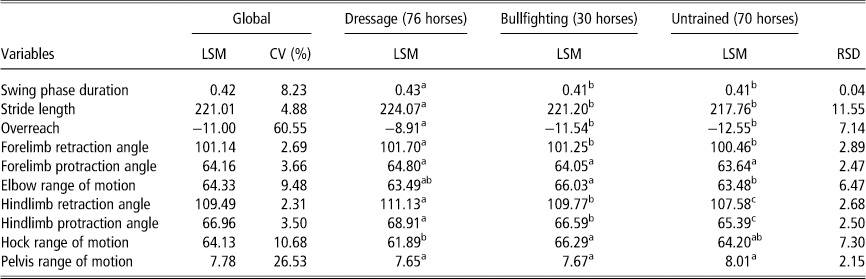
The descriptive statistics (least square means) of the 10 kinematic traits for the global data set and for the three types of training are shown in Table 2. The coefficients of variation (CV) were of medium to high range for 82% of the variables (2.31% to 10.68%). Maximal retraction–protraction angles of forelimb and hindlimb presented the lowest CV (2.69% to 2.31%, respectively). Overreach and pelvis range of motion presented the highest CV (60.55% to 26.53%, respectively). In general, the dressage subpopulation presented major differences regarding kinematic characteristics when compared with the other two subpopulations. Differences between at least two of the three subpopulations were presented for eight of the 10 kinematic traits. Particularly, the hindlimb retraction and protraction angles were statistically different (P⩽0.05) between the three types of training. On the other hand, the forelimb protraction angle and the pelvis range of motion were the traits that showed no statistical differences (P>0.05) among the three subpopulations.
Descriptive statistics (least squares means adjusted for speed, LSM) of 10 biokinematic variables measured in Lusitano Purebred horses at trot in hand for the global data set (n=176) and the three types of training

CV=coefficient of variation; RSD=residual standard deviation.
Differences statistically significant in rows a, b, c for P⩽0.05.
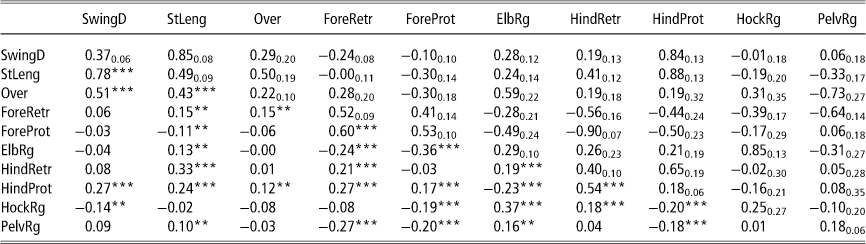
The phenotypic correlations between the kinematics traits are given in Table 3. A proportion of 15.56% moderately positive phenotypic correlations (0.20 to 0.50, P<0.001) were found. Strong positive phenotypical correlations (over 0.50, P<0.001) were found between stride length, overreach and swing duration; between forelimb protraction and retraction angles, and also between hindlimb protraction and retraction angles. Moderately significant negative phenotypical correlations (under −0.20, P<0.001) were found between elbow range of motion, pelvis range of motion and forelimb retraction and protraction angles, between hindlimb protraction angle and elbow range of motion, and also between hock range of motion and hindlimb protraction angle.
Heritabilities (diagonal; standard errors shown as subscripts), genetic correlations (above the diagonal; standard errors shown as subscripts) and phenotypic correlations (below the diagonal) between the 10 kinematic variables analyzed measured in Lusitano Purebred horses

Standard errors for phenotypic correlations were 0.05 to 0.08.
*** Significance at level P<0.001; ** Significance at level P<0.01. For explanation of the abbreviations, see Table 1.
In general, the estimates obtained for the heritabilities and the genetic correlations were moderate to high (Table 3). The heritabilities ranged between 0.18±0.06 (hindlimb protraction angle and pelvis range of motion) and 0.53±0.10 (forelimb protraction angle). The estimated genetic correlations were moderately positive (0.19±0.13 to 0.50±0.19) in 20% of the cases. Positive genetic correlations (>0.8) were found between swing duration, stride length and the hindlimb protraction angle; between swing duration and stride length; and between elbow range of motion and hock range of motion. On the other hand, 22 of the genetic correlations had a negative sign, with the highest value (−0.73±0.27) obtained between overreach and pelvis range of motion.
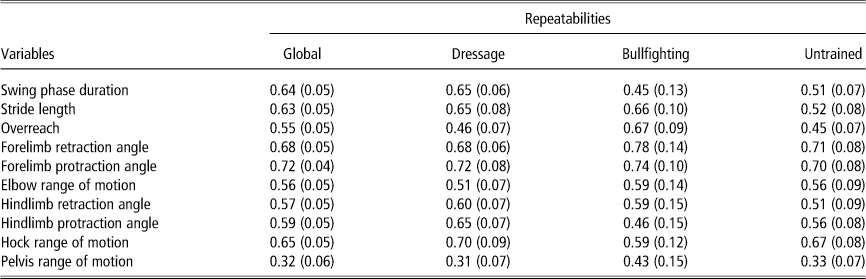
The repeatabilities and standard error estimates for the global model and the three different breeding goals of the 10 kinematic variables analysed are given in Table 4. The repeatabilities ranged between 0.32±0.06 and 0.72±0.04 for the global model. In general, the repeatabilities for dressage and bullfighting (0.31±0.07 to 0.78±0.14) were higher than those of the untrained group. The repeatability values for the untrained subpopulation were comparatively lower than those obtained for the global model. The swing phase duration and the hindlimb protraction angle were the traits which showed the higher differences in the repeatabilities obtained within the three training groups. On the other hand, the forelimb protraction angle and the hindlimb retraction angle repeatabilities were very similar within the three groups.
Mean and s.e. of the repeatability estimates for the global model and the three different types of training, of the 10 kinematic variables analyzed

Discussion
Biomechanical methodologies provide objective and quantitative tools to assess equine locomotion (Roepstoff, Reference Roepstorff2012) and can be applied early in life. In addition, they can be indirectly used to evaluate the conformation pattern, as moderate to high correlations (0.22 to 0.57) have been reported between conformation and trot in hand for young horse test data (Viklund et al., Reference Viklund, Thorén-Hellsten, Näsholm, Strandberg and Philipsson2008), and the simultaneous improvement of limb conformation, quality of the gaits and rideability is feasible (Stock and Distl, Reference Stock and Distl2008). In spite of these reported advantages, results of kinematic evaluation are scarce, probably because of the previously mentioned challenges posed by collection under experimental conditions. Accordingly, this is the first work that deals with the genetic study of the Lusitano horse kinematics, with the study of Miró et al. (Reference Miró, Santos, Garrido-Castro, Galisteo and Medina-Carnicer2009) being the only source of quantitative data on kinematic traits for this breed.
The average speed adopted by Lusitano horses (3.10 m/s) corresponds to that adopted spontaneously by Selle Français horses (Degueurce et al., Reference Degueurce, Pourcelot, Audigie and Denoix1997), as the speed that provides the best conditions of comfort for horses at slow trot in hand (Linford, Reference Linford1994) and that is often used for clinical examination of lameness (Clayton, Reference Clayton1986). However, in other studies, the average speed was closer to 4 m/s (Galisteo et al., Reference Galisteo, Cano, Morales, Vivo and Miró1998; Morales et al., Reference Morales, Manchado, Cano, Miró and Galisteo1998; Cano et al., Reference Cano, Miró, Diz, Agüera and Galisteo2000). The largest sample size of the present study and the fact that data collection was done under field conditions, can help to justify the observed speed range, which varies between 2.00 and the 4.69 m/s. Moreover, the speed influences linear and temporal stride parameters (Galisteo et al., Reference Galisteo, Cano, Morales, Vivo and Miró1998), making it therefore necessary to use least square means adjusted for speed for comparison with other equine breeds.
In general, the variability of the kinematic traits detected in the present work was in the range of that found by other authors (Valera et al., Reference Valera, Galisteo, Molina, Miró, Gómez, Cano and Agüera2008; Baban et al., Reference Baban, Curik, Antunovic, Cacic, Korabi and Mijic2009; Miró et al., Reference Miró, Santos, Garrido-Castro, Galisteo and Medina-Carnicer2009). The majority of the variables obtained relatively low coefficients of variation, which proves results to be quite homogenous, even though the animals came from different studs, as previously reported by Valera et al. (Reference Valera, Galisteo, Molina, Miró, Gómez, Cano and Agüera2008). Training has a direct influence on the horse’s movements, as has been pointed out by Cano et al. (Reference Cano, Miró, Diz, Agüera and Galisteo2000), who described the favorable connection between training and greater flexion in proximal joints of hindlimbs. The group of Lusitano horses studied in the present work was subject to different types of training (dressage, bullfighting and untrained). The lowest coefficient of variation was the one observed for the retraction–protraction angle in both forelimbs and hindlimbs (Table 2), indicating that their values remain homogenous in spite of the different training routines. Accordingly, the retraction–protraction angles are susceptible to be used as early criteria to evaluate gait quality in Lusitano horses, as apparently no major changes have been observed in these traits as a result of training.
Good trotting is synonym of larger swing phase (suspension), amplitude, great flexion of the joints that may impact on expression (i.e. good hock action, Barrey et al., Reference Barrey, Desliens, Poirel, Biau, Lemaire, Rivero and Langlois2002a), among other features. The values obtained in the swing phase duration (0.42 s) were within the range of those found in other breeds of riding horses (0.39 to 0.46 s, Back et al., Reference Back, Barneveld, Bruin, Schamhardt and Hartman1994; Weishaupt et al., Reference Weishaupt, Wiestner, Hogg, Jordan and Auer2004; Valera et al., Reference Valera, Galisteo, Molina, Miró, Gómez, Cano and Agüera2008). It is known that, at trot in hand, the horse’s size does not affect the temporal parameters (Galisteo et al., Reference Galisteo, Cano, Morales, Vivo and Miró1998), which may depend on other horse characteristics such as hindquarter muscular strength. The dressage subpopulation was the group that obtained more significant differences from the other two groups, possibly because of the fact that horses used for dressage are usually chosen for their correct morphofunctional characteristics (Viklund et al., Reference Viklund, Thorén-Hellsten, Näsholm, Strandberg and Philipsson2008), and also revealing an effect of training in kinematic traits. For instance, the value obtained for swing phase duration (0.43 s) was higher in this group than in the other two, emphasizing suspension quality for the dressage horses.
Amplitude is a trait that depends directly on stride length. In this sense, the average stride length value obtained for horses in this study (221.01 cm) was lower than those recorded for the same breed in a previous study (278.24 cm; Miró et al., Reference Miró, Santos, Garrido-Castro, Galisteo and Medina-Carnicer2009) or for other breeds like the Spanish Purebred, the Lipizzaner and Warmblood riding horses (251 to 266 cm, Weishaupt et al., Reference Weishaupt, Wiestner, Hogg, Jordan and Auer2004; Valera et al., Reference Valera, Galisteo, Molina, Miró, Gómez, Cano and Agüera2008; Baban et al., Reference Baban, Curik, Antunovic, Cacic, Korabi and Mijic2009). Even though previous studies (Galisteo et al., Reference Galisteo, Cano, Morales, Vivo and Miró1998) have found a significant correlation between height at withers and linear parameters, namely stride length, in this study the effect of height at withers was statistically non-significant, and no significant differences were found among the height at withers of the three considered subpopulations. Stride length and overtracking distance increase linearly at trot with increasing velocity (Weishaupt et al., Reference Weishaupt, Hogg, Auer and Wiestner2010) and therefore it is possible that these results may be explained by the differences in average speed between this work (3.10 m/s) and the reported studies (3.50 m/s for Weishaupt et al., Reference Weishaupt, Wiestner, Hogg, Jordan and Auer2004; 4.00 m/s for Valera et al., Reference Valera, Galisteo, Molina, Miró, Gómez, Cano and Agüera2008 and 3.67 m/s for Baban et al., Reference Baban, Curik, Antunovic, Cacic, Korabi and Mijic2009).
The value obtained for the overreach in the Lusitano horses (−11.00 cm) was in the range of those found in the Spanish horses (−9 to −21.7 cm; Cano et al., Reference Cano, Miró, Vivo and Galisteo1999, Reference Cano, Miró, Diz, Agüera and Galisteo2000); according to Morales et al. (Reference Morales, Manchado, Cano, Miró and Galisteo1998), negative values are consistent with the definition of working trot at the considered speeds. Cano et al. (Reference Cano, Miró, Diz, Agüera and Galisteo2000) found no significant effects of training over this trait, which moreover stresses the importance of the possibility of improvement of this trait by selection. In the present work, the dressage group again obtained a comparatively better value than the other two groups (−8.91 cm). These results, combined with the high range of variation (60.55%) detected within the animals, point out low levels of selection, mainly in the bullfighting and untrained subpopulations.
The trot characteristics could be used for early dressage selection as they show moderate to high heritabilities (Barrey et al., Reference Barrey, Desliens, Blouin and Langlois2002b). Back et al. (Reference Back, Barneveld, Bruin, Schamhardt and Hartman1994) obtained positive correlations between gait scores and the angular range of motion of most joints. In the present study, the values obtained for the average motion range in the analyzed joints (64° in the elbow or hock, and 7.78° in the pelvis) are compatible with a good trot, but nevertheless are lower than those obtained for Dutch Warmblood horses and Spanish Purebred (Back et al., Reference Back, Schamhardt, Hartman, Bruin and Barneveld1995a; Cano et al., Reference Cano, Vivo, Miró, Morales and Galisteo2001). The phenotypic variability shown by the CV obtained for these traits (between 9.48% and 26.53%) points to the possibility of obtaining high response to selection.
Until now, limited work about the genetic parameters of kinematic variables has been done. The heritability estimates varied between 0.22 and 0.88 for the Spanish Purebred (Molina et al., Reference Molina, Valera, Galisteo, Vivo, Gómez, Rodero and Agüera2008; Valera et al., Reference Valera, Galisteo, Molina, Miró, Gómez, Cano and Agüera2008). The obtained values for the Lusitano horse breed were lower (ranging between 0.18 and 0.53). The fact that those authors obtained their results under highly controlled experimental conditions, on a treadmill, thus reducing environmental sources of variation, can probably account for some of the differences found for heritability estimates in the present work. Nevertheless, the limited number of horses used in both studies could contribute to overestimation of the genetic parameters.
In general, the forelimb retraction and protraction angles (0.52 and 0.53, respectively), the stride length (0.49) and the swing phase duration (0.37) presented high heritabilities, which may indicate the possibility of a high genetic response to selection. The heritabilities for the overreach and the other angular variables ranged between 0.18 and 0.22. These values, though moderate, still remain within the range (0.10 to 0.30) of previously recorded performance trait heritabilities (Ricard et al., Reference Ricard, Bruns and Cunningham2000). On the other hand, 10 of the genetic correlations (both positive and negative) resulted in very high absolute values (>0.50), mainly involving the hindlimbs, which emphasizes the importance of the hindquarters on equine locomotion. The standard errors were quite high for some of the variables, again reflecting the limited number of animals included in the study, because of the complexity of data collection and processing.
Strong phenotypic and genetic correlations were found between the swing phase duration and the stride length (0.78 and 0.85, respectively). Similar results were found by Valera et al. (Reference Valera, Galisteo, Molina, Miró, Gómez, Cano and Agüera2008) with the Spanish Purebred, corroborating that there was a close correlation between stride and swing phase duration, which suggests that the swing phase is the main contributor to the stride-time variations (Drevemo et al., Reference Drevemo, Dalin, Fredricson and Hjerten1980). Moreover, stride length was phenotypically and genetically correlated with overreach (0.43 and 0.5, respectively). Stride length is inversely related to stride frequency, and slow stride frequency (cadence) is consistent with FEI standards for quality of the trot (Barrey, Reference Barrey2004). Therefore, it would be recommended to take stride length into account in the future selection program of the breed, in order to achieve better performance.
The hindlimb movement quality is essential for a successful performance of the horse in most disciplines, as it is both responsible for generating push-off impulse necessary for fence clearing (Van den Bogert et al., Reference Van den Bogert, Janssen and Deuel1994), and for vertical displacement of the trot, necessary for dressage collection, which is obtained through the storage of elastic strain energy in the fetlock, hock, stifle and pelvis (Barrey, Reference Barrey2004). Significant phenotypic correlations between the kinematics of the hindlimbs have been described before (Back et al., Reference Back, Schamhardt, Savelberg, van den Bogert, Bruin, Hartman and Barneveld1995b). The large amount of genetic correlations observed between the analyzed hindlimb traits in Lusitano horses confirms the interdependency of the hindlimb function of an athletic riding horse. If the horse lacks the ability to carry weight on its hindlimbs, the result could be an unbalanced horse, heavy in front and unsuitable to perform at the highest levels (Holmström et al., Reference Holmström, Fredricson and Dreverno1994). Moreover, unfavorable genetic correlations have recently been found between indications of imbalance and dressage-related conformation and performance traits (Becker et al., Reference Becker, Stock and Distl2013). Thus, the results of this work could possibly contribute to a better understanding of which could be the ‘key’ traits to consider and the factors limiting the Lusitano horse’s ability for sport performance (i.e. hindlimb retraction–protraction angles or the hock and pelvis range of motion).
Finally, a comparison between the different types of training (dressage, bullfighting and untrained), in order to analyze the effect of the horse, has been performed. Lewczuk and Ducro (Reference Lewczuk and Ducro2012) reported higher repeatabilities of jumping parameters for the tests with better horses and with longer training, indicating that it is possible to distinguish between good and bad horses depending on repeatabilities of the parameters. In this work, the repeatabilities of kinematic traits obtained were high (over 0.5) for nine of the 10 analyzed variables. Regularity, as well elasticity of the steps and engagement of the hindquarters, are important qualities of the trot (Barrey et al., Reference Barrey, Desliens, Poirel, Biau, Lemaire, Rivero and Langlois2002a). Regularity is also a highly valuated characteristic in dressage tests, according to the International Equestrian Federation rules (FEI, 2013). In this study, we observed that, when compared with the global model, the bullfighting group exhibited higher repeatabilities in 70% of the variables, whereas the dressage group obtained higher values in 50% of the variables. The fact that the regularity and symmetry of strides improve in early phases of training (Barrey, Reference Barrey2004) can probably account for the higher repeatabilities of trained horses (both dressage and bullfighting) when compared with the untrained group.
In conclusion, the variability of kinematic data collected under field conditions in this work was similar to those obtained under experimental conditions by other authors. Field collection of kinematic data should therefore be considered in the future, as way of obtaining data from a higher number of horses in order to perform genetic analysis. The first kinematic study of the trot for the Lusitano horse breed presented positive values in some of the analyzed variables, which are relevant to performance, that is, the swing phase duration or the ranges of motion of the elbow, hock and pelvis joints. Other variables, mainly linear traits, compare poorly with other breed’s quality standards. Nevertheless, characteristics such as stride length and the hindlimbs traits showed stronger genetic correlations than the rest of the biokinematic variables, and their heritabilities were high enough to point to the possibility of using these traits as an efficient tool for the future selection of young horses. Repeatability of most kinematics traits reached higher values in trained horses (dressage and bullfighting) than in untrained ones, showing an influence of training on gait regularity.
Acknowledgments
The authors thank the Associação Portuguesa de Criadores do Cavalo Puro Sangue Lusitano (APSL) for allowing the recording of the animals used in this study.