



1. Introduction
Unlike conventional fixed-wing aircraft, which are susceptible to stall at low Reynolds numbers due to the boundary layer separation under adverse pressure gradients, birds and insects achieve remarkable flight capabilities through flapping wings, demonstrating superior aerodynamic performance (Maxworthy Reference Maxworthy1981; Sane Reference Sane2003; Shyy et al. Reference Shyy, Lian, Tang, Viieru and Liu2008; Pesavento & Wang Reference Pesavento and Wang2009; Liu et al. Reference Liu, Wang and Liu2024). This flapping mechanism proves particularly effective at low to moderate Reynolds numbers,
 $\mathcal{O}(10^2$
–
 $10^4)$
, a regime where conventional fixed-wing aerodynamics becomes inefficient. Consequently, flapping-wing flight has emerged as an attractive solution for micro air vehicles (MAVs) (Ellington Reference Ellington1999; Wilkins & Knowles Reference Wilkins and Knowles2009; Nguyen et al. Reference Nguyen, Au, Phan, Park and Park2021). A deeper understanding of the force generation mechanisms in flapping wings is therefore essential for improving the performance of the MAVs.
Force generation in flapping flight arises from multiple interacting mechanisms: vortex dynamics, wing–wake interaction, wing deformation and kinematic synchronisation (Dickinson et al. Reference Dickinson, Lehmann and Sane1999; Sane Reference Sane2003; Wang Reference Wang2005; Shyy et al. Reference Shyy, Lian, Tang, Viieru and Liu2008; Hedrick et al. Reference Hedrick, Cheng and Deng2009; Chin & Lentink Reference Chin and Lentink2016; Bomphrey et al. Reference Bomphrey, Nakata, Phillips and Walker2017; Huang et al. Reference Huang, Bhat, Yeo, Young, Lai, Tian and Ravi2023). Among these, vortical structures generated by flapping motion serve as the primary mechanism for force production, with circulation concentrated in discrete vortices rather than distributed within the boundary layer (Ford & Babinsky Reference Ford and Babinsky2013). These structures primarily comprise the leading-edge vortex (LEV), tip vortex (TV) and trailing-edge vortex (TEV), which form through shear layer roll-up at the wing edges (Pullin & Wang Reference Pullin and Wang2004). The LEV plays a dominant role in force generation, contributing the majority of lift and thrust during flapping flight (Lee et al. Reference Lee, Choi and Kim2015; Eldredge & Jones Reference Eldredge and Jones2019), and has consequently attracted considerable research attention (Maxworthy Reference Maxworthy1979; Ellington et al. Reference Ellington, van den Berg, Willmott and Thomas1996; Videler et al. Reference Videler, Stamhuis and Povel2004; Muijres et al. Reference Muijres, Johansson, Barfield, Wolf, Spedding and Hedenström2008). Analogous LEV structures appear in the dynamic stall of helicopter blades and pitching aerofoils, where they are termed dynamic stall vortices (McCroskey Reference McCroskey1982; Carr Reference Carr1988; Mulleners & Raffel Reference Mulleners and Raffel2012; Choudhry et al. Reference Choudhry, Leknys, Arjomandi and Kelso2014). The evolution of these vortical structures and overall flight performance are governed by several non-dimensional parameters, including Reynolds number, reduced frequency, Strouhal number and effective angle of attack (Shyy & Liu Reference Shyy and Liu2007; Platzer et al. Reference Platzer, Jones, Young and Lai2008; Shyy et al. Reference Shyy, Aono, Chimakurthi, Trizila, Kang, Cesnik and Liu2010; Young et al. Reference Young, Lai and Platzer2014). Among these, the effective angle of attack has emerged as particularly critical for LEV stability and thrust production (Hover et al. Reference Hover, Haugsdal and Triantafyllou2004; Schouveiler et al. Reference Schouveiler, Hover and Triantafyllou2005; Baik et al. Reference Baik, Bernal, Granlund and Ol2012).
While these aerodynamic mechanisms are fundamental to force generation, they are intrinsically coupled with structural dynamics, creating complex fluid–structure interactions at the intersection of aerodynamics and biomechanics. Both insects and birds exploit wing deformation to enhance flight performance, though through fundamentally different control strategies (Young et al. Reference Young, Walker, Bomphrey, Taylor and Thomas2009; Du & Sun Reference Du and Sun2010; Phan & Park Reference Phan and Park2020). Birds actively modulate wing shape through musculoskeletal control, whereas insects rely predominantly on passive deformation arising from their wings’ inherent flexibility (Wootton Reference Wootton1992; Walker et al. Reference Walker, Thomas and Taylor2009). This passive deformation, driven by aerodynamic loading, plays a crucial role in force generation and flight stability (Wootton Reference Wootton1993; Mountcastle & Combes Reference Mountcastle and Combes2013). Similar passive mechanisms operate in avian flight, where structures such as the alula and covert feathers deform in response to local flow conditions, enhancing aerodynamic performance (Carruthers et al. Reference Carruthers, Thomas and Taylor2007; Walker et al. Reference Walker, Thomas and Taylor2012). Experimental investigations have demonstrated that flapping wings can generate controlled aerodynamic forces through stable leading-edge vorticity, with trailing-edge flexibility serving as a key parameter in force modulation (Zhao et al. Reference Zhao, Huang, Deng and Sane2010). To complement these experimental insights and probe the detailed flow physics, computational fluid dynamics (CFD) has emerged as a promising tool for elucidating these complex fluid–structure interactions. Nakata & Liu (Reference Nakata and Liu2012) developed a comprehensive numerical framework for simulating flexible-wing insect flight, validating their approach through benchmark tests and detailed hawkmoth flight analysis. Subsequent numerical studies have demonstrated that wing flexibility can significantly enhance aerodynamic efficiency across various flapping configurations (Shoele & Zhu Reference Shoele and Zhu2013; Zhu et al. Reference Zhu, He and Zhang2014; Shahzad et al. Reference Shahzad, Tian, Young and Lai2018; Addo-Akoto et al. Reference Addo-Akoto, Han and Han2021).
Active wing twisting has been shown to achieve higher propulsive efficiency compared with passive deformation (Mackenzie Reference Mackenzie2012). Analogous to propeller blades, flapping wings employ spanwise twist from root to tip to modulate the effective angle of attack distribution and prevent stall (McGahan Reference McGahan1973; Norberg Reference Norberg1990). Despite its aerodynamic significance, the underlying mechanisms through which wing twisting enhances flight performance remain incompletely understood. While several studies have examined the effects of active twisting on force generation and vortex dynamics, significant knowledge gaps persist. Thielicke & Stamhuis (Reference Thielicke and Stamhuis2018) investigated force generation through indirect measurements, but left the relationship between twist kinematics and LEV evolution largely unexplored. The distinct aerodynamic roles of the inner and outer wing sections during twisted flapping motion also remain unclear (Thielicke & Stamhuis Reference Thielicke and Stamhuis2015). Recent investigations have provided additional insights, for example, aspect-ratio effects in rolling and twisting aerofoils (Zurman-Nasution et al. Reference Zurman-Nasution, Ganapathisubramani and Weymouth2021), in which the strong spanwise flows in the low aspect-ratio wing could stabilise the LEV, and the role of chordwise deformation in batoid fish propulsion, where asymmetric fin motion optimises thrust through controlled vortex dynamics (Zhang et al. Reference Zhang, Huang, Pan, Yang and Huang2022a ). Nevertheless, the fundamental mechanisms linking twist-induced angle of attack modulation to propulsive performance require further investigation.
An unresolved question in flapping-wing aerodynamics is whether an optimal spanwise distribution of effective angle of attack exists for maximising propulsive performance (Thielicke & Stamhuis Reference Thielicke and Stamhuis2018). While numerous studies suggest that spanwise twisting enables birds to achieve superior aerodynamic efficiency through favourable effective angle of attack distributions (Thomas & Hedenström Reference Thomas and Hedenström1998; Alexander Reference Alexander2002; Hubel Reference Hubel2007; Azuma Reference Azuma2012), the underlying flow physics remain unexplored (Usherwood & Ellington Reference Usherwood and Ellington2002). This study addresses these knowledge gaps through systematic investigation of how spanwise twist affects aerodynamic performance in flapping flight. Specifically, we examine the relationship between twist kinematics and propulsive force generation, efficiency and LEV dynamics. Our objectives are threefold: first, to identify optimal effective angle of attack distributions and quantify their impact on propulsive efficiency; second, to elucidate the physical mechanisms through which twist modulation enhances performance via altered LEV evolution; and third, to characterise the distinct aerodynamic roles of the inner and outer wing sections during twisted flapping motion. The findings of the present study have potential implications for the design of flapping-wing micro air vehicles, where spanwise modulation of the effective angle of attack could be exploited to enhance aerodynamic performance (Zhang et al. Reference Zhang, Zhao and Qu2022b ; Rafee Nekoo et al. Reference Rafee Nekoo, Rashad, De Wagter, Fuller, Croon, Stramigioli and Ollero2025; Wu et al. Reference Wu, Cheng, Zhang, Tang, Zhou, Cao and Chen2026).
The remainder of this paper is organised as follows. Section 2 introduces the physical model and numerical methods. Results and their discussion are presented in § 3 and conclusions are drawn in § 4.
2. Physical model and methodologies
2.1. Physical model and governing equations
A rectangular flat-plate wing making a flapping motion about the
 $x$
axis and a twisting motion from the root to the tip about the
 $z$
axis.

A thin rectangular flat-plate wing is flapping down about the
 $x$
axis and twisting about the
 $z$
axis, as shown in figure 1, where the translucent areas represent the wings at earlier times during the flapping down period. The global axis orientation is
 $XYZ$
, while the moving reference frame attached to the leading edge is
 $xyz$
in red. Here,
 $U_\infty$
denotes the constant freestream velocity,
 $c$
is the wing chord length and
 $b$
is the spanwise length. The practical bird wing is simplified to a thin, rectangular, flat-plate wing in simulations as the wing thickness and the leading-edge geometry have been shown to have limited effects on the aerodynamic performance and the LEV dynamics for flapping wings (Rival et al. Reference Rival, Kriegseis, Schaub, Widmann and Tropea2014; Thielicke & Stamhuis Reference Thielicke and Stamhuis2015). In this work,
 $c$
and
 $b$
are set to be 1 and 3, respectively, leading to the aspect ratio (AR) of 3, which is within the range of the AR of small birds (Tobalske & Dial Reference Tobalske and Dial1996; Azuma Reference Azuma2012). Although varying the wing AR leads to distinct aerodynamic performance and vortex dynamics (Harbig et al. Reference Harbig, Sheridan and Thompson2013; Fu et al. Reference Fu, Hefler, Qiu and Shyy2014; Han et al. Reference Han, Chang and Cho2015; Phillips et al. Reference Phillips, Knowles and Bomphrey2015), a qualitatively similar vortex system development has been observed across the range
 $1 \leqslant \textit{AR} \leqslant 4$
for rotating wings (Garmann & Visbal Reference Garmann and Visbal2014). Furthermore, most natural flyers possess low-aspect-ratio wings, which has been attributed to two key mechanisms: the avoidance of LEV burst (Fu et al. Reference Fu, Hefler, Qiu and Shyy2014) and the constraint imposed by the chord length on the LEV circulation growth (Garmann & Visbal Reference Garmann and Visbal2014). In light of these considerations, an aspect ratio of
 $\textit{AR} = 3$
is adopted in the present study, striking a balance between physical relevance and the need to maintain a tractable parameter space and manageable computational cost.
The flapping kinematics is defined by the flapping angle about the
 $x$
axis
 $\phi (t)$
, the prescribed effective angle of attack
 $\alpha _{\textit{eff}}(t,z)$
and the twisting motion about the
 $z$
axis (the leading edge) from the wing root to the wing tip is defined by
 $\varTheta (t,z)$
. Here,
 $\phi (t)$
is defined first as
 \begin{equation} \phi (t) = \phi _0 \cos (2 \pi \textit{ft}), \end{equation}
where
 $\phi _0$
is the amplitude of the flapping angle,
 $f$
is the flapping frequency. The
 $\phi _0$
is set to be 0.559 (
 $32^{\circ }$
) according to the flapping angle of small birds during cruise (Rosén et al. Reference Rosén, Spedding and Hedenstroöm2004). Additionally,
 $f$
varies according to the Strouhal number,
 $\textit{St}_{A} = f (2\phi _0 b) \big / U_{\infty }$
from 0.4 to 1.0 with an increment of 0.1, in which
 $(2\phi _0b)$
is the arc length of the wing tip trajectory caused by
 $\phi (t)$
. It should be noted that
 $\textit{St}_A$
in this work is evaluated based on the flapping amplitude of the wing tip. However, if re-evaluated using the displacement of the wing mid-section (i.e. the average displacement from root to tip), the
 $\textit{St}_A$
range would cover that observed in birds during efficient cruising flight (Taylor et al. Reference Taylor, Nudds and Thomas2003), 0.2–0.4. Taylor et al. (Reference Taylor, Nudds and Thomas2003) modelled the wing as undergoing purely heaving motion, rather than flapping about an axis.
The effective angle of attack induced by the flapping motion
 $\phi (t)$
at each wing section can be calculated as
 \begin{equation} \alpha _{\textit{eff},\phi }(t,z) = \arctan [\dot \phi (t) (z - z_{\textit{root}})/U_\infty ], \end{equation}
where
 $z_{\textit{root}}$
is the coordinate of the base of the flapping wing and
 $z \geqslant z_{\textit{root}}$
. For a bird, the range of the maximum effective angle of attack at the wing tip,
 $\alpha _{\textit{eff,max}}$
, is from
 $9^{\circ }$
to
 $54^{\circ }$
according to the previous studies and observations on birds (McGahan Reference McGahan1973; Pennycuick Reference Pennycuick1989; Thomas & Hedenström Reference Thomas and Hedenström1998; Usherwood & Ellington Reference Usherwood and Ellington2002; Azuma Reference Azuma2012). Therefore, the effective angle of attack at each wing section,
 $\alpha _{\textit{eff}}(t,z)$
, is prescribed by the following equation in the simulations:
 \begin{equation} \alpha _{\textit{eff}}(t,z) = \alpha _{\textit{eff,max}}(z-z_{\textit{root}}) \cos (2 \pi \textit{ft} - \pi / 2 + \varPhi )/ b, \end{equation}
on which the linear variation along the spanwise direction is assumed. Here,
 $\varPhi$
is the phase difference between
 $\alpha _{\textit{eff}}(t,z)$
and
 $\phi (t)$
. For this flapping wing, the effective angle of attack is the result of the flapping motion
 $\phi (t)$
and the twisting motion
 $\varTheta (t,z)$
. The twisting motion is equivalent to a pitching down (up) motion for each spanwise wing section during the flapping down (up) period. Thus, the twisting angle can be evaluated by the following equation:
 \begin{equation} \varTheta (t,z) = \alpha _{\textit{eff},\phi }(t,z) - \alpha _{\textit{eff}}(t,z). \end{equation}
Time histories of
 $\alpha _{\textit{eff}}$
at spanwise locations
 $z/b=0.3$
, 0.5 and 1.0 during a complete flapping cycle at
 $\textit{St}_A=0.6$
,
 $\alpha _{\textit{eff,max}}=27^{\circ }$
and
 $\varPhi = 0^{\circ }$
. Solid lines, dash lines and dotted lines represent
 $\alpha _{\textit{eff}}$
induced by the flapping motion, the prescribed
 $\alpha _{\textit{eff}}$
and
 $\alpha _{\textit{eff}}$
due to the twisting motion, respectively.

To demonstrate the variation in the effective angle of attack along the wing span, the time histories of
 $\alpha _{\textit{eff}}$
at three spanwise locations are shown in figure 2. It can be seen that the twisting motion is superposed onto the flapping motion to maintain
 $\alpha _{\textit{eff}}$
in a reasonable range in a flapping cycle.
The flow dynamics is governed by the incompressible Navier–Stokes equations due to the small Mach number of birds and MAV applications:
 \begin{equation} \boldsymbol{\nabla } \boldsymbol{\cdot }\boldsymbol{u} = 0 , \end{equation}
 \begin{equation} \frac {\partial \boldsymbol{u}}{\partial t} + \boldsymbol{ u} \boldsymbol{\cdot }\boldsymbol{\nabla } \boldsymbol{ u} = -\boldsymbol{\nabla}\! p + \frac {1}{\textit{Re}}{\nabla} ^2 \boldsymbol{u}+ \boldsymbol{f}, \end{equation}
where
 $\boldsymbol{u}$
is the dimensionless velocity,
 $p$
is the dimensionless pressure,
 $\boldsymbol{f}$
is the dimensionless body force density and
 $\textit{Re}$
is the Reynolds number defined as
 $\textit{Re} = U_\infty c / \nu$
with
 $\nu$
being the kinematic viscosity.
2.2. Numerical methods
To solve the flow dynamics, we employ the lattice Boltzmann method (LBM) coupled with a feedback immersed boundary method (IBM) because of its high computational efficiency and straightforward implementation (Chen & Doolen Reference Chen and Doolen1998; Aidun & Clausen Reference Aidun and Clausen2010; Krüger et al. Reference Krüger, Kusumaatmaja, Kuzmin, Shardt, Silva and Viggen2017). The LBM solves the discrete lattice Boltzmann equation with the D3Q19 lattice model (three-dimensional model with 19 discrete velocity directions),
 \begin{equation} f_i( \boldsymbol{x}+\boldsymbol{e}_i \Delta t,t+\Delta t) - f_i( \boldsymbol{x},t) = \varOmega _i + \Delta t G_i. \end{equation}
The evolution of the particle distribution function,
 $f_i(\boldsymbol{x},t)$
, with the discrete lattice velocity vector,
 $\boldsymbol{e_{i}}$
, is determined by the collision function,
 $\varOmega _i$
, and the external source term,
 $G_i$
, due to the external body force from the immersed boundary object. The fluid density, pressure and velocity can respectively be evaluated from the moments of
 $f_i$
according to the following equations:
 \begin{eqnarray} \rho =\sum _{i}f_i,\quad p=\rho c_s^2 \quad \mathrm{and} \quad \boldsymbol{u}=\left (\sum _{i}\boldsymbol{e}_i f_i+\frac {1}{2}\boldsymbol{f}\Delta t\right ) \Bigg /\rho , \end{eqnarray}
where
 $c_s = \Delta x / (\Delta t \sqrt {3})$
is the ideal sound speed in the LBM model. Here,
 $\varOmega _i$
and
 $G_i$
are the recursive regularised collision model (Coreixas et al. Reference Coreixas, Wissocq, Puigt, Boussuge and Sagaut2017) and the source scheme proposed by Guo et al. (Reference Guo, Zheng and Shi2002), respectively:
 \begin{align} & \hspace{-4.5pc} \varOmega _i(\boldsymbol{x},t) = \frac {1}{\tau }f_i^{(1)}, \end{align}
 \begin{align} & \hspace{4.5pc}\, G_i= \left(1-\frac {1}{2\tau } \right)\omega _i \left(\frac {\boldsymbol{e}_i-\boldsymbol{u}}{c_s^2} + \frac {\boldsymbol{e}_i \boldsymbol{\cdot }\boldsymbol{u}}{c_s^4}\boldsymbol{e}_i \right) \boldsymbol{\cdot }\boldsymbol{f}, \end{align}
where
 $\tau$
is the dimensionless relaxation time defined as
 $\tau = \nu / (c_s^2 \Delta t) + 1/2$
,
 $f_i^{(1)}$
is the non-equilibrium part of the particle distribution function
 $f_i$
from the recursive regularised procedure (Latt & Chopard Reference Latt and Chopard2006; Coreixas et al. Reference Coreixas, Wissocq, Puigt, Boussuge and Sagaut2017) and
 $\omega _i$
is the weighted coefficient of the D3Q19 model. To avoid duplication and verbosity, the formulation of equilibrium (
 $f_i^{(eq)}$
) and non-equilibrium (
 $f^{(1)}_i$
) distribution components in the recursive regularised scheme follows the paper of Coreixas et al. (Reference Coreixas, Wissocq, Puigt, Boussuge and Sagaut2017).
For the wing boundary conditions, we adopt a feedback IBM, which offers straightforward treatment of moving complex geometrical configurations (Goldstein et al. Reference Goldstein, Handler and Sirovich1993; Peskin Reference Peskin2002; Mittal & Iaccarino Reference Mittal and Iaccarino2005; Huang & Tian Reference Huang and Tian2019; Griffith & Patankar Reference Griffith and Patankar2020). Specifically, a body force is applied near the wing to achieve the no-slip boundary condition:
 \begin{equation} \boldsymbol{f} = -\int \boldsymbol{F}(\boldsymbol{s},t)\delta ( \boldsymbol{x}-\boldsymbol{X}(\boldsymbol{s},t))\,{\rm d}A, \end{equation}
where
 $\boldsymbol{s}$
denotes the curvilinear coordinates attached to the structure element,
 $\boldsymbol{X}(\boldsymbol{s},t)$
represents its position at time
 $t$
and
 $\boldsymbol{F}(\boldsymbol{s},t)$
is the Lagrangian force acting on the structure. The terms
 ${\rm d}A$
and
 $\delta$
denote the surface area element and the Dirac delta function, respectively. Here,
 $\boldsymbol{F}(\boldsymbol{s},t)$
is evaluated by the feedback scheme:
 \begin{equation} \,\,\,\,\boldsymbol{F} = \beta (\boldsymbol{U}_{ib} (\boldsymbol{s},t) - \boldsymbol{U}(\boldsymbol{s},t)), \end{equation}
 \begin{equation} \boldsymbol{U}_{ib}(\boldsymbol{s},t) = \int \boldsymbol{u}(\boldsymbol{x},t) \delta ( \boldsymbol{x}-\boldsymbol{X}(\boldsymbol{s},t))\,{\rm d}\boldsymbol{x}, \end{equation}
where
 $\boldsymbol{U}_{ib}(\boldsymbol{s},t)$
and
 $\boldsymbol{U}(\boldsymbol{s},t)$
denote the fluid velocity interpolated onto the structure element from the surrounding fluid and the actual velocity of the structure element, respectively, while
 $\beta$
is the feedback coefficient. Following Huang et al. (Reference Huang, Liu, Wang, Ravi, Young, Lai and Tian2022), the feedback coefficient is set to
 $\beta = 2.6$
in LBM units. The Dirac delta function
 $\delta (\boldsymbol{x})$
is approximated by the smoothed delta function
 $\delta _h(\boldsymbol{x})$
proposed by Peskin (Reference Peskin2002):
 \begin{equation} \delta _h(\boldsymbol{ x})=\frac {1}{\Delta x \Delta y \Delta z} \phi _r \Bigl (\frac {x}{\Delta x} \Bigr ) \phi _r \Bigl (\frac {y}{\Delta y} \Bigr ) \phi _r \Bigl (\frac {z}{\Delta z} \Bigr ), \end{equation}
 \begin{equation} \phi _r(\textit{r})=\left \{ \begin{aligned} &\frac {1}{8}\left (3-2|r|+\sqrt {1+4|r|-4r^2}\right )\!, & 0\leqslant |r|\lt 1, \\[7pt] &\frac {1}{8}\left (5-2|r|-\sqrt {-7+12|r|-4r^2}\right )\!, & 1 \leqslant |r|\lt 2, \\[7pt] & 0 ,& |r|\geqslant 2. \end{aligned} \right . \end{equation}
The implementation and validation of the immersed boundary-lattice Boltzmann method solver have been thoroughly documented in our previous work works (Jin et al. Reference Jin, Wang, Ravi, Young, Lai and Tian2024, Reference Jin, Ji, Ravi, Young, Pereira and Tian2025; Wang et al. Reference Wang, Liu, Jin, Huang, Young and Tian2024).
2.3. Simulation set-up
A top-port view of the finest three mesh blocks.

As shown in figure 3, a multi-block mesh is employed to improve the computational efficiency and accuracy, where the finer mesh is applied near the wing to resolve the small scales and the coarse blocks with a coarsening ratio of 2 are applied away from the wing to reduce the computational expense. The computational domain spans from
 $(-15c, -15c, -15c)$
to
 $(30c, 15c, 15c)$
in the
 $X$
,
 $Y$
and
 $Z$
directions. The velocity boundary condition,
 $\boldsymbol{u} = (U_\infty , 0, 0)$
, and the zero gradient pressure boundary condition,
 $\boldsymbol{\nabla }\! p = 0$
, are applied on the boundaries of the domain except for the outlet surface (
 $X=30c$
), on which the zero gradient velocity boundary condition and the constant pressure boundary condition are applied. The absorbing layers are applied on the lattices near the boundaries of the domain to reduce the effects of the reflecting acoustic waves (Xu & Sagaut Reference Xu and Sagaut2013). The simulations are run for five flapping cycles to achieve a steady state and results in the fifth flapping cycle are used to conduct analysis.
To measure the flying performance of the flapping wing, the thrust, lift, side force, resultant force magnitude and power consumption coefficients are defined as follows:
 \begin{align} &C_{\!T} = \frac {-F_x}{ 1/2 \rho _0 A U_\infty ^2},\quad \ C_L = \frac {F_y}{ 1/2 \rho _0 A U_\infty ^2}, \quad C_{\!Z} = \frac {F_z}{ 1/2 \rho _0 A U_\infty ^2},\quad {C_{\!F} = \frac {|\boldsymbol{F}|}{ 1/2 \rho _0 A U_\infty ^2}}, \nonumber\\[3pt] &C_{\!P} = \frac {\int \boldsymbol{F} \boldsymbol{\cdot }\boldsymbol{U} \,{\rm d}\boldsymbol{A}}{ 1/2 \rho _0 A U_\infty ^3}, \end{align}
where
 $F_x$
,
 $F_y$
and
 $F_z$
are the force components on the flapping wing in the
 $+X$
,
 $+Y$
and
 $+Z$
directions, respectively. Here,
 $A$
is the integration of
 ${\rm d}A$
over the structural triangle elements. The wing area change due to the twisting is presented in Appendix A.2 to demonstrate that the change of the wing area is very small.
The propulsive efficiency is defined as follows:
 \begin{equation} \eta = \frac { \overline {C_{\!T}} U_\infty }{\overline {C_{\!P}}}. \end{equation}
To ensure the convergence of the simulation results, the mesh-dependence studies are conducted at
 $\textit{Re}$
= 4500, as shown in Appendix A.3. At
 $\textit{Re}$
= 4500, the Vreman sub-grid stress model (Vreman Reference Vreman2004) is adopted in the large eddy simulation due to its satisfactory balance in efficiency and accuracy. The effects of
 $\textit{Re}$
are documented in Appendix A.1 by simulations at
 $\textit{Re}$
= 500 and 4500. It is found that the effects of
 $\textit{Re}$
are limited, which are consistent with the previous work on flapping wings (Anderson et al. Reference Anderson, Streitlien, Barrett and Triantafyllou1998; Bozkurttas et al. Reference Bozkurttas, Mittal, Dong, Lauder and Madden2009; Zhang et al. Reference Zhang, Pan, Chao and Zhang2018). Therefore, the results and discussions are conducted according to the simulations at
 $\textit{Re}$
= 1500.
3. Results and discussions
The effects of
 $\textit{St}_{A}$
and
 $\alpha _{\textit{eff,max}}$
are investigated first to identify the most efficient combination of
 $\textit{St}_{A}$
and
 $\alpha _{\textit{eff,max}}$
by fixing
 $\varPhi = 0^{\circ }$
. Then, the effects of
 $\varPhi$
are investigated by varying it from
 $-40^{\circ }$
to
 $40^{\circ }$
with an increment of
 $10^{\circ }$
.
3.1.
Optimal
 $\alpha _{\textit{eff}}$
and
$\textit{St}_A$


Cycle-average aerodynamic performance coefficients at
 $\textit{Re}$
= 1500: (a) thrust coefficient; (b) side force coefficient; (c) resultant force magnitude coefficient and (d) power consumption coefficients.

The cycle-averaged force production is first analysed to reveal the effects of
 $\textit{St}_A$
and
 $\alpha _{\textit{eff,max}}$
on force generation. Figure 4 presents the cycle-averaged force coefficients as functions of these parameters. As expected, all force coefficients and mechanical power consumption increase monotonically with
 $\textit{St}_A$
, which is attributable to the higher flapping frequency. In contrast, the response to variations in
 $\alpha _{\textit{eff,max}}$
is more complex and reveals several important aerodynamic characteristics. First, the cycle-averaged thrust coefficient
 $\overline {C_{\!T}}$
(figure 4
a) exhibits qualitatively different behaviours depending on
 $\textit{St}_A$
. At low Strouhal numbers (
 $\textit{St}_A \leqslant 0.6$
),
 $\overline {C_{\!T}}$
initially increases with
 $\alpha _{\textit{eff,max}}$
before declining at higher angles, indicating an optimal effective angle of attack for thrust generation. Conversely, at high Strouhal numbers (
 $\textit{St}_A \gt 0.6$
), thrust increases monotonically with
 $\alpha _{\textit{eff,max}}$
. This suggests that excessive effective angles of attack are detrimental to thrust generation in the low-to-medium
 $\textit{St}_A$
regime – characteristic of typical avian cruising flight. Consequently, maintaining an appropriate spanwise distribution of effective angle of attack is crucial for optimal flight performance. Second, the cycle-averaged side force coefficient
 $\overline {C_{\!Z}}$
(figure 4
b) decreases monotonically with increasing
 $\alpha _{\textit{eff,max}}$
, exhibiting a trend opposite to that of
 $\overline {C_{\!T}}$
at high
 $\textit{St}_A$
. This inverse relationship suggests a trade-off between thrust and side force generation as the effective angle of attack is modulated through wing twist. Third, the cycle-averaged resultant force magnitude coefficient
 $\overline {C_{\!F}}$
(figure 4
c) remains relatively insensitive to
 $\alpha _{\textit{eff,max}}$
across all Strouhal numbers examined, suggesting that the magnitude of the total aerodynamic force is governed primarily by
 $\textit{St}_A$
rather than by twist kinematics. Finally, the cycle-averaged power consumption coefficient
 $\overline {C_{\!P}}$
(figure 4
d) increases with
 $\alpha _{\textit{eff,max}}$
for all cases. Notably, this increase is approximately linear for intermediate Strouhal numbers (
 $\textit{St}_A = 0.4$
–
 $0.6$
), while higher
 $\textit{St}_A$
cases exhibit accelerated power consumption at large
 $\alpha _{\textit{eff,max}}$
. Moreover, combining observations from figures 4(a) and 4(d) reveals an optimal
 $\alpha _{\textit{eff,max}}$
for propulsive efficiency. Notably, thrust exhibits a sub-linear scaling with
 $\alpha _{\textit{eff,max}}$
(power-law exponent
 ${\lt } 1$
), whereas power consumption scales super-linearly (power-law exponent
 ${\gt } 1$
). This disparity in scaling behaviours implies that propulsive efficiency necessarily reaches a maximum at moderate
 $\alpha _{\textit{eff,max}}$
, beyond which the rapidly increasing power penalty outweighs the diminishing thrust gains.
Average (a) thrust and (b) side force coefficients normalised by the average resultant force magnitude coefficient at
 $\textit{Re}$
= 1500. (c) Magnitude (radius) and the direction (azimuth angle) of the cycle-averaged resultant force magnitude coefficient at
 $\textit{Re}$
= 1500. The
 $X$
direction is along the
 $90^\circ$
direction and the
 $Z$
direction is along the
 $0^\circ$
direction. The increase direction of
 $\alpha _{\textit{eff,max}}$
is indicated by the arrow.

As demonstrated in figure 4, the effect of
 $\textit{St}_A$
is straightforward: larger
 $\textit{St}_A$
yields greater force coefficients and mechanical power consumption. The effect of
 $\alpha _{\textit{eff,max}}$
– which reflects the influence of spanwise twisting – is now examined in detail. Figure 5 presents the cycle-averaged thrust and side force coefficients normalised by the resultant force magnitude coefficient. Remarkably, all curves collapse onto a single trend, except for
 $\textit{St}_A=0.4$
, which exhibits relatively larger deviations at low and high
 $\alpha _{\textit{eff,max}}$
. This collapse reveals that spanwise twisting primarily reallocates force production between the streamwise and spanwise directions rather than altering the total force magnitude. At low
 $\alpha _{\textit{eff,max}}$
(corresponding to significant spanwise twisting), force production is predominantly oriented in the spanwise direction. Conversely, at high
 $\alpha _{\textit{eff,max}}$
(corresponding to minor spanwise twisting), force production shifts predominantly to the streamwise direction, thereby generating thrust.
The magnitude and direction of the resultant force magnitude coefficient are shown in figure 5(c), where
 $0^{\circ }$
corresponds to the
 $+Z$
direction and
 $90^{\circ }$
corresponds to the streamwise direction,
 $+X$
. Two important observations emerge from this analysis. First, the force direction is primarily governed by
 $\alpha _{\textit{eff,max}}$
. As
 $\alpha _{\textit{eff,max}}$
increases (less twist), the resultant force vector rotates from
 $+Z$
to the streamwise direction. This behaviour elucidates the underlying mechanism of force reallocation observed in figures 5(a) and 5(b). Second, at low flapping frequencies, stall occurs when
 $\alpha _{\textit{eff,max}}$
becomes excessively large, as evidenced by the rapid decrease in
 $\overline {C_{\!F}}$
. While stall on stationary wings is well documented when the angle of attack exceeds a critical value, the present results demonstrate that stall can also occur on flapping wings when the spanwise distribution of
 $\alpha _{\textit{eff}}$
is inappropriate. This finding underscores the importance of proper spanwise twisting in both preventing stall and maintaining efficient force production.
Contour of the propulsive efficiency,
 $\eta$
, on the
 $\textit{St}_{A}{-}\alpha _{\textit{eff,max}}$
plane at
 $\textit{Re}$
= 1500.

Figure 6 shows the propulsive efficiency in the
 $\textit{St}_A$
–
 $\alpha _{\textit{eff,max}}$
parameter space. A maximum efficiency of
 $\eta = 0.36$
is attained at
 $\textit{St}_A = 0.6$
and
 $\alpha _{\textit{eff,max}} = 27^{\circ }$
. This optimal condition exhibits two noteworthy characteristics. First, the Strouhal number based on mid-span amplitude (rather than wing-tip amplitude) is
 $\textit{St}_A = 0.3$
, consistent with the range observed for efficient avian cruise (Taylor et al. Reference Taylor, Nudds and Thomas2003). Second, the spanwise-averaged effective angle of attack is
 $\alpha _{\textit{eff}} = 13.5^{\circ }$
, which closely matches the optimal value of
 $15^{\circ }$
reported for two-dimensional heaving and pitching aerofoils (Schouveiler et al. Reference Schouveiler, Hover and Triantafyllou2005).
3.2. Analysis on the instantaneous flow field
Instantaneous (a) lift, (b) thrust and (c) side force coefficients normalised by the resultant force magnitude coefficient at
 $\textit{St}_A$
= 0.6 and
 $\textit{Re}$
= 1500.

The preceding analysis has established that
 $\textit{St}_A$
primarily governs the magnitude of force production, while spanwise twisting redistributes this force between the streamwise and spanwise directions. This section examines the instantaneous force production and associated vortex dynamics at the optimal efficiency condition of
 $\textit{St}_A = 0.6$
. Figure 7 presents the time histories of the instantaneous lift, thrust and side force coefficients normalised by the magnitude of the resultant force coefficient, which are defined in (2.13) of § 2.3. Three key features emerge from this analysis. First, owing to the flapping motion being symmetric about the
 $XZ$
plane, the net lift production is zero over a complete cycle (figure 7
a). However, spanwise twisting influences the instantaneous lift generation: as the twisting magnitude increases (
 $\alpha _{\textit{eff,max}}$
decreases), the lift production phase is delayed within the flapping cycle. Second, the normalised thrust coefficient
 $C_{\!T}/C_{\!F}$
(figure 7
b) exhibits two trends with increasing spanwise twisting: the magnitude of
 $C_{\!T}/C_{\!F}$
increases, while the duration of thrust production decreases. Third, the normalised side force coefficient
 $C_{\!Z}/C_{\!F}$
(figure 7
c) shows that increasing spanwise twisting reduces side force production in the
 $-Z$
direction and delays the timing at which
 $C_{\!Z}$
reaches its negative peak.
The three-dimensional (3-D) vortical structures identified by Q = 50 coloured by the pressure coefficient at
 $\textit{St}_{A}$
= 0.6 and
 $\alpha _{\textit{eff,max}}$
=
 $9^{\circ }$
,
 $27^{\circ }$
,
 $45^{\circ }$
in the fifth flapping cycle.

The influence of spanwise twisting on vortex structures is now examined. Figure 8 presents three-dimensional flow structures visualised using iso-surfaces of the Q-criterion (Jeong & Hussain Reference Jeong and Hussain1995) and coloured by the pressure coefficient,
 $C_p=(p-p_\infty )/(1/2\rho U^2_{\infty })$
, at
 $\textit{St}_A = 0.6$
for
 $\alpha _{\textit{eff,max}} = 9^{\circ }$
,
 $27^{\circ }$
and
 $45^{\circ }$
. These configurations correspond to the conditions yielding maximum side force, maximum propulsive efficiency and maximum thrust, respectively, at
 $\textit{St}_A=0.6$
. At the beginning of the downstroke (
 $t/T = 4.125$
), the shear layer rolls up into a leading-edge vortex (LEV) at the outer wing region for all cases, driven by flow separation at the sharp leading edge. For
 $\alpha _{\textit{eff,max}} = 9^{\circ }$
, LEV formation is less pronounced compared with higher
 $\alpha _{\textit{eff,max}}$
cases; the LEV does not appear to pinch off from its downstream boundary layer due to the small effective angle of attack (Akkala & Buchholz Reference Akkala and Buchholz2017). In contrast, a tip vortex (TV) is evident for
 $\alpha _{\textit{eff,max}} = 27^{\circ }$
and
 $45^{\circ }$
at this instant. At
 $\alpha _{\textit{eff,max}} = 45^{\circ }$
, the pressure within both the LEV and TV is substantially lower than at smaller
 $\alpha _{\textit{eff,max}}$
, indicating stronger circulation. By
 $t/T = 4.250$
, a low-pressure LEV tube (refer to feature (a)) oriented in the spanwise direction (
 $+z$
) develops for
 $\alpha _{\textit{eff,max}} = 27^{\circ }$
and
 $45^{\circ }$
, with the LEV also tilting in the streamwise direction (
 $+x$
). For
 $\alpha _{\textit{eff,max}} = 9^{\circ }$
, the LEV remains weak and its core pressure is considerably higher than in the other two cases, resulting in substantially reduced thrust production. Notably, vortex breakdown occurs at the outer wing region (approximately
 $z/b = 0.7$
) for
 $\alpha _{\textit{eff,max}} = 27^{\circ }$
and
 $45^{\circ }$
, where the LEV cross-sectional area increases abruptly – a phenomenon similar to that observed on rotating wings (Medina & Jones Reference Medina and Jones2016). Following breakdown, the LEV core can no longer sustain low pressure. At
 $\alpha _{\textit{eff,max}} = 45^{\circ }$
, additional small-scale structures emerge around the TV owing to the higher local Reynolds number of the shear layer feeding these vortical structures. At
 $t/T=4.375$
, the LEV over the outer wing region loses coherence and detaches from the surface for
 $\alpha _{\textit{eff,max}} = 27^{\circ }$
and
 $45^{\circ }$
. However, the low-pressure LEV tube over the mid-span region remains attached, indicating that the LEV from root to mid-span continues to generate suction force. Finally, at the end of the downstroke (
 $t/T=4.500$
), the LEV fully detaches from the wing surface due to wing rotation at the onset of the upstroke.
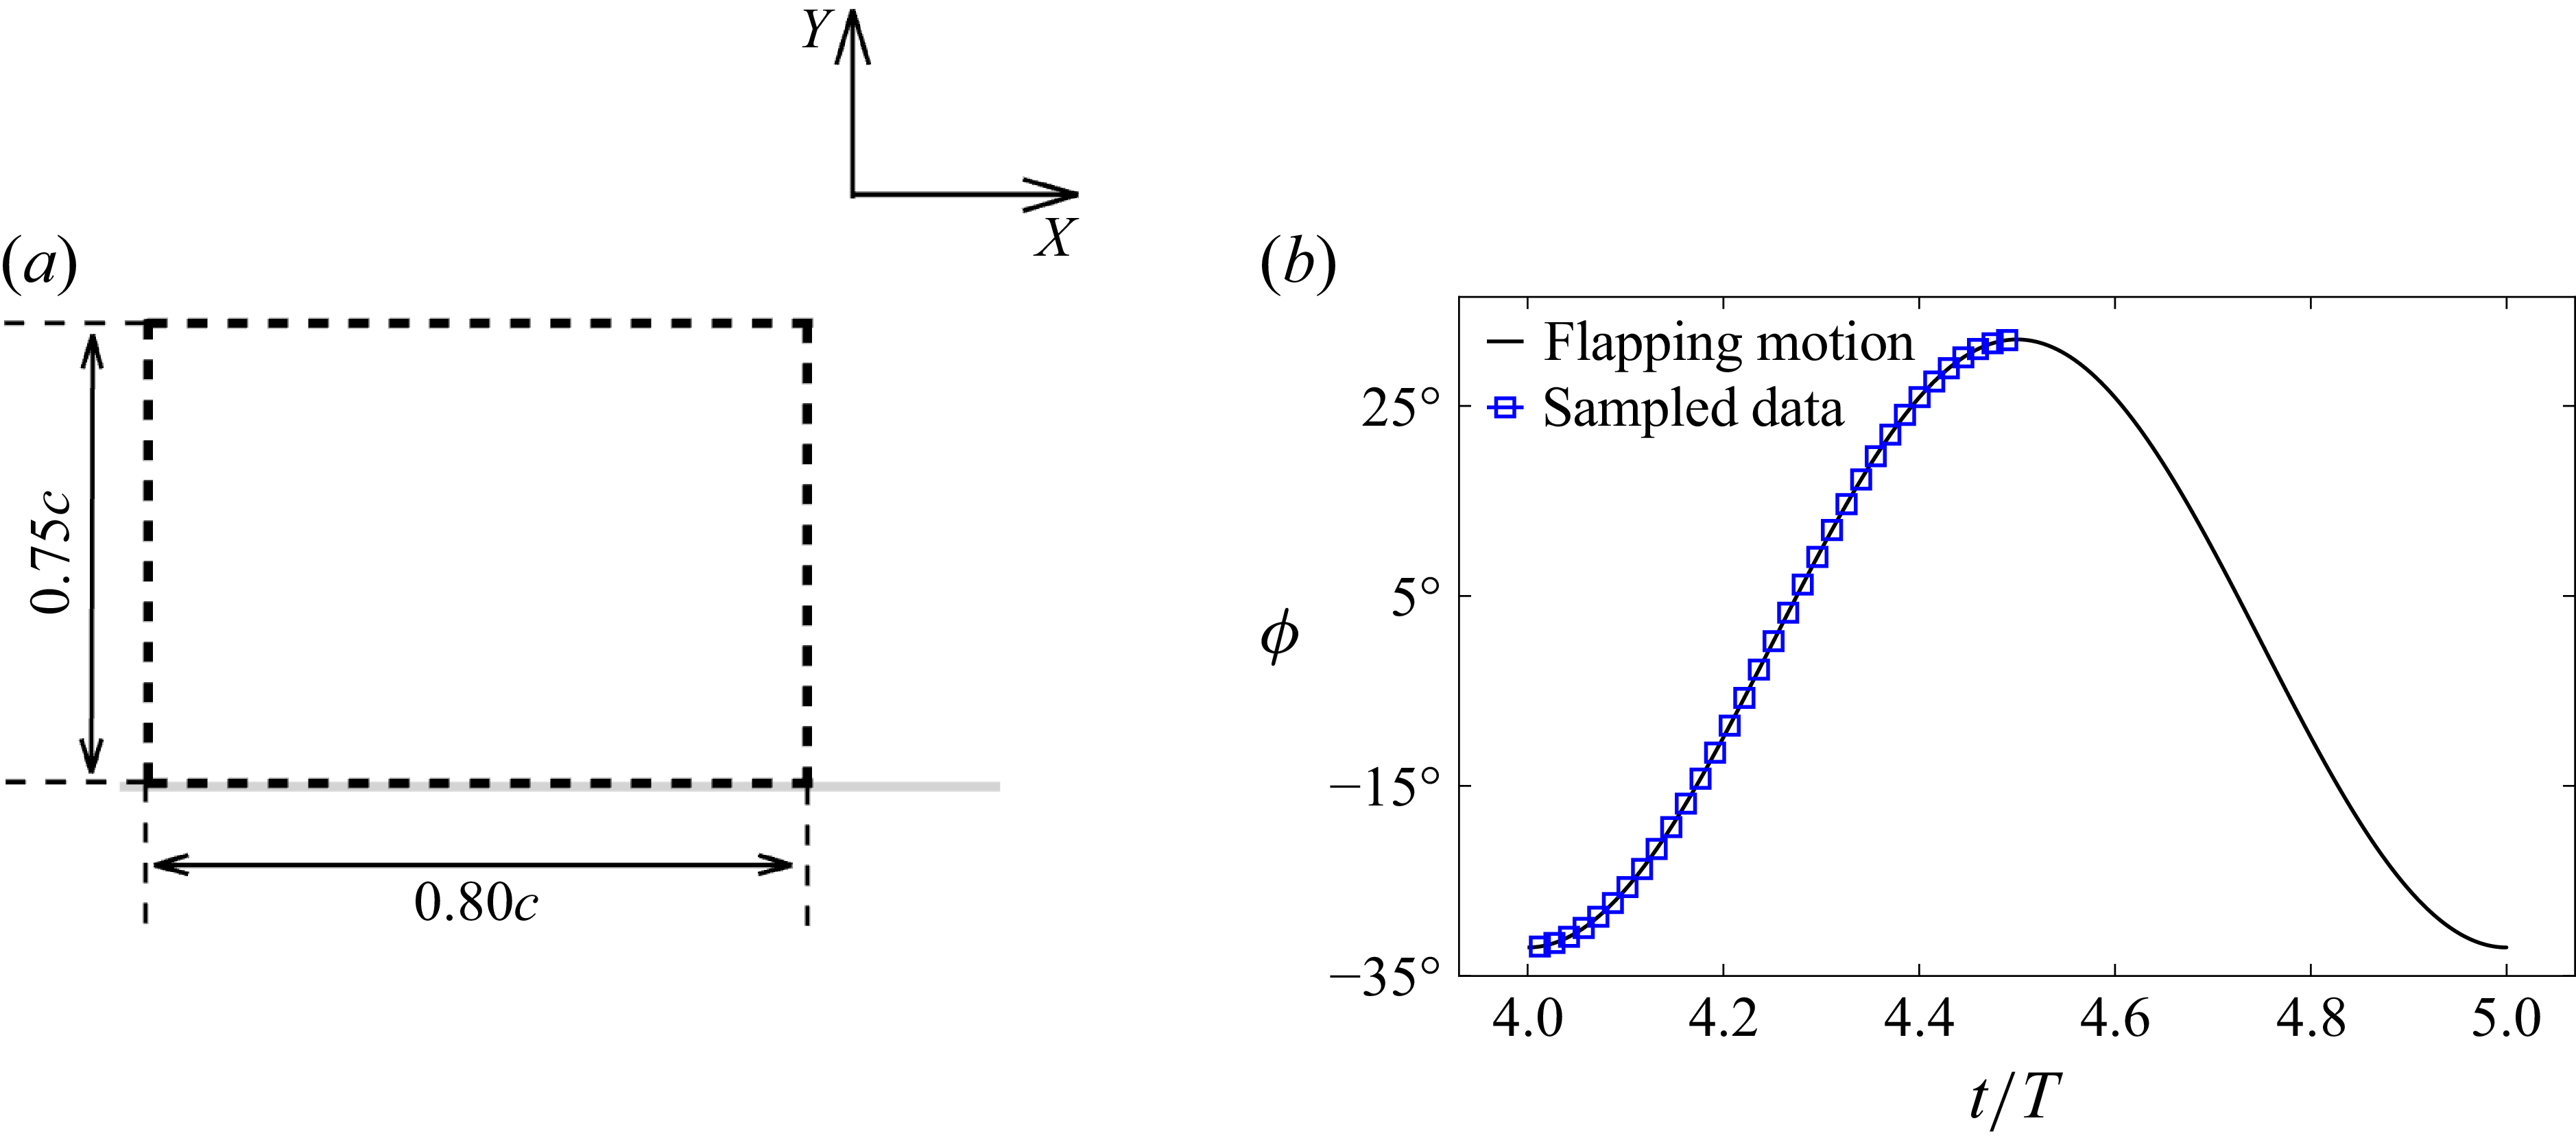
Sectional LEV circulation analysis along the wing span. (a) Control volume at a specific spanwise location represented in the local sectional reference frame. (b) Sampled data during the downstroke period.

The sectional LEV circulation analysis is conducted at two spanwise locations,
 $z/b$
= 0.3 and 0.5, to investigate the effects of
 $\alpha _{\textit{eff,max}}$
on the development of the LEV at
 $\textit{St}_A = 0.6$
, and
 $\alpha _{eff, max}$
=
 $9^{\circ }$
,
 $27^{\circ }$
and
 $45^{\circ }$
. As shown in figure 9(a), a local control volume is placed on the top of the suction side of the wing, which is aligned with the local wing chordwise direction. The control volume extends from
 $0.05c$
to
 $0.85c$
in the chordwise direction and
 $0c$
to
 $0.75c$
in the chord-normal direction, where the LEV is fully contained during the whole downstroke period. As shown in figure 9(b), the circulation of the cross-sections of the LEV at three spanwise locations is recorded at 33 instances during the downstroke period.
Temporal evolution of the circulations of the LEV and the secondary structure at
 $z/b$
= 0.6. The solid lines represent the LEV (negative vorticity) and the dashed lines represent the secondary structure (positive vorticity).

Vorticity contour of the LEV cross-section at
 $z/b$
= 0.6.

The temporal evolution of circulation and vorticity contours of the LEV at the mid-span locations (
 $z/b$
= 0.6) are presented in figures 10 and 11, respectively. The circulation is the integration of the vorticity field in the control volume. Three representative time instants are shown for each
 $\alpha _{\textit{eff,max}}$
in figure 11, revealing distinct vortex dynamics depending on the degree of spanwise twisting. Figure 10 shows that for
 $\alpha _{\textit{eff,max}}=27^{\circ }$
, the LEV circulation exhibits a plateau region, characteristic of a well-regulated vortex growth mechanism. In contrast, at
 $\alpha _{\textit{eff,max}} = 9^{\circ }$
, the LEV circulation increases monotonically (roughly linearly) throughout the downstroke without reaching a peak. The vorticity contours in figure 11 confirm that the LEV does not pinch off from its downstream boundary layer at this low effective angle of attack. At
 $\alpha _{\textit{eff,max}} = 45^{\circ }$
, the LEV circulation reaches its maximum at
 $t/T \approx 4.37$
and then drops. Comparing
 $\alpha _{\textit{eff,max}} = 27^{\circ }$
and
 $45^{\circ }$
, both cases exhibit clear LEV formation (figure 11); however, the LEV pinches off from the downstream boundary layer earlier at
 $\alpha _{\textit{eff,max}} = 45^{\circ }$
due to the larger local
 $\alpha _{\textit{eff}}$
. Notably, the case with a circulation plateau (
 $\alpha _{\textit{eff,max}}=27^{\circ }$
) achieves the highest propulsive efficiency (figure 6), demonstrating that neither excessively low nor high
 $\alpha _{\textit{eff,max}}$
enables optimal LEV regulation. The formation and role of the secondary structure beneath the LEV, a lambda-shaped vortical structure comprising a positive vortex and a positive wall shear layer, also vary significantly with
 $\alpha _{\textit{eff,max}}$
. At
 $\alpha _{\textit{eff,max}} = 9^{\circ }$
, no secondary structure develops. For
 $\alpha _{\textit{eff,max}}=27^{\circ }$
, the secondary structure initiates almost simultaneously with the onset of the LEV circulation plateau, suggesting that it regulates LEV growth (Akkala & Buchholz Reference Akkala and Buchholz2017). This regulatory mechanism enables sustained thrust production without premature vortex shedding. At
 $\alpha _{\textit{eff,max}}=45^{\circ }$
, the secondary structure exhibits substantially stronger circulation and a more pronounced
 $\lambda$
-shaped morphology (figure 11). However, the larger spanwise
 $\alpha _{\textit{eff}}$
distribution prevents effective regulation of LEV growth, causing premature circulation decay and consequently reduced propulsive efficiency.
Temporal evolution of the circulations of the LEV and the secondary structure at
 $z/b$
= 0.3. The solid lines represent the LEV (negative vorticity) and the dashed lines represent the secondary structure (positive vorticity).

Vorticity contour of the LEV cross-section at
 $z/b$
= 0.3. The legend of the vorticity contour is identical to that of figure 11.

The temporal evolution of circulation and vorticity contours at the inner wing region (
 $z/b=0.3$
) are presented in figures 12 and 13, respectively. While the overall trends are similar to those at mid-span, several important differences emerge due to the spanwise variation in effective angle of attack.The magnitudes of both LEV and secondary structure circulation are substantially smaller at
 $z/b=0.3$
than those at mid-span location, reflecting the reduced local
 $\alpha _{\textit{eff}}$
at the inner wing. Correspondingly, LEV pinch-off from the downstream boundary layer occurs only at
 $\alpha _{\textit{eff,max}}=45^{\circ }$
(figure 13), in contrast to mid-span where pinch-off is observed at both
 $\alpha _{\textit{eff,max}}=27^{\circ }$
and
 $45^{\circ }$
. Notably, secondary structure formation is contingent upon LEV pinch-off; when the LEV remains attached to its downstream boundary layer, no secondary structure develops. Moreover, the circulation plateau characteristic of mid-span at
 $\alpha _{\textit{eff,max}}=27^{\circ }$
is absent at all
 $\alpha _{\textit{eff,max}}$
values in the inner wing region as the LEV circulation at
 $\alpha _{\textit{eff,max}}=9^{\circ }$
and
 $27^{\circ }$
does not reaches its maximum value by the end of the flapping-down period.
These spanwise variations in vortex dynamics reflect the distinct aerodynamic roles of the inner and outer wing regions, as hypothesised by previous studies (Videler et al. Reference Videler, Stamhuis and Povel2004; Thielicke & Stamhuis Reference Thielicke and Stamhuis2015). At the inner wing, the relatively small twisting angle (large local
 $\alpha _{\textit{eff}}$
) orients force production predominantly in the vertical direction, enabling this region to generate lift. Conversely, at the outer wing, the larger twisting angle (smaller local
 $\alpha _{\textit{eff}}$
) redirects force production towards the streamwise direction, making this region the primary source of thrust during cruise flight. This functional differentiation along the span is facilitated by the spanwise distribution of
 $\alpha _{\textit{eff}}$
imposed by wing twist.
3.3.
Effects of
$\varPhi$

Effects of
 $\varPhi$
on (a) the average thrust coefficient, (b) the average side force coefficient, (c) the average resultant force magnitude coefficient, (d) the average power consumption coefficient and (e) the propulsive efficiency at
 $\textit{St}_A = 0.6$
,
 $\alpha _{\textit{eff,max}} = 27^{\circ }$
and
 $\textit{Re}_c$
= 1500.

Magnitude (radius) and direction (azimuth angle) of the average resultant force coefficient with increasing
 $\varPhi$
. The
 $X$
direction is along the
 $90^\circ$
direction and the
 $Z$
direction is along the
 $0^\circ$
direction. The increase direction of
 $\varPhi$
is indicated by the arrow.

The influence of phase difference
 $\varPhi$
between flapping and twisting motions on cycle-averaged aerodynamic performance is presented in figure 14, with the magnitude and direction of the resultant force shown in figure 15. By convention, positive
 $\varPhi$
indicates that the wing reaches the prescribed
 $\alpha _{\textit{eff,max}}$
earlier during the downstroke. The resultant force magnitude decreases approximately linearly with increasing
 $\varPhi$
(figure 14
c), while its direction remains bounded between
 $30^{\circ }$
and
 $60^{\circ }$
(figure 15). The power consumption coefficient (figure 14
d) also decreases approximately linearly with increasing
 $\varPhi$
. The side force coefficient decreases with increasing
 $\varPhi$
(figure 14
b), but with a smaller decrease rate compared with the resultant force magnitude and the power consumption coefficient. It can be seen that all the force coefficients decrease when the twisting motion is delayed (positive
 $\varPhi$
). Notably, thrust production and propulsive efficiency respond differently to phase variation. Maximum thrust is achieved at
 $\varPhi = -20^{\circ }$
(figure 14
a), whereas maximum propulsive efficiency occurs at
 $\varPhi = 20^{\circ }$
(figure 14
e). This indicates a fundamental trade-off: advancing the twisting motion (negative
 $\varPhi$
) enhances thrust generation, while delaying it (positive
 $\varPhi$
) improves propulsive efficiency. Despite differences in flapping kinematics and free-stream flow conditions, the present observation is consistent with a previous study on a hovering wing undergoing wing flip (pitching about the mid-chord), wherein an advanced flip was found to enhance lift production (Chen & Wu Reference Chen and Wu2024).
The 3-D vortical structures identified by Q = 50 coloured by the pressure coefficient at
 $\textit{St}_{A}$
= 0.6 and
 $\alpha _{\textit{eff,max}}$
=
 $27^{\circ }$
for
 $\varPhi$
=
 $-20^{\circ }$
,
 $20^{\circ }$
and
 $40^{\circ }$
in the fifth flapping cycle. The legend of the pressure coefficient is identical to that of figure 8.

Three-dimensional vortical structures at
 $\varPhi = -20^{\circ }$
,
 $20^{\circ }$
and
 $40^{\circ }$
during the downstroke are presented in figure 16, revealing how phase difference modulates vortex evolution and attachment. At the beginning of the downstroke (
 $t/T = 4.125$
), the LEV at
 $\varPhi = 40^{\circ }$
is slightly larger than the others due to the higher
 $\alpha _{\textit{eff}}$
during early downstroke. However, its core pressure is elevated compared with the other cases, indicating weaker suction consistent with figure 14(c). Overall, LEV morphology remains similar across all three cases at this early stage. By mid-downstroke (
 $t/T = 4.250$
), significant differences emerge. The LEV exhibits greater strength and lower core pressure when the wing reaches maximum
 $\alpha _{\textit{eff}}$
after mid-downstroke (
 $\varPhi = -20^{\circ }$
) compared with when it peaks earlier (
 $\varPhi = 20^{\circ }$
). At
 $\varPhi = 40^{\circ }$
, the LEV begins to shed from the wing and loses coherence. These observations underscore the importance of proper flapping-twisting coordination for generating and maintaining a strong, attached LEV during cruise. During the latter half of the downstroke (
 $t/T = 4.375$
and
 $4.500$
), phase effects become even more pronounced. At
 $\varPhi = -20^{\circ }$
, both LEV and TV maintain coherent structures and remain attached to the wing, sustained by the relatively high spanwise
 $\alpha _{\textit{eff}}$
distribution. In contrast, at
 $\varPhi = 20^{\circ }$
and
 $40^{\circ }$
, the LEV and TV lose coherence and shed into the wake. The underlying mechanism relates to vorticity supply and LEV–wing interaction. Delayed twisting (positive
 $\varPhi$
) reduces the influx of leading-edge shear layer vorticity during the second half of the downstroke, starving the LEV and TV while intensifying LEV–wing interaction. Conversely, advanced twisting (negative
 $\varPhi$
) sustains vorticity supply to the LEV as the wing decelerates, resulting in a stronger vortex. Furthermore, early twisting reduces LEV–wing interaction, promoting prolonged LEV attachment and explaining the enhanced thrust production observed at negative
 $\varPhi$
.
Proper coordination between flapping and twisting motions critically influences both thrust production and propulsive efficiency. The trade-off between these two performance metrics stems from the timing of vortex detachment relative to stroke reversal. Advanced twisting (negative
 $\varPhi$
), where the wing reaches maximum
 $\alpha _{\textit{eff}}$
later in the downstroke, generates greater thrust, but at the cost of increased drag. This drag penalty arises when vortical structures generated during the previous half-stroke remain attached to the wing at the onset of the subsequent half-stroke. Since the LEV and TV are positioned aft of the wing’s centroid, their persistence during stroke reversal produces a drag force that opposes the wing’s motion. In contrast, delayed twisting (positive
 $\varPhi$
) promotes earlier vortex detachment and thereby enhances propulsive efficiency. By reducing leading-edge and tip shear layer influx during the latter half of each half-stroke, delayed twisting facilitates LEV and TV shedding before stroke reversal. This timing ensures that the wing begins each half-stroke with minimal residual vortical structures, thereby reducing form drag and improving efficiency. Thus, while advanced twisting maximises instantaneous force production, delayed twisting optimises the power economy by minimising parasitic drag associated with vortex–wing interaction across stroke cycles.
Temporal evolution of the circulations of the LEV and the secondary structure. The solid lines represent the LEV (negative vorticity) and the dashed lines represent the secondary structure (positive vorticity). (a)
 $z/b$
= 0.3 and (b)
 $z/b$
= 0.6.

Vorticity contour of the LEV cross-section at
 $z/b$
= 0.6 for
 $\varPhi =-20^{\circ },\ 0^{\circ }$
and
 $40^{\circ }$
at
 $t/T = 4.45$
. The legend of the vorticity contour is identical to that of figure 11.

The temporal evolution of the LEV and secondary structure circulations at
 $z/b = 0.3$
and
 $0.6$
during the downstroke is presented in figure 17, with vorticity contours at
 $z/b = 0.6$
and
 $t/T = 4.45$
shown in figure 18. Peak LEV circulation magnitude decreases monotonically with increasing
 $\varPhi$
at both spanwise locations. Early in the downstroke, cases with larger
 $\varPhi$
exhibit slightly higher negative vorticity circulation due to the elevated
 $\alpha _{\textit{eff}}$
during this phase. Comparing
 $\varPhi = -20^{\circ }$
and
 $20^{\circ }$
– which share the same maximum twisting angle but differ in timing – reveals that the former achieves substantially higher peak LEV circulation. This demonstrates that early twisting during the downstroke enhances LEV growth. At the inner wing (
 $z/b = 0.3$
), no positive vorticity accumulates beneath the LEV for any
 $\varPhi$
value, indicating that the LEV remains attached to its downstream boundary layer and no secondary structure formation. Complete LEV detachment typically triggers formation of a half-saddle point, which promotes secondary structure development through vorticity accumulation (Rival et al. Reference Rival, Kriegseis, Schaub, Widmann and Tropea2014); the absence of this accumulation confirms incomplete separation at this inboard location. At
 $z/b = 0.6$
, positive vorticity accumulation occurs for all cases, indicating LEV detachment and secondary structure formation. LEV circulation evolution remains similar across all
 $\varPhi$
values until mid-downstroke (figure 17
b); substantial differences emerge only after secondary structure initiation. Secondary structure circulation strength decreases with increasing
 $\varPhi$
, corresponding to variations in shear layer orientation. As shown in figure 18, the angle between the leading-edge shear layer and the wing surface decreases with increasing
 $\varPhi$
, consistent with the reduced
 $\alpha _{\textit{eff}}$
during late downstroke. At higher
 $\alpha _{\textit{eff}}$
(negative
 $\varPhi$
), the steeper shear layer angle sustains continued LEV growth. Conversely, increasing
 $\varPhi$
causes the LEV to migrate closer to the trailing edge by the end of the downstroke, facilitating faster vortex shedding at the onset of the upstroke and thereby reducing drag. Thus,
 $\varPhi$
primarily modulates propulsive performance by controlling shear layer orientation and, consequently, LEV growth dynamics.
4. Conclusions
Numerical simulations have been performed to investigate the effects of spanwise twisting on the aerodynamic force production and the LEV dynamics of a low aspect-ratio (AR) flapping wing. Several key findings emerge from this study. For each Strouhal number
 $\textit{St}_A$
, an optimal effective angle of attack
 $\alpha _{\textit{eff,max}}$
exists that balances thrust production and propulsive efficiency for a low AR flapping wing, consistent with previous two-dimensional flapping foil studies (Schouveiler et al. Reference Schouveiler, Hover and Triantafyllou2005). Importantly, the resultant force magnitude remains relatively insensitive to
 $\alpha _{\textit{eff,max}}$
variations at fixed
 $\textit{St}_A$
. Rather than modulating overall force production, spanwise twisting primarily reallocates force production between the streamwise and spanwise directions. This force reallocation mechanism enables maximum propulsive efficiency (
 $\eta = 0.36$
) at
 $\textit{St}_A = 0.6$
and
 $\alpha _{\textit{eff,max}} = 27^{\circ }$
. At this optimal condition, the LEV detaches from its downstream boundary layer, triggering the secondary structure, a positive vortical structure, formation beneath the LEV. Circulation analysis reveals that the secondary structure regulates LEV growth, establishing a circulation plateau during the latter half of the downstroke (
 $t/T = 4.3$
–
 $4.5$
). This regulated vortex growth is critical to achieving high propulsive efficiency. In contrast, at the inner wing (
 $z/b = 0.3$
), the LEV remains attached to the downstream boundary layer for
 $\alpha _{\textit{eff,max}} = 9^{\circ }$
and
 $27^{\circ }$
due to the smaller local
 $\alpha _{\textit{eff}}$
. This spanwise variation in vortex dynamics reflects functional differentiation along the wing: the inboard region maintains attached flow and generates lift through steady aerodynamic mechanisms, while the outboard region exploits unsteady LEV dynamics to produce thrust. Phase difference
 $\varPhi$
between twisting and flapping motions significantly affects the thrust-efficiency trade-off. Delayed twisting (positive
 $\varPhi$
), where maximum
 $\alpha _{\textit{eff}}$
is reached after mid-downstroke, enhances propulsive efficiency by promoting vortex shedding before stroke reversal and thereby reducing form drag. Conversely, advanced twisting (negative
 $\varPhi$
), where maximum twisting occurs early in the downstroke, sustains higher
 $\alpha _{\textit{eff}}$
during the power phase and thus amplifies thrust production. This finding highlights the importance of precise kinematic coordination in optimising the low AR flapping wing performance for different flight objectives.
Funding
This work was conducted with the assistance of computational resources from the National Computational Infrastructure (NCI), supported by the Australian Government.
Declaration of interests
The authors report no conflict of interest.
Appendix A. Verification of result reliability
A.1. Grids dependency study
Effects of grid resolution on (a) the drag coefficient, (b) the lift coefficient and (c) the side force coefficient at
 $\textit{Re}$
= 4500.

To study the effects of the grid resolution on the results, simulations of three mesh resolutions are conducted at
 $\textit{Re}$
= 4500 for
 $\textit{St}_A$
= 0.6,
 $\alpha _0$
=
 $36^{\circ }$
and
 $\varPhi$
= 0. Here,
 $\Delta x = c /64$
is the grid resolution in the finest block for the coarse mesh set-up,
 $\Delta x = c / 128$
is the grid size in the finest block for the medium mesh set-up and
 $\Delta x = c /256$
is the grid size in the finest block for the fine mesh set-up. The time histories of the drag, lift and side force coefficients are shown in figure 19. With increasing the mesh resolution, the difference in
 $C_D$
decreases, where the viscous friction on the wing is resolved well by using medium and fine grids. Here,
 $C_L$
and
 $C_{\!Z}$
are dominated by the pressure-induced force, which is less sensitive to the grid resolution. It can be seen that the simulation results at
 $\textit{Re}$
= 4500 are accurate enough using the medium mesh set-up. Therefore, simulation results at
 $\textit{Re}$
= 1500 using the medium mesh set-up are converged.
A.2. Wing area change in twisting
Wing area in one flapping cycle for
 $\textit{St}_A = 1.0$
and
 $\alpha _{\textit{eff}} = 9^{\circ }$
. This is the case with the largest wing area change as the maximum twisting effects.

The wing area change for
 $\textit{St}_A = 1.0$
and
 $\alpha _{\textit{eff}} = 9^{\circ }$
(case with the largest twisting) in one flapping cycle is shown in figure 20. It is found that the wing area at the maximum twisting time instance (
 $t/T = 0.25$
and
 $0.75$
) is approximately 3.5 % larger than the non-twisting time instance (
 $t/T = 0$
and
 $1$
). The area change is very small compared with the change in the aerodynamic force coefficients with increasing
 $\alpha _{\textit{eff,max}}$
(decreasing twisting), as shown in figure 4. Thus, it can be considered that the effects of wing area change on the aerodynamics of the wing are negligible.
A.3. Effects of Reynolds numbers
Time histories of (a) the lift coefficient, (b) the thrust coefficient and (c) the side force coefficient for
 $\textit{St}_A = 0.6$
,
 $\alpha _{\textit{eff,max}} = 27^{\circ }$
and
 $\varPhi = 20^{\circ }$
at
 $\textit{Re}$
= 500, 1500, 4500 and 10 000 during the fourth flapping cycle.

The time histories of the lift (panel a), thrust (panel b) and side force coefficient (panel c) for the cases of
 $\textit{St}_A = 0.6$
and
 $\alpha _{\textit{eff,max}}=27^\circ$
at
 $\textit{Re}$
= 500, 1500, 4500 and 10 000 are shown in figure 21. The difference in
 $C_L$
and
 $C_{\!Z}$
between the three Reynolds numbers is slight because the wing inertial force due to acceleration and pressure-induced force from the vortices, an inviscid process, dominates force production in the non-streamwise direction. For
 $C_{\!T}$
, the variation is similar among the three Reynolds numbers, but the magnitude of
 $C_{\!T}$
is higher at
 $\textit{Re}$
= 1500, 4500 and 10 000 due to the smaller skin friction, where the increase in the magnitude of
 $C_{\!T}$
decreases with increasing
 $\textit{Re}$
being consistent with the laminar force scaling of flapping wings found in previous studies (Senturk & Smits Reference Senturk and Smits2019; Verma et al. Reference Verma, Freeman and Hemmati2022). Because of the limited differences in the aerodynamic performance within the range of
 $\textit{Re}$
 $O(10^3)$
to
 $O(10^5)$
for flapping wings (Anderson et al. Reference Anderson, Streitlien, Barrett and Triantafyllou1998; Zhang et al. Reference Zhang, Huang, Pan, Yang and Huang2022a
), only the results at
 $\textit{Re}$
= 1500 are discussed and analysed in this work.

 x
 z

 αeff
 z/b=0.3
 StA=0.6
 αeff,max=27∘
 Φ=0∘
 αeff
 αeff
 αeff


 Re

 Re
 Re
 X
 90∘
 Z
 0∘
 αeff,max

 η
 StA−αeff,max
 Re

 StA
 Re

 StA
 αeff,max
 9∘
 27∘
 45∘

 z/b

 z/b

 z/b

 z/b

 Φ
 StA=0.6
 αeff,max=27∘
 Rec

 Φ
 X
 90∘
 Z
 0∘
 Φ

 StA
 αeff,max
 27∘
 Φ
 −20∘
 20∘
 40∘

 z/b
 z/b

 z/b
 Φ=−20∘, 0∘
 40∘
 t/T=4.45

 Re

 StA=1.0
 αeff=9∘

 StA=0.6
 αeff,max=27∘
 Φ=20∘
 Re


