


A standard account of the Senate's Civil Rights Act of 1964 portrays an uncompromising leadership who succeeded in passing “a relatively pure version of their bill” (Rodriguez and Weingast Reference Rodriguez and Weingast2003, 1425). Concessions to the Republicans were largely symbolic, by this account, and the hundred plus amendments offered by southern opponents after the cloture vote were simply obstructionism, having no effect on the final bill.
The passage of the 1964 act was followed by the Johnson election landslide. This landslide, it is argued, transformed the civil rights movement into even more of a juggernaut. With the 1965 Voting Rights Act, an unconstrained majority was once again able to push a strong bill through without consideration of the minority.
Is this account accurate? Is it consistent with any theory of the legislative process? In particular, we ask if civil rights legislation represented the uncompromised dominance of the majority or a compromise between the majority and the minority. Also, we investigate how much the outcomes of the legislative battles were shaped by the supermajority requirement in the Senate. In the process, we illustrate more generally how we can use roll call data to test a theory of legislation in a multidimensional space.
The best articulated theory of legislative behavior, the spatial theory, is premised on the belief that “Legislation is the product of choices made by legislators pursuing strategic aims within the structure of legislative institutions, rules, and norms” (Rodriguez and Weingast Reference Rodriguez and Weingast2003, 1420). Yet, the tools for testing this theory against empirical evidence have only now become available. On the one hand, the theory itself has been less than perfectly clear about its predictions regarding the results of the process in multidimensional spaces. On the other hand, empirical estimates of the spatial location of final bills have been in short supply, due to the challenge of estimating outcomes of legislative processes in the same space as available estimates of legislators’ preferences. We combine two tools, recently developed, to overcome these challenges. These tools enable a long overdue empirical testing of the spatial theory of legislative behavior and a better understanding of the intrinsic aspects of the legislative process.
One tool is an algorithm that computes the uncovered set (UCS), a predictive set derived from fundamental first principles of the spatial theory (Bianco, Jeliazkov, and Sened Reference Bianco, Jeliazkov and Sened2004). Bianco et al. (Reference Bianco, Lynch, Miller and Sened2006; Reference Bianco, Lynch, Miller and Sened2008) use previous and new experiments to test the predictive power of the UCS and find that it correctly predicted a remarkable proportion of outcomes. Even more, the behavior of subjects in the experiments is consistent with the generic logic suggested by the spatial theory of decision making behind the concept. Early subject proposals put on the “experimental floor” quickly entered the UCS, and later proposals cycled within the UCS until everyone “got tired” and a motion to adjourn got enough support to bring the experimental process to an end. Impressed by these results, Bianco and Sened (Reference Bianco and Sened2005) looked to test the concept in natural legislative settings, but found no reliable estimates of final bills’ locations.
Clinton and Meirowitz (Reference Clinton and Meirowitz2003; Reference Clinton and Meirowitz2004) and Jeong (Reference Jeong2008) developed a technique to estimate actual locations of bills in the same space as preference estimates. This breakthrough allows us to calculate the UCS with real estimates of legislators’ ideal points, and then see whether the final outcomes lie within it.
With these novel technologies, we are in a unique position to study concrete examples of legislative processes. The U.S. Senate has many features that make it an excellent testing ground. It is small enough to allow a fluid, open negotiation process. The resulting coalitions often cross party lines. These conditions seem to match the fluid, multilateral coalition formation presumed to lead to the UCS.
We examine the Civil Rights Act of 1964 and the Voting Rights Act of 1965—two of the most important pieces of legislation in the twentieth century—together with the earlier Civil Rights Act of 1957 and the later 1974 reauthorization of the 1965 Education Act, which featured a major controversy about busing. Our analysis questions the standard account of the 1964 bill, showing instead that the leadership offered a weaker compromise than they would have preferred, rather than a “pure” bill, and allowed the passage of weakening amendments to enhance the possibility of passage, even after the famous filibuster was broken.
Supporters of the Voting Rights Act were able to stop almost all amendments. But this does not imply unilateral power as much as careful positioning to anticipate and undermine the opposition. The leadership's proposal was revealing in that it was located in the UCS, but on the side of the UCS toward the minority opponents. Strong supporters wanted to include a legislative ban on a poll tax, for example, but the leadership positioned the bill in a weaker position to make it less vulnerable to adverse coalitions. The 1974 Education Act amendments also reveal a centrist compromise, despite the emerging reorientation of the Republican Party and a strenuous debate about busing.
In the next section, we review the concept of the UCS and its application to our study. The section following that introduces the methodology of estimating the location of legislative bills. The final section reports the results of our investigation of the four civil rights acts. By guiding our investigation with the two technical tools that constrain it so precisely, we achieve not only a higher resolution of inquiry, but also a clarity in the descriptive narrative that in some instances allows us to supply a novel interpretation of the historical account of the passage of civil rights legislation.
THE UNCOVERED SET
The original spatial theory of legislative behavior submits that the core rarely exists in multidimensional, majority voting games (McKelvey Reference McKelvey1976; Reference McKelvey1979; McKelvey and Schofield Reference McKelvey and Schofield1987; Schofield Reference Schofield1978), rendering outcomes of legislative processes indeterminate. However, theorists have concluded that the UCS provides significant constraints and a degree of predictability for majority rule legislatures (Cox Reference Cox1987; McKelvey Reference McKelvey1986; Miller Reference Miller1980; Shepsle and Weingast Reference Shepsle and Weingast1984).Footnote 1 Although experiments support this claim (Bianco et al. Reference Bianco, Lynch, Miller and Sened2006; Reference Bianco, Lynch, Miller and Sened2008), the UCS has yet to be tested against data from real world majority rule institutions. After defining the UCS, we clarify the empirical relevance of the UCS and its applicability to the study of legislative politics.
Definition of and Motivation for the Uncovered Set
Let N be a set of legislators.Footnote 2 For any i ∈ N, assume Euclidean preferences defined by an ideal point, ρi. Let x, y, z ∈ X be elements in the set of possible outcomes, X. We say that x beats y if it is closer than y to more than half of ideal points. That is, there is a majority that prefers x to y and can enforce it.
A core alternative is unbeaten by any other alternative when no majority can agree to replace a core point with anything else. When a core exists, it is the clear manifestation of majority rule. It is a centrist outcome, at which voters’ ideal points are “balanced” around the core (Plott Reference Plott1967). If no core exists, it is not clear that any alternative represents the will of the majority in a meaningful sense. One can construct scenarios in which immoderate, distant outcomes are selected by majority rule (McKelvey Reference McKelvey1976). But if the core is empty, alternatives are divided into covered and uncovered sets. Alternative x covers y if x beats y and if any point z that beats x also beats y. If x covers y, y is beaten by x and by any alternative that beats x. The UCS is the set of alternatives that are not covered.
Theorists have made compelling discoveries about the UCS. It is the same as the core when a core exists (McKelvey Reference McKelvey1986, 290, Theorem 1). If x is unanimously preferred to y, then y is not in the uncovered set. The UCS is a centrist set that gets larger as the distribution of ideal points gets polarized, and smaller as it approaches symmetry conditions that result in a core (Cox Reference Cox1987; Plott Reference Plott1967). Technical results show that legislative outcomes of majority rule institutions are constrained by the boundaries of the UCS. If legislators consider the consequences of their behavior, rather than choosing myopically between alternatives, outcomes of majority rule processes will lie in the UCS (McKelvey Reference McKelvey1986; Miller Reference Miller1980). Even more, for any “status quo point” at which a voting process starts, there exists a two-step agenda that yields a point in the uncovered set as its final outcome (Shepsle and Weingast Reference Shepsle and Weingast1984). Thus, legislators can only secure outcomes within the UCS (Cox Reference Cox1987).
Although monopolistic agenda setters with sincere voters may guarantee any alternative they want (McKelvey and Schofield Reference McKelvey and Schofield1987), Banks (Reference Banks1985) showed that with sophisticated legislators, final outcomes, given any agenda, must be in the UCS. Results show that strategic voting and sophisticated agenda control, generating a fixed and known agenda, necessarily lead to outcomes in the UCS. At times, this has been interpreted as a claim that strategic voting is a necessary condition for any application of the UCS. But this is not the case. McKelvey (Reference McKelvey1986) shows that a large range of institutions lead to outcomes in the UCS—including cooperative coalition formation of the sort that leads to the core, when it exists. The latter institution does not require strategic voting or fixed, known agendas generated by sophisticated agenda setters. As McKelvey (Reference McKelvey1986, 283) noted, “Because of its apparent institution-free properties, the uncovered set provides a useful generalization of the core when a core does not exist.” That is, the UCS offers a prospect for an “institution-free” social choice theory, precisely because a significant variety of institutions induces outcomes in the UCS.
McKelvey (Reference McKelvey1986) invokes Farquharson's notion of “dominated strategies” to explain the usefulness of the UCS to participants in a game with a voting tree offering a set of alternatives. If a legislator does not like an outcome y, and if y is covered by some other alternative x, then “an individual can unilaterally quash y by introducing some alternative x that covers it.” Introducing x has the effect of guaranteeing that y will not be chosen, “regardless of whether the individual knows the other proposals on the agenda and regardless of whether other players are allowed to propose amendments subsequent to the introduction of x” (297). Thus, as legislators consider alternatives for consideration, they do not need to know the agenda or how it will evolve—introducing a covered outcome is not good politics.
Although a fixed agenda would allow for strategic voting and backward induction, the U.S. Senate does not have a fixed agenda. Amendments are formulated as the Senate proceeds. They are negotiated more or less continually during the floor consideration in the Senate, as coalitions are being constructed. By McKelvey's account, even in such an inchoate process, the UCS is not only appropriate, but is also the recommended solution concept of choice.
Miller (Reference Miller1980) and Cox (Reference Cox1987) use two-candidate elections as an intuitive explanation for the selection of outcomes in the UCS. With two candidates, “an electoral strategy is undominated (in the usual game theoretic sense) if and only if it is an element of the uncovered set” (Cox Reference Cox1987, 408). In a variety of settings, then, the motivation for selecting an outcome in the UCS is as powerful and as simple as ruling out dominated outcomes. Like an election candidate, a coalition negotiator has no reason to select a dominated outcome. If legislators consider the consequences of their behavior and negotiate accordingly, the process should lead to outcomes in the UCS (McKelvey Reference McKelvey1986; Miller Reference Miller1980), regardless of the “status quo” (SQ) at which it started (Shepsle and Weingast Reference Shepsle and Weingast1984). Legislators can secure uncovered outcomes using relatively simple agendas. Therefore, the UCS may be understood as the best predictive set of likely final outcomes in legislatures (Bianco and Sened Reference Bianco and Sened2005; Cox Reference Cox1987).
Estimating the Uncovered Set
The aforementioned characteristics marked the UCS as a prime solution concept, but the absence of an analytical characterization made it hard to use as a predictive tool. The contribution of Bianco, Jeliazkov, and Sened (Reference Bianco, Jeliazkov and Sened2004) allows us to estimate the set for any profile of ideal points. To estimate the UCS, Bianco, Jeliazkov, and Sened (Reference Bianco, Jeliazkov and Sened2004) treat the policy space as a collection of discrete outcomes. Their computational algorithm recovers an approximation of the UCS that convergesFootnote 3 to the interior of the UCS as the resolution of the grid goes to infinity (Bianco, Jeliazkov, and Sened Reference Bianco, Jeliazkov and Sened2004, Theorem 2).
Predictive Power of the Uncovered Set in Laboratory Experiments
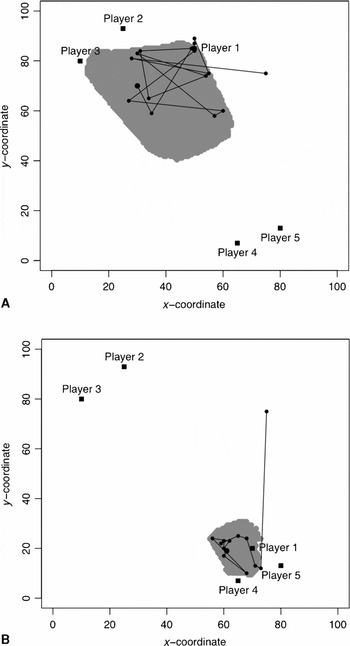
Bianco et al. (Reference Bianco, Lynch, Miller and Sened2006, 846, Table 1) show a remarkable success at “retrodicting” experimental results conducted in the past three decades, none of which was designed to test the UCS. The predictive success ranged between 73% and 100%, and for the 272 experimental trials, averaged 93.75%. Unfortunately, most of the preference profiles used resulted in big UCSs, so the predictive success could be attributed to the size of the predictive set (Bianco et al. Reference Bianco, Lynch, Miller and Sened2006, 841, Figure 1), and the studied experiments involved only small numbers of well-informed individuals. Bianco et al. (Reference Bianco, Lynch, Miller and Sened2008) address these issues. First, two treatments were conducted in a structured, information-rich, five-player environment. Moving the ideal point of one player, the preference profile changed so that in one treatment it was much smaller and disjoint from the UCS in the other. Second, a paper-and-pencil, large n (35), experiment, with barely informed subjects, was also performed. Again, the difference between treatments was a shift in the location of the UCS due to a shift of ideal points in the preference profile. Even in those demanding settings, the UCS fared remarkably well (Bianco et al. Reference Bianco, Lynch, Miller and Sened2008, Table 4). Its predictive success rate ranged between 75% and 100% in the small n experiments of well-informed subjects. In the large n experiments, with less informed subjects, it was 59% to 64%. Binomial tests revealed that the UCS was a significantly more efficient predictor than the Pareto set (Bianco et al. Reference Bianco, Lynch, Miller and Sened2008, Table 5). Figure 1 (Bianco et al. Reference Bianco, Lynch, Miller and Sened2008, Figures 2 and 3) reports two decision series made by different groups in two different treatments of the small n experiments. It illustrates how subjects in the experiments support the theoretical expectations, quickly moving into the UCS and then cycling within the set until adjourned. The majority rule process was clearly constrained by the limits of the UCS.
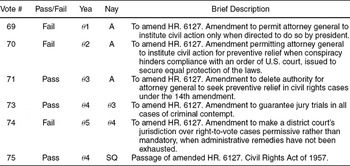
Agenda Constraints on Roll Call Votes on Civil Rights Act of 1957

Two Typical Sequences of Alternating Proposals: (A) Sample S1 Experimental Section, and (B) Sample S2 Experimental Section

Civil Rights Act of 1957

Civil Rights Act of 1964

Alternative Hypotheses
Clearly, our hypothesis is that outcomes of majority rule processes in real legislatures would end up in the UCS. We test this hypothesis with civil rights legislations, using roll call voting data. We look at only four pieces of legislation at this point. This does not allow a rigorous test of alternative hypotheses, but we offer them here to serve as alternative bases for interpretation.
Party Government. The party government hypothesis, attributed to Cox and McCubbins (Reference Cox and McCubbins1993; cf. Aldrich and Rohde Reference Aldrich and Rohde1998, Reference Aldrich, Rohde, Dodd and Oppenheimer2001; Bianco and Sened Reference Bianco and Sened2005) is an obvious alternative hypothesis stating that majority parties would settle on a preferred policy among members and proceed to drive that policy through the legislature with party discipline. Cox and McCubbins test their hypothesis under unidimensional assumptions, where the median of the party is a good measure of where the party wants to go. But if politics is two dimensional, as our investigation suggests, the majority party caucus would not converge to a single core point, but settle on outcomes in a majority party uncovered set (MPUCS), calculated by the same technique as the floor UCS, inputting only the ideal points of the majority party members. Analysis of the constant pulling and shoving of the negotiation process will provide empirical evidence in favor of the party government (Cox and McCubbins Reference Cox and McCubbins1993) argument or the null. If most legislative outcomes fall in the MPUCS, within or outside the floor UCS, we can conclude that the majority caucus is exerting some power over the process. If most outcomes fall in the floor UCS and away from the MPUCS, the empirical evidence challenges the party government hypotheses. At the very least, the party government hypothesis implies that the outcomes fall in the intersection of the MPUCS and the floor UCS. This is consistent with the theory that supports the power of the floor UCS to constrain the set of final outcomes and the idea that majority parties exercise some power in the Senate that allows them to restrict final outcomes to a subset of outcomes that is strictly preferred by those parties over other “feasible” outcomes in the floor UCS.
The Supermajority Core. A second alternative hypothesis is the supermajority core (SMC) hypothesis: due to the filibuster option, legislation can pass only if supported by a two-thirds majority, able to impose cloture. This hypothesis suggests the two-third majority core as a solution concept and predictor of final outcomes in the Senate. In two-dimensional policy spaces, some points cannot be beaten by a coalition of two thirds or better (Greenberg Reference Greenberg1979). These centrist points are therefore core points, as long as smaller coalitions are not decisive. Note, however, that the SMC points, unlike points in the UCSs, should be stable. That is, the UCS presumes the possibility of movement by simple majority rule within the UCS. Because each point in the SMC is undominated by any other supermajority coalition, there should be no policy movement within the SMC.
We end up with four alternative predictive sets: the MPUCS of the majority party, the UCS of the floor, the intersection of the former and the latter, and the SMC. Because we can estimate locations of bills submitted to the floor, amendments voted on in the legislative process, final bill locations, and perceived SQ positions, we can test directly which of the four sets is a better predictor of this wealth of legislative “moves.” We do not expect any of these hypotheses to work to perfection. The legislative process is complicated. Thus, if a particular vote or bill ends up outside any of these predictive sets, it does not constitute a rejection of this solution concept. After all, we are only going by a limited set of observations. Instead, we simply propose to test which of these alternative predictive solution concepts seems to yield the most predictive power in comparison to the others.
A NEW METHOD FOR ESTIMATING SPATIAL LOCATIONS OF FINAL BILLS
One motivation behind our effort is how little exists in terms of estimates of final outcomes in real legislatures. The theoretical model was developed in decades of research and is a leading model of legislative politics, and majority decision making, more generally. We now have the tools to subject this model to a direct empirical test, and that is the subject of the remainder of this article. But first, in this section, we explain and illustrate the methodology.
A Statistical Model for Ideal Point and Bill Location Estimation
For simplicity, we assume the policy space is two dimensional. Let Xi = (x1i, x2i) denote a vector of legislator i's ideal points in a two-dimensional space. Let Yj denote the location associated with the passage of “yea” on vote j and Nj, the location associated with a rejection of j. Assuming a quadratic utility function, the random utility function of legislator i voting yes or no on vote j is defined as

where υij and νij are errors with type I extreme value distributions and β denotes the sensitivity of the utilities to the spatial distance (0 ≤ β ≤ 1).Footnote 4
Define the probability of legislator i to vote yes on vote j by

where Λ() denotes the logistic distribution function of an iid error. Zij is 1 if legislator i voted yea on vote j and 0 otherwise. Consequently, the likelihood is
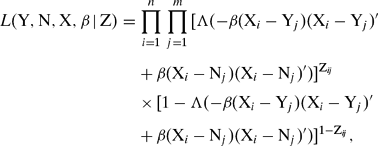
Z is a n × m matrix of roll call votes, n is the number of legislators, and m is the number of votes.
To identify the model, we use the agenda-constrained ideal point estimation technique developed by Clinton and Meirowitz (Reference Clinton and Meirowitz2003; Reference Clinton and Meirowitz2004) and Jeong (Reference Jeong2008). As they note, a “nay” vote means that a legislator prefers the state proposed by the last successful proposal over the state proposed by the current one. By constraining a nay position of a current vote to be the same as a yea position of the last successful proposal, we reduce the number of bill parameters and turn an underidentified statistical model to an identified model. We illustrate this procedure using roll call votes on amendments to the Civil Rights Act of 1957. The policy space in this case is one dimensional, making it simple enough to serve our illustration purpose.
Agenda Constraints in a One-Dimensional Space: The Civil Rights Act of 1957
After the Brown decision in 1954, civil rights quickly became a more important issue in the minds of southerners. In 1956, the year-long Montgomery bus boycott ended successfully with another Supreme Court decision. That year, 101 legislators signed the Southern Manifesto in defiance of the Brown decision and desegregation. Civil rights could potentially block the presidential ambitions of Lyndon Johnson, a powerful Senate majority leader closely associated with Richard Russell and other southern opponents of civil rights. To appear as a national, rather than a regional candidate, he (almost alone among southern senators) had not signed the Southern Manifesto. His presidential ambitions made it essential that he earn credit for helping a reasonable civil rights bill through Congress—but at the same time he had to avoid alienating his southern colleagues. Republicans hoped that increasingly militant black voters in the North could make the difference in their favor, if they supported a civil rights bill. The Eisenhower administration proposed a strong civil rights bill creating an Assistant Attorney General for Civil Rights with power to take suppression of voting rights to federal judges. It also created a Civil Rights Commission. Richard Nixon, hoping to be the beneficiary of African-American gratitude, was presiding over the Senate with the intention of getting the administration bill passed.
Johnson obtained a commitment from his southern colleagues not to filibuster if the bill could be weakened sufficiently. This meant finding amendments that modified the enforcement of the bill so that southern segregationists would not be unduly fearful of the consequences of being found in contempt by a federal judge, but would still get enough liberal votes to pass. While weakening the bill, Johnson had to find a way to take credit for the historic passage of the first civil rights bill since Reconstruction. All amendments voted on were related to enforcement of the bill, which suggests that we analyze a one-dimensional model. In one dimension, the UCS converges to the core at the median legislator's ideal point; the MPUCS converges to the median of the majority party members. Thus, the 1957 bill lets us try our estimation technique in a relatively simple and deterministic world.
On the Civil Rights Act of 1957 (HR. 6127), there were 6 roll call votes in the Senate, excluding procedural votes. So, the total number of the bill parameters is 12 (6 votes × 2 locations), and the model is unidentified. Table 1 shows how we reduce the number of parameters by using agenda information.
On the first vote between an amendment (θ1) and HR. 6127 (A), the amendment failed. In a vote between amendment (θ2) and HR. 6127, this amendment also failed. The third vote was between amendment (θ3) and HR. 6127. This amendment passed. Thus, the reversion point became HR. 6127 as amended by the third amendment. That is, the nay location on the fourth vote is θ3, whereas the yea location is the location of a new amendment (θ4). This amendment also passed, changing the reversion point to θ4. The nay location for the fifth vote is thus θ4, while the yea location is θ5. This amendment failed. The final vote was to pass HR. 6127 as amended by the third and fourth amendments. Thus, the yea location for the final vote was θ4. The nay location of the final passage vote is the state with no new civil rights act because the rejection of the passage of the civil rights bill would have resulted in no legislation. For this reason, the SQ is defined by the nay location on the final passage vote. With these agenda constraints, we reduce the number of bill parameters from 12 to 7, as shown in the third and fourth columns of Table 1. In addition, we fix SQ at –2 to identify the model.
The model is estimated with a Markov Chain Monte Carlo method. To allow priors to play minimal roles, we assigned noninformative priors. To fit the model, we used WinBUGS with 60,000 iterations. Ten thousand draws were discarded to remove the effects of initial values. Chains were thinned every 50th draw to reduce autocorrelation. They converged with Gelman-Rubin statistics of 1 or close to 1.
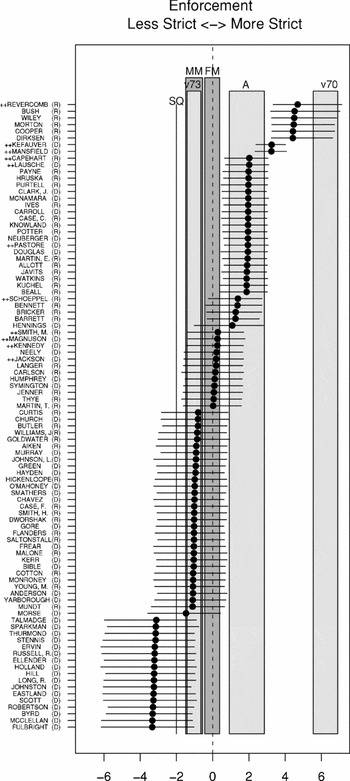
Figure 2 shows estimates of major amendments and ideal points of legislators. Consistent with party alignment of the era, most Republicans favor strict enforcement of civil rights along with northern Democrats. Southern Democrats favor weak enforcement. Republicans Butler and Curtis are the medians. The most important amendment (v71) was offered by Russell (Georgia), a chief strategist for the southerners, who rarely engaged in histrionic debates on the floor. He made an exception on this occasion. Part III of the administration's bill would give the attorney general strong new powers to seek injunctions in federal courts to prevent violations of voting rights—for example, by registrars who differentially applied literacy laws for citizens of different races hoping to register to vote. Russell found that part of the legal foundation for Part III was embedded in Reconstruction era legislation that he claimed was the basis of armed occupation of the South and could be the basis for renewed, similar occupation. As unlikely as this charge might seem, the administration gave no satisfactory rationale for Part III of the legislation. On August 24, the amendment to delete Title 3 passed 52–38, limiting the enforcement power significantly.
The next amendment (v73) offered a jury trial for those found by federal judges in violation of the voting rights protected by the act. For example, a county official might refuse to turn voter registration records to a federal court. Rather than allowing a federal judge to jail the official for civil or criminal contempt, southerners wanted an amendment to guarantee the protection of a jury trial for the defiant official. Liberals opposed a jury trial as cheap insurance for segregationists, in the belief that a white jury would not find a white elected official guilty of violating the voting rights of African Americans.
Our estimate of the location of the bill, modified by the jury trial amendment, is to the left of the floor median. A jury trial weakened enforcement. The vote on the jury trial amendment should have failed if the majority senators at or to the right of the median voted consistently with their estimated preferences. This explains the historical observation that Johnson had to work hard to get this amendment passed (Caro 2002, 895–989).
To pass the jury trial amendment, Johnson courted support from the senators of West Virginia (Revercomb voted for v73 and Neely abstained), where the United Mine Workers Union had historical reason to support jury trials for contempt. As can be seen in Figure 2, eleven senators—marked by “++”—voted “yes” on the crucial jury trial amendment (v73), despite the fact that their estimated ideal points indicated that they should have opposed the movement to v73. The votes of these eleven senators seem to be the result of arm twisting and deal making by the majority leader. For example, both senators from Washington—Magnuson and Jackson—voted for the jury trial amendment after Johnson promised them support for a hydroelectric power dam in Hell's Canyon on the Snake River (Mann Reference Mann1996, 210–11). Another strategic voter was John F. Kennedy. Just as Johnson had to show civil rights strength in his run for the presidency, JFK needed to show an ability to work with southerners in his bid for the White House.
Supported by these strategic votes, the jury trial amendment passed 51–42. This explains the perception that the enforcement of the bill was watered down. The final outcome (v73) was to the left of the median voter, as shown in Figure 2. Our analysis shows that it weakened the enforcement measures, but the final outcome indicates a slight tightening of civil rights enforcement over the existing SQ. We tested the sensitivity of the ideal points estimation to strategic voting on this amendment, recoding the 11 strategic “yes” votes and an absent vote as “nay” votes. The results are similar. This indicates that strategic votes on the jury trial amendment did not affect our estimates of the ideal points.
The estimate of the final outcome (at v73) is to the left of the floor median and overlaps significantly with the majority party median. The movement away from the floor median represented by the vote on the jury trial amendment was the result of efforts by Majority Leader Johnson (see Caro 2002, on Johnson's stratagems). It supports a notion of majority party influence in a unidimensional setting, although this influence was achieved through arm twisting by the majority leader rather than the agenda control suggested by the party government theory. In the next section, we examine how multidimensionality creates a very different legislative environment that leads to very different dynamics than we observe at the unidimensional setting.
It is worth noting that our estimation technique allows the estimation of ideal points based on the fact that, most of the time, the equilibrium strategy for sophisticated, strategic legislators is to vote sincerely (Feddersen, Sened, and Wright Reference Feddersen, Sened and Wright1990). The technique is sensitive to cases where senators vote strategically and can be adjusted to such cases.Footnote 5 This case also alerts us to the centrality of the negotiation process and the energy that goes into the negotiation process when majority legislation is at stake.
NEGOTIATION OF MAJOR CIVIL RIGHTS LEGISLATION
Conventional wisdom regarding civil rights legislation is that it was an idea whose time had come: a coalition of supporters had gained sufficient strength to force the legislation over weakened opposition. As Rodriguez and Weingast (Reference Rodriguez and Weingast2003, 1425) argue, standard accounts of the Civil Rights Act of 1964 “give the most credit to the leaders . . . who ostensibly outmaneuvered the Republicans and succeeded in getting passed a relatively pure version of their bill.” This account regards the amendments considered as “modest” changes in the bill to justify the view that the civil rights liberals either hoodwinked or bulldozed members of the Senate. Either way, civil rights legislation was imposed by ardent civil rights supporters over the opposition of southerners and the powerless bluffing of Dirksen and other Republicans.
We disagree with conventional views of the inevitability, or purity, of the civil rights legislation. Although many of the weakening amendments offered failed, we find amendments that represent meaningful efforts to reshape the legislation, and votes on successful and unsuccessful amendments that helped define the location of the final bill and locate it in the uncovered set. This location shows that it was not the realization of the first choice of the leaders of the successful coalition, but a true compromise, hammered out among Democratic supporters, Republicans of different stripes, and even southerners. “On important legislative issues, ardent supporters and ardent opponents can fulfill their objectives only by collecting enough support from moderates and undecided legislators—legislators whose support is pivotal to the final outcomes. As a price of this support, ardent supporters must typically accept compromises to their legislative vision” (Rodriguez and Weingast Reference Rodriguez and Weingast2003). This was as true for the 1964 and 1965 bills, with ardent public support, as it was for the 1957 and 1974 bills, where public support was limited.
The leaders of the civil rights movement feared that their winning coalition could be undermined in the face of clever weakening amendments that could easily beguile moderate Republicans or border state Democrats, without whose support the bill could either lose strength or lose altogether.
The application of the uncovered set to our study of civil rights legislation is fitting because the outcome of multilateral coalition formation should end up in the uncovered set (McKelvey Reference McKelvey1986). If supporters tried to bulldoze the opposition, imposing “pure” versions of bills, we would expect the outcome to be in the MPUCS. If opponents offer amendments with no realistic hope of passing, again, outcomes should fall in the MPUCS. Only if senators carefully explore a range of coalitions, pulling and tugging in different directions, as did the subjects in the experimental settings, should the final outcome be contained in the UCS of the floor.
Civil Rights Act of 1964 in the Senate
JFK did not take a strong pro–civil rights stand in the first years of his administration, hoping to keep vital southern states in the Democratic column. But by June 1963, public sympathy for the nonviolent civil rights protesters convinced Kennedy to pledge support for a historic civil rights bill. The bill called for integration of public accommodations and an end to discrimination in education and employment. Such a bill would inevitably split the Democratic Party. Conventional wisdom holds that public support created a strong coalition that ran over the opposition, resulting in a bill that gave the civil rights movement what it hoped for. As Thernstrom & Thernstrom (Reference Thernstrom and Thernstrom1997, 143) argue, “In the end, Congress bought the whole loaf and it did so largely in response to events in the late summer of 1963.” The March on Washington in August, the murder of four girls by a Birmingham church bomber, and the assassination of JFK bolstered the civil rights movement. By conventional view, this public support created a large enough coalition to pass the bill. Republicans offered weak opposition due to the role civil rights would play in the upcoming election. Many “argue that the Republicans had little choice other than to accede to the wishes of the ardent supporters of the bill” (Rodriguez & Weingast Reference Rodriguez and Weingast2003, 44). Southern Democrats were just bulldozed.
Indeed, the popularity of the civil rights bill was such that the administration bill was strengthened in the House Judiciary Committee, against the opposition of the Rules Committee chairman, Howard Smith. Although the bill got a rule to get it to the floor, Smith insisted on an open rule, which allowed it to be strengthened by further amendments—anticipating that a much-strengthened bill would not pass. Johnson tried to prevent such amendments. All were fought back by the administration except for the famous amendment offered by Smith himself to extend antidiscrimination features to women. Smith believed that equal treatment for women would kill the bill. But on February 10, the House passed the bill and sent it to the Senate to become the “base bill” or “reversion outcome” for Senate negotiations.
The legislative battle over the Civil Rights Act is deservedly famous, featuring the longest Senate filibuster and an unusual number of amendments, 109 in total. The strength of the civil rights coalition was seen in several ways. Under normal circumstances, the bill would be sent to the Judiciary Committee chaired by James Eastland of Mississippi, a sworn opponent. To avoid “killing it in Committee,” Majority Leader Mansfield offered a motion to place the bill directly on the Senate Calendar. Testimony to the extraordinary public support for the bill, the motion was supported by a bipartisan, 54–37 vote. The bill went to the floor with Hubert Humphrey, majority whip, serving as the floor leader.
Although some version of a civil rights bill seemed likely before the 1964 election, opponents believed that they could force weakening amendments, as they had in 1957. As Georgia Senator Talmadge said, “We knew that there was no way in hell we could muster the necessary votes to defeat that civil rights bill, but we thought we could filibuster long enough to get the other side to agree to amendments that would make it less offensive” (Mann Reference Mann1996, 400). Opponents believed that support for civil rights was shallow and that the public could be satisfied by a narrow bill and symbolic enforcement. Scope was one dimension that defined the content of the bill, and enforcement, more or less lenient, was the second. The amendment process was crucial in determining whether opponents could build coalitions to weaken the bill and leave it meaningless. It could be inclusive, covering public accommodations, educational opportunities, and jobs, or it could grant exceptions to small businesses, private schools, and certain types of public accommodations. Specification of jury and other procedures, the burden of proof and the like, indicate how much trouble a local official, employer, or school board would be in for violating civil rights.
About 70% of the amendments tried to limit the scope of the Civil Rights Act. For example, McClellan of Arkansas offered an amendment that would have permitted someone to hire, or refuse to hire, someone of a particular race if “this would be beneficial to the normal operation or good will of the establishment.” It failed 30–61. Thurmond of South Carolina offered an amendment that would have exempted those motels that take only intrastate guests from the public accommodations provisions. It failed 21–57.
Thirty percent of the amendments attempted to constrain the enforcement of the Civil Rights Act. Ervin of South Carolina got 34 votes for an amendment to prohibit the attorney general from intervening in all pending civil rights suits. When it failed, Thurmond offered another amendment saying that before the attorney general intervened, the court must issue a ruling that the case was of general public importance. Using the votes on these amendments, we estimated the ideal points of senators in the space spanned by the scope and enforcement dimensions, and the locations of the bills that would have resulted from passage of particular combinations of amendments. In Appendix A, we explain in detail how we set the agenda constraints and estimate the two-dimensional model of the 1964 Civil Rights Act.
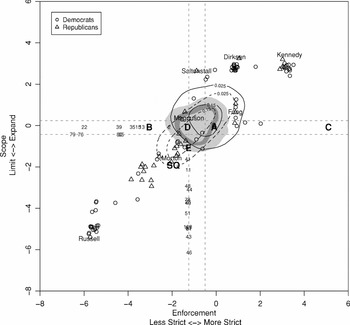
As expected, legislators’ ideal points in these two dimensions are correlated.Footnote 6Figure 3 illustrates how liberal supporters of broad scope tend to favor strict enforcement as well. But the correlation is not perfect. Senator Saltonstall of Massachusetts scored high on scope but earned nearly a zero on enforcement. Senator Fong of Hawaii scored high on enforcement but earned barely a zero on scope. Thus, Senate ideal points were not unidimensional, which would have resulted in an UCS “collapse” to a median senator along that dimension. The size of the UCS revealed the possibility of negotiating over either scope or enforcement to shape the final location of the bill. Historical accounts of the 1964 amendment process regard it a segregationist tantrum (Mann Reference Mann1996, 429). But segregationists engaged in behavior that was observed repeatedly in lab experiments: building coalitions in one dimension or another to pull outcomes away from the majority party cluster of voters—what Riker (Reference Riker1986) called the art of political manipulation.
Figure 3 locates the administration/House bill, “A,” inside the uncovered setFootnote 7—but in a region of the UCS favored by the liberals. Thus, the administration bill seems to have been strategically constructed by being in the UCS, but in a favorable position for the leadership of the civil rights coalition. A covered proposal would not have had much of a chance as illustrates later in the article. The opposition pushed for a jury trial amendment. Segregationists and liberals regarded southern jury trials as a way to prevent a federal judge from requiring compliance with federal court orders on schools, employment, public accommodations, or voting rights. Senator Morton of Kentucky was a strong advocate of a jury trial amendment. When two versions of a jury trial amendment were narrowly defeated on May 6, Morton pressed for some form of the amendment that could get majority support.
At that time, Dirksen began negotiating with the Democratic leadership on amendments to limit the attorney general's power over employment cases in states that had employment discrimination agencies. This would protect states’ autonomous efforts with regard to employment discrimination and reduce uncertainty about the enthusiasm of future administrations for protection of minority employment rights. Dirksen also wanted to bar a U.S. attorney general from intervening in public accommodations. Humphrey and Mansfield joined Dirksen in negotiating a “leadership substitute” to incorporate Dirksen's deference to northern civil rights agencies. Humphrey agreed to portray the newly negotiated amendment as a new form of the bill, introduced by the leaders of both parties as a “substitute” for the administration bill. This maneuver guaranteed Dirksen and the GOP equal credit for the passage of the civil rights bill, while also convincing Republicans that their interests had been fought for.
Many Republican votes came with Dirksen, but conservative Hickenlooper (R-Iowa) demanded a vote on three amendments as the price of his vote for cloture. Russell announced that he would be willing to interrupt the filibuster to allow votes on these three amendments, partly because their passage would make the civil rights bill somewhat less objectionable. One vote engineered by this de facto coalition between Hickenlooper and Russell was another modified version of the Morton amendment. This required a jury trial in contempt cases arising from enforcement of the bill, except in cases of voting rights. It was a significant compromise. It gave segregationists the partial protection of a jury trial, but denied jury trials in the area of voting enforcement that liberals regarded as crucial. Humphrey announced before the vote that if Morton's softer amendment passed it would be added to the leadership substitute bill. On June 9, Morton's amendment passed by a narrow margin of 51–48. In Figure 3, this outcome (“B”) moves the bill to the left of the UCS, representing an improvement for the segregationists. It also guaranteed the vote of Morton and other border state senators for final passage of the bill.
On June 10, supported by Dirksen, Hickenlooper, and most Republicans, the first successful cloture vote on a civil rights bill occurred. The bipartisan vote on cloture was 71–29. Twenty-seven Republicans (all but Goldwater and five others) and 44 Democrats voted to end the debate. As historic as the cloture vote was, it was followed by nine days of “filibuster by amendment.” Russell, the leader of the segregationists, committed to bring up hundreds of amendments that were on the Senate docket.
Right after the cloture vote, Ervin proposed another enforcement-weakening amendment as a second-degree amendment to an amendment by Talmadge of Georgia. Known as a “double jeopardy” amendment, it guaranteed that no one would be found guilty of both civil and criminal contempt of court for violations of the Civil Rights Act. This amendment passed by a narrow margin of 49–48. But Talmadge withdrew his amendment, rendering Ervin's successful second-degree amendment moot.
At this point, the leadership “substitute package bill sponsored by Mansfield, Dirksen, Humphrey, and Minority Whip Thomas H. Kuchel (R-California) was made the pending business . . . all amendments proposed were to this, rather than to the House-passed bill” (CQ Almanac 1964, 369). Shortly after this substitute was called up, Ervin offered another version of the “double jeopardy” amendment as an amendment to the leadership substitute. Humphrey had opposed the earlier version of Ervin's amendment on grounds that it would prohibit the federal government from stepping in if state courts failed to enforce the civil rights bill. Now he reported the results of recent negotiations with Ervin. Speaking of Ervin, Humphrey said, “The Senator may recall that yesterday in a private coneversation I showed concern lest the amendment would involve both State and Federal law, in which instance there might be, let us say, an acquittal under State law . . . thereby barring prosecution under Federal law.” Ervin responded, “The change [in his amendment] is made to overcome the misgivings of the Senator from Minnesota.” The new amendment incorporated the close negotiations that were acceptable to both Erving and Humphrey. Humphrey endorsed the result: “I hope that the Senate will agree to the amendment. I thank the Senator from North Carolina for his forbearance, understanding and cooperation” (Congressional Record 1964, 13444). The most liberal senators would not join this coalition. They believed that it weakened enforcement, but they lost on this occasion as well. Ervin's modified amendment passed 80–16.
This vote allows us to estimate the location of the original leadership substitute (“C”) against the leadership substitute amended by Ervin (“D”). The estimate of the leadership substitute has a wide credible interval, but indicates that it was not a significant weakening of the civil rights bill, as normally argued. It required northerners to take complaints to their state-level equal employment offices first. These offices, however, could be quite strict, so that was not necessarily a weakening of the bill. Passing Ervin's double jeopardy over the opposition of the most liberal supporters of civil rights brought the bill back to the uncovered set, with a much smaller credible interval.Footnote 8
There was also one successful change in the “scope” of the leadership substitute. John Tower (R-Texas), the lone southern Republican, offered an amendment to the leadership substitute protecting the rights of businesses to hire based on ability tests. The amendment failed 38–49 on June 11. Tower introduced the amendment again after negotiations with Humphrey, who said on the floor, “both sides of the aisle who were deeply interested in title VII have examined the text of this amendment and have found it to be in accord with the intent and purpose of that title. I do not think there is any need for a roll call” (Congressional Record 1964, 13724). Again, the opponents of a broader scope of the civil rights bill negotiated a successful coalition, aided by Humphrey, who wanted to make sure he gave no excuse to moderate Republicans to run away from the bill. It moved the scope coordinate of the leadership substitute down (from D to E) but within the UCS. The penultimate vote cast “E”—the final form of the leadership substitute—against “B”, the House bill as amended by Morton. The leadership substitute won handily.
The final vote was between “E” and “no new legislation,” or the SQ. Roll calls on final passage allow us to estimate the perceived location of the SQ: significantly more conservative in scope, but only slightly more conservative on enforcement. The original bill and successful amendment D, as well as the final version of the bill at E, are all estimated to be in the UCS, indicating a true compromise. Aiming to achieve favorable outcomes, legislators on both sides tried to satisfy a majority of senators to pass their proposals by proposing amendments within the UCS. The final outcome was not as strong as the liberal supporters would have liked, but much stronger than the segregationists preferred.
By our estimates, the final form of the bill was closer to a handful of moderates, such as Church (D-Idaho) or Miller (R-Iowa), than to the cluster of liberals surrounding the leadership in the upper right-hand corner of Figure 3. Proposals wandered off the UCS, but as suggested by the “two steps” agenda argument by Shepsle and Weignast (Reference Shepsle and Weingast1984), legislative coalitions were always able to pull the final outcome of the legislative process back to within the UCS.
The final bill “E” is at the center of the SMC, but the passage of the Civil Rights Act is inconsistent with the theory of an SMC. By definition, SMC is a set of points that cannot be beaten, so the movement within the SMC is inconsistent with the theory. Once the process leads to a point within the SMC, no further movement is expected on the floor because no point should defeat a point inside the SMC. Although the filibuster shaped negotiation processes leading up to the cloture vote, once cloture had passed, the final shape of the legislation was shaped by simple majority coalitions.
The final outcome is clearly at the center of the UCS of the floor and at the extreme margin of the MPUCS.Footnote 9 The floor UCS seems to have advantage over the majority UCS, even if the outcome is technically at the intersection between the UCS of the floor and MPUCS. The negotiation among northern Democrats and Republicans seems, as well as the constant clash of interests between northern and southern Democrats, seem to be inconsistent with the theory of party government. Nevertheless, theory does not indicate that marginal points in the UCS are less likely than central UCS points. Thus, based strictly on theory and observation, we cannot rule either one out in this case.
The Voting Rights Act of 1965
Events in Selma, Alabama, in early 1965, convinced the public that the 1964 Civil Rights Act was insufficient to guarantee African-American voting rights in the South. Media coverage showed lines of patient African-American citizens, attempting to register to vote, being stalled, punched, and shocked with electric cattle prods. One local young man was shot by police during a nighttime protest, resulting in a determination by the civil rights leaders to march from Selma to the state capital in Montgomery. Wholesale violence on the part of the sheriff's deputies and state police stopped the marchers on their first attempt to cross the Pettus Bridge on the way out of Selma. Film caught the violence against peaceful marchers, and television networks interrupted Judgment at Nuremburg to show the violence to the nation.
Speaking before both houses of Congress, President Johnson requested a strong bill to allow federal registrars to register voters in key southern states. The thrust of the bill was that disenfranchised voters no longer had to wait, suffering economic sanctions and violence, for slow and uncertain judicial remedies. The election of the previous year had punished northern legislators who opposed the Civil Rights Act and had strengthened the civil rights coalition in Congress. Cloture on the voting rights legislation was virtually assured at the start, and any southern filibuster was doomed. In fact, cloture was voted by almost the same margin as the previous year. Southern senators, however, did not give up on their rear-guard attempt to minimize the scope and enforcement of the new bill. Amendments were offered to limit or expand the scope of federal involvement or enforcement. The Senate sent the administration bill to the Judiciary Committee, but with a limit of 15 days for study and hearings, at which time the bill had to be reported back. This mandate prevented the head of the Judiciary Committee, Senator Eastland, from exercising a virtual veto by tabling the bill. It was reported on April 9 by a 12–4 vote.
Due to the efforts of liberals encouraged by the recent election results, the committee had actually expanded the scope of the bill by outlawing the state poll tax. A national poll tax had been eliminated three years earlier by constitutional amendment. The state poll tax provision immediately became a source of division among the supporters of the Voting Rights Act. Dirksen, in particular, believed that a legislative prohibition on a state poll tax was unconstitutional and endangered the constitutionality of the rest of the bill. The administration agreed with Dirksen and feared that doubts about the poll tax could actually result in the failure of the bill. However, leading liberals, such as Robert F. Kennedy, were eager to use the proposed Voting Rights Act to ban the poll tax, and offered amendments designed to further that goal. Of the 19 amendments voted on, 12 had to do with the poll tax or other aspects of the scope and trigger for federal intervention in the registration and voting process.
The second dimension of amendments was court jurisdiction. The bill specified that if a state or locality objected to the voting registrars operating in its jurisdiction, it could only appeal to a three-judge federal district court in the District of Columbia. This court, known as liberal on civil rights, would be the only court to issue restraining orders or injunctions against action taken under the Voting Rights Act.
On April 20, Dirksen and the administration introduced a leadership substitute on the poll tax. “The Mansfield-Dirksen substitute became the pending business of the Senate on April 30 as a proposed amendment to the amended version of S. 1564 that was reported by the Judiciary Committee. The Mansfield-Dirksen amendment was open to further amendments, which would be voted upon first. These further amendments would be disposed of before the Mansfield-Dirksen amendment was voted on” (CQ Almanac 1965, 548). This substitute became the “basic bill” to which all amendments were added.
All roll call votes after April 30, except noncontroversial voice votes that we ignore, were pitted against the leadership substitute. The first amendment addressed the trigger for federal intervention. Ervin proposed replacing the automatic trigger, the heart of the bill, with court action; liberals objected that court action was ineffective at stopping violations of rights in a timely way and that a trigger based on a record of voting suppression was essential. The Ervin amendment failed.
Newly elected Robert F. Kennedy proposed a ban on all poll taxes. It would have significantly expanded the scope of the bill, but it failed by a close vote of 45–49. Ervin proposed an amendment to remove the exclusive jurisdiction of the District of Columbia court, knowing that other federal courts in the South were much less liberal. This was rejected 28–62, demonstrating a healthy minority willing to weaken the court enforcement of the bill. Senator Prouhy of Vermont, one of few northern states with a poll tax, tried to ensure that a prohibition was not directed against his state. His amendment failed 33–44.
Segregationists and liberals tried to introduce changes at the margins of the scope or enforcement dimensions. Southern senators offered amendments to attract those less liberal on one dimension or another. Conservatives did not have the votes to pull the bill diagonally toward their ideal points. Instead, authors of the amendments tried to build coalitions to include moderates on one dimension or the other, in coalition with the conservatives. John Tower offered to substitute the triggering formula for federal intervention based on literacy with a weaker trigger that would allow rejected potential voters to complain to the attorney general. They hoped that this might pass with the support of senators such as Morton (R-Kentucky), who were willing to weaken the scope of the bill but were more pro–civil rights on enforcement.
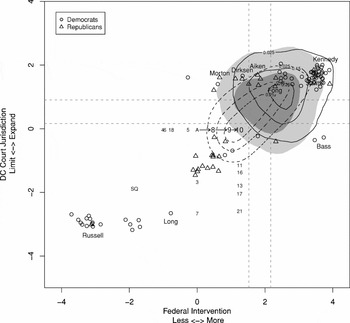
Out of a concern that opponents use the poll tax to divide the support for the bill, Majority Leader Mansfield offered, on May 19, a symbolic amendment to add a nonbinding declaration of the Senate's opposition to the poll tax. It passed 69–20 (“8” in Figure 4). Fong (R-Hawaii) offered an extension of federal intervention with an amendment for poll watchers in districts where federal registrars would be assigned. It passed 56–25 (“9”). Senators Kennedy (D-New York) and Javits (R-New York) proposed an amendment to make a sixth-grade education in any language satisfy the literacy requirement. It passed, 48–19 (“10”).
Voting Rights Act of 1965

Opponents submitted thirteen amendments, but the majority support of the bill held firm. On May 26, the Mansfield-Dirksen substitute, with only a symbolic stand against the poll tax, was paired against the committee-recommended bill and passed. Vote on final passage followed. In the perceptions of the senators, the SQ generated by the Civil Rights Act of 1964, was regarded as a rather conservative reality by 1965. Compared to 1964, a larger majority of the senators had more liberal ideal points on both scope and enforcement than the SQ. Nevertheless, and despite the stronger support for radical civil rights legislation in 1965, the final outcome was not a decisive move to the cluster of liberal ideal points.
In 1965, the UCS was closer to the liberals than to the southerners, but was again located in an area with few ideal points. This makes it all the more striking that the final outcome of the bill is located well within the floor's UCS and clearly outside the UCS of the liberal majority. Even though the leaders had considerable support, they knew that any extreme measure could be pulled apart and defeated by the opponents. This concern caused them to offer a more moderate version of the bill than they might have preferred. The floor UCS was a moderate position that was simultaneously able to withstand Southern attempts to weaken the bill and strengthening amendments by Robert Kennedy and allies.
In 1965, the floor UCS clearly proved to be a better predictor than the MPUCS. Although the final outcome is again right in the middle of the SMC, the multiple movements during the legislative process within the SMC militates against adopting it as the preferred solution concept because such movements are inconsistent with the basic definition of what the SMC stands for as a solution concept.
Reauthorization of the Elementary and Secondary Education Act (1974)
In 1965, President Johnson signed the historic Elementary and Secondary Education Act, allowing an unprecedented federal funding to local education. In 1974, the bill was due for reauthorization in a different environment. A backlash to the Great Society initiatives and to civil rights, in particular, set in. The passage of the Civil Rights Act and the Voting Right Act identified the Democrats as the civil rights party. The southern strategy of Goldwater and Nixon identified the Republicans as the conservative party. After Wallace's success in the 1972 Florida Democratic primary with an antibusing plank, Nixon moved against busing.
The Democrats controlled Congress, but Nixon won the White House twice with a “law and order” campaign that borrowed liberally from the Wallace campaigns. Weakened by Watergate, Nixon hoped to rally Republicans by his continued opposition to busing. The Republicans were more homogeneously conservative in 1975, and the Democrats more homogeneously liberal, than was the case in 1965.
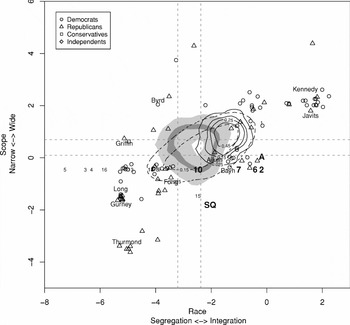
The scope of federal aid to education was a controversial issue behind the reauthorization of the education bill. Busing became the other issue. Estimating the ideal points of senators, Figure 5 shows that the degree of correlation between busing and scope of aid was very small, reflecting the orthogonality of the old New Deal party divide with the emerging cultural divide between parties. Robert Byrd, for example, scored highest on “scope,” but earned a markedly negative score on the race dimension. Democrat Frank Church was liberal on the race dimension, but conservative on the scope of federal aid. Amendment activity was intense, involving a variety of coalitions. Only one proposed amendment successfully changed the scope of the bill—a vote that accepted the House formula for allocating funds to schools (“2” in Figure 5). This was a modest move in the conservative direction on that dimension.
Elementary and Secondary Education Reauthorization of 1974

The most controversial antibusing amendment was Gurney's amendment (“4”) to prohibit busing. Senator Bayh (D-Indiana) attempted to replace the Gurney amendment with a somewhat more moderate second-degree substitute. The Senate voted it down 9–84 as a replacement for Gurney. By the defeat of the Bayh amendment, the Gurney amendment was still alive. Liberal Republican Javits moved to table the Gurney amendment, which passed 47–46, effectively killing it. Then Bayh resubmitted his more centrist amendment (“6”). When voted on as a first-degree amendment rather than as a substitute for the Gurney amendment, a majority of the senators did not approve the movement from the Gurney (“4”) to the Bayh amendment (“6”). However, now a majority approved the movement from the bill with no restrictions on busing (“2”) to the Bayh amendment. Clearly, conservatives who had opposed Bayh before now voted for it when it was the only antibusing amendment left. The Bayh amendment was adopted 56–36.
Senator Griffin (D-Michigan) offered an amendment, more conservative than Bayh's but less conservative than Gurney's. It was similar to Gurney's except that it did not allow for a controversial reopening of court cases, as did Gurney's amendment. Griffin's amendment (“8”) was not as racially conservative as Gurney's. Javits’ motion to table the Griffin amendment failed in a close vote: 46–47. A compromise was offered by both majority and minority leaders, saying that busing would not be allowed to more distant schools than those in the next closest district. Griffin, hoping that his more conservative version would pass, offered a vote to table the leadership compromise, but it failed 45–48. The vote to adopt the leadership compromise (“10”) passed 47–46. The leadership compromise became the final outcome, located on the lower edge of the UCS. Antibusing forces were strong that year, and the final outcome after all that maneuvering was right on the median voter in the busing dimension. The final outcome in the “scope” dimension was somewhat more conservative than the median, which accounts for the outcome being on the lower edge of the UCS. The perception of the no-legislation SQ is that it was more prointegration than the final outcome. Compared to the SQ, the bill had made a concession on the race dimension, in exchange for a wider scope of federal aid to education.
Again, to reach an outcome well inside the edge of the floor UCS, a compromise was necessary, clearly manifest in the maneuvering over busing in the charged environment of 1974. It is striking that even in this highly charged antibusing environment, the UCS still “exercises” the power of constraining the set of enactable outcomes. The SMC would be slightly more appealing in this case because all the moves seem to lead to the SMC, but again, theory is mute about moves outside the core even if they seem to be in the “right direction.” The final outcome is clearly outside the MPUCS.
DISCUSSION AND CONCLUDING REMARKS
The final outcome of a legislative fight is often phrased as a dramatic victory of one side over the other. We seem to like the drama of winners and losers, as in a sports contest, but that is not the reality that is revealed in our analysis. If the liberals in support of the 1964 bill were the “winners”, then the final outcome should have been located in the large cluster of ideal points estimated for those liberals. More precisely, it should have resided in the MPUCS. This seems to be the best operational statement we could find for the party government hypothesis of Cox and McCubbins (Reference Cox and McCubbins1993; cf. Aldrich and Rohde, Reference Aldrich, Rohde, Dodd and Oppenheimer2001). In contrast, the floor UCS is typically located at a relatively “uninhabited” space between clusters of voters. As a result, an outcome in the UCS more accurately indicates the selection of a compromise outcome, no matter who the historians label “winners.”
Our examination of the 1957 Civil Rights Act is more consistent with the party government hypothesis because the final outcome was spatially closer to the location of the majority party median than the floor median even if the mechanism of the party influence was through arm twisting by the majority leader rather than agenda control. However, in the three two-dimensional cases—the 1964 Civil Rights Act, the 1965 Voting Rights Act, and the 1974 Reauthorization of the Elementary and Secondary Education Act—the floor UCS is clearly a better heuristic when it comes to predict and comprehend the dynamics of the legislative process that led to these historic bills. In all three cases, the final outcome ended up in the floor UCS and, if anything, “tilted” in the direction of those who were historically labeled as “losers.” This was clearly the case in 1974, but even in 1964, the defeated segregationists seem to have been skillful enough to keep the outcome on “their side” of the UCS.
More generally, we developed a conceptual framework and illustrated methodological measurement tools to expand the usefulness of the spatial theory of legislative behavior and support its relevance in the analysis of the succession of votes regarding four major legislations in the U.S. Senate. In all four cases, we illustrated both the power of the measurement tool to estimate locations of legislative outcomes and the predictive and explanatory power of the UCS as a solution concept. We believe these finding are very encouraging, not to say, striking.
Furthermore, there are regularities that begin to show in our research that we would like to pursue further.Footnote 10 The conjectures we begin to establish need further verification. Our research so far seems to bear important implications to different current frontier research topics in the discipline, such as party government, minority leverage in legislative processes, and, again, the heresthetics of legislative politics.
Another contribution of the article is to point at the shifting party coalitions on civil rights over time. (Miller and Schofield, Reference Miller and Schofield2003) Coming out of the New Deal, a conservative coalition of Republicans and southern Democrats was regarded as a major obstacle to the liberal agenda of northern Democrats. Introducing a racial dimension to housing or education bills could mobilize a conservative coalition to defeat any northern Democratic agenda. The conservative coalition disappeared for two years, in the face of unprecedented levels of support for civil rights legislation in the aftermath of JFK's assassination. The southern Democrats saw their erstwhile copartisans taking the lead on legislation that southerners had fought for a century. After 1965, the Republican/northern Democratic coalition that had sustained the civil rights accomplishments for two years broke up in response to a backlash to riots and the Great Society legislation that Lyndon B. Johnson passed that year. Strom Thurmond's conversion to the GOP in September 1964, marked the beginnings of republicanization of the South, and the re-creation of the conservative coalition as Nixon's southern strategy. By the time of the 1974 education bill, Republicans had become the spokesmen for that backlash as present in the debate over busing in that legislation.
The purpose of the article is not to perform a systematic test regarding partisan shift. But it does speak to the uniqueness of the 1964 and 1965 bills. They are of interest in part because of the uniqueness of the coalitional pattern in a short window. It is interesting to speculate what would have happened if that particular coalition had not passed those two particular bills in the short window of time between JFK's assassination in November 1963, and the Los Angeles riot in August 1965.
APPENDIX A: AGENDA CONSTRAINTS IN A TWO-DIMENSIONAL SPACE OF THE 1964 CIVIL RIGHTS ACT
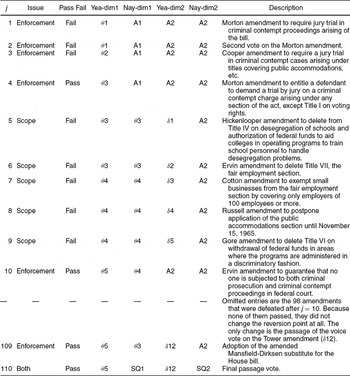
There are four bill parameters per vote in a two-dimensional space because yea and nay locations must be defined in both dimensions. Thus, in the 110 votes of the Civil Rights Act of 1964, the total number of bill parameters is 440. We reduce the number of bill parameters by using agenda information, but this is insufficient to identify the model. To overcome this challenge, we use substantive information to determine to which dimension each amendment may speak. As shown in Table A1, each of the amendments on the Civil Rights Act of 1964 is related to either enforcement or scope. Combining the substantive and agenda information, we reduce the number of bill parameters to identify the model.
Agenda Constraints on Roll Call Votes on Civil Rights Act of 1964

For example, the first vote was related to the enforcement dimension (d1). Thus, the yea and nay locations on the scope dimension (d2) for this vote are the same (A2). On the enforcement dimension, the yea location of this vote is the Morton amendment (θ1), and the nay location is the administration or the House bill, as introduced on the Senate floor (A1). Because this amendment did not pass, the administration bill (A1) remained the reversion point on the enforcement dimension until an amendment passed in the 4th vote, changing the reversion point on the enforcement dimension to θ3. The reversion point on the enforcement dimension changed to the Mansfield-Dirksen substitute (θ4) without a roll call vote just before the 7th vote. This was modified by the 10th vote, that amended the location of the substitute to θ5. Eventually, this became the location of the final outcome in the enforcement dimension. An amendment offered by John Tower (δ12) changed the scope dimension by guaranteeing that businesses could use ability tests in their personnel decisions. This changed the leadership substitute from D to E at 40th vote. Thus, the yea location of the final passage vote is defined by θ5 and δ12. The nay location denotes the status quo (SQ) with no new civil rights act (SQ1, SQ2). We set the location of the administration bill at (0,0) and that of the SQ at (–2,–2) so that any positive location denotes support for a stronger civil rights act. Two more parameters need to be fixed to identify the model (Rivers Reference Rivers2003), but to avoid making additional assumptions we postprocessed the Markov chains after chains became stationary.
APPENDIX B: IDENTIFICATION OF THE MODEL WITH THE SENSITIVITY PARAMETER (β)
In this appendix, we show that the model is identified with the use of agenda information, even when a sensitivity parameter (β) is introduced. For simplicity, we transform Equation (2) into the following:

where Ci represents the cutpoint of vote j (Yj + Nj)/2. Consider a case of three votes. The first two are successful amendments to table. A yea vote on the first two roll calls is a vote for the same motion on the floor. A third vote for final passage is in favor of the same outcome (Y1 = Y2 = Y3). Holding ideal points X and cutpoints C1, C2, C3 fixed, there are four remaining quantities to identify: β, Y1 − N1, Y2 − N2, and Y3 − N3. We have four quantities to identify and six constraints:
(1) Pr(Z1 = 1) = Λ [2β (Y1 − N1)(X − C1)]
(2) Pr(Z2 = 1) = Λ [2β (Y2 − N2)(X − C2)]
(3) Pr(Z3 = 1) = Λ [2β(Y3 − N3)(X − C3)]
(4) (Y3 − N3)/2 − (Y2 − N2)/2 = (C3 − C2)
(5) (Y3 − N3)/2 − (Y1 − N1)/2 = (C3 − C1)
(6) (Y2 − N2)/2 − (Y1 − N1)/2 = (C2 − C1)
Constraint (4) comes from the identification of Y3 = Y2. Constraint (5) comes from the identification of Y3 = Y1. Constraint (6) comes from the identification of Y2 = Y1. In this case, constraints (1), (2), and (6) can be used to yield an estimate of β in terms of the cutpoints and ideal points. Constraints (1), (3), and (5) can be used to do the same; but in general, the estimate need not be consistent. And (2), (3), and (4) may yield a fourth estimate of β. β is, in this case, overidentified.
We estimate β with reasonable restrictions and find that when β is larger than 1, we get estimates inconsistent with the set of preferences. Substantively, it makes sense to assume 0 ≤ β ≤ 1 because 1 < β means that legislators are overly sensitive to spatial differences of alternatives. Thus, we set β as a free parameter with a uniform distribution (0, 1) assigned as a prior distribution. With this prior distribution, the results are consistent with voting patterns. A best-fitting β for the 1964 and 1965 bills was approximately .5, whereas it was close to 1 for the 1974 bill.



Comments
No Comments have been published for this article.