


1 Introduction
The compressible transonic flow of steam around blades and airfoils operating in internal flow systems has widespread industrial applications such as flows in steam turbines used for power/electricity generation and marine propulsion, injectors used for oil and gas drilling, shock tubes, rocket motors, energy harvesting in waste plants and production of pharmaceuticals. The operating conditions of typical designs are characterized by high pressures and temperatures where the steam is superheated and dry, avoiding the appearance of any condensation phenomena. However, at operational thermodynamic conditions closer to the vapour–liquid saturation dome, the rapid expansion of pure vapours typical of high-speed flows over curved surfaces may result in flow regions with homogeneous condensation. The nucleation process adds heat to the flow and thereby alters the flow and thermodynamic properties. The heat release to the flow changes the distribution of pressure around the airfoil and can have a substantial effect on its aerodynamic performance. The appearance of condensation over a typical airfoil increases the wave drag. However, at certain operational conditions, condensation phenomena in humid air flow over a circular arc airfoil can decrease the strength and size of shock waves, and thereby reduce the wave drag and increase the lift to drag ratio of the airfoil (Schnerr & Dohrmann Reference Schnerr and Dohrmann1990, Reference Schnerr and Dohrmann1994). Quantifying these effects through theoretical modelling coupled with numerical studies may help in understanding the flow physics and in designing operational conditions or new airfoil/nozzle shapes with improved aerodynamic performance.
Among the first experimental investigations of condensation in high-speed flows in wind tunnels were the studies by Head (Reference Head1949) and Schmidt (Reference Schmidt1966). Head (Reference Head1949) performed investigations on humid air flow in supersonic wind tunnels and found that, under certain operational conditions, the water vapour could reach a highly supersaturated state with a supersaturation ratio  $S$ (
 $=p/p_{g}(T)$ where
 $p$ is the vapour pressure and
 $p_{g}(T)$ is the saturation vapour pressure at flow temperature
 $T$) much above one before condensation is initiated. Schmidt (Reference Schmidt1966) performed density measurements in humid air flows over circular arc airfoils inside choked tunnels to study the effect of changing upstream relative humidity. It was observed that increasing the relative humidity level caused the shock wave to move upstream and its intensity decreased. Moore et al. (Reference Moore, Walters, Crane and Davidson1973) experimentally studied steam flows with condensation in low pressure nozzles and compared them with theoretical predictions according to various nucleation theories. Bakhtar & Zidi (Reference Bakhtar and Zidi1989) extended the experiments to non-equilibrium condensation in high pressure wet steam flows through converging–diverging nozzles. They determined axial pressure distributions and droplet sizes in terms of rates of expansion of flow in the nozzles. Wegener (Reference Wegener1975) suggested that the condensation may follow one of the two likely processes. The first kind is equilibrium condensation, which is characteristic of flows that possess many foreign nuclei to support nucleation. The second kind is non-equilibrium and homogeneous condensation, which typically occurs during rapid expansion of pure vapour flows. In this paper, we focus on the latter case of condensation processes in pure steam flows.
Wegener & Mack (Reference Wegener and Mack1958) investigated the condensation process of pure water vapour in humid air flow and were the first to explore changes in shock wave states in supersonic wind tunnels due to condensation heat release. Similarity laws for the condensation onset Mach number were formulated by Zierep (Reference Zierep1965) and Zierep & Lin (Reference Zierep and Lin1967). Zierep (Reference Zierep1969) devised a small-disturbance asymptotic model with a given heat energy term to model condensation heat addition. He also found that, if the heat input exceeded a critical limit, no steady state solution could be achieved by the model. Hill (Reference Hill1966) compared experimental results of condensation in moist air and pure steam flows through supersonic nozzles with classical nucleation and droplet growth theory. Good agreement between the two was found when surface tension of liquid droplets was assumed to be independent of curvature.
Steady transonic flows of humid air over airfoils with homogeneous condensation have been studied theoretically and experimentally by Schnerr & Dohrmann (Reference Schnerr and Dohrmann1990) and Schnerr (Reference Schnerr1993). Schnerr & Dohrmann (Reference Schnerr and Dohrmann1990) used numerical simulations and experiments to study the effects of non-equilibrium and homogeneous condensation on pressure drag of symmetrical two-dimensional airfoils. The thermodynamic behaviour of the flow was described by the perfect-gas model which is relevant for atmospheric flow conditions. The inviscid flow equations coupled with a classical nucleation model for condensation were solved by an explicit finite-volume method. The airfoil geometry was found to have an important influence on the pressure drag coefficient with variation of relative humidity of upstream flow. In non-lifting flows over circular arc airfoils at certain constant upstream conditions of stagnation temperature and pressure, the shock wave shifted upstream along the airfoil chord towards the leading edge with increase of upstream relative humidity, thereby resulting in a significant decrease of the wave drag by a maximum of approximately 35 %. However, when upstream flow relative humidity rises above  ${\sim}50\,\%$, the high amount of resulting condensation splits the shock wave into a system of two shock waves, thereby reversing the drag behaviour and causing an increase of the wave drag. For same upstream conditions of stagnation temperature and pressure of non-lifting flow around a round-nosed NACA0012 airfoil, the movement of shock wave with increasing upstream relative humidity was similar to that of circular arc airfoils, but the pressure drag stays almost constant with the increase of upstream relative humidity up to 30 %, after which it continuously increases with increasing upstream relative humidity.
Schnerr (Reference Schnerr1993) investigated in experiments and numerical simulations, effects of phase transition of fluid (with low amounts of heat supply) in transonic compressible flow of vapour/carrier gas mixtures in atmospheric flight and through indraft wind tunnels. The governing parameters of the flow were changed to study non-equilibrium condensation as well as equilibrium condensation. In indraft wind tunnels, lift was observed to decrease with condensation and pressure drag could increase or decrease depending on the free-stream Mach number and angle of attack. Non-lifting flow of humid air over a circular arc airfoil at constant upstream thermodynamic conditions showed a decrease in pressure drag of  ${\sim}40\,\%$ for certain Mach numbers. Changing the airfoil shape was found to significantly affect the pressure distribution and consequently the pressure drag at similar operating conditions. Increasing the angle of attack for a NACA0012 airfoil from
 $0^{\circ }$ to
 $1.25^{\circ }$ at certain constant upstream thermodynamic conditions and a constant free-stream Mach number (
 $=0.8$) showed a decrease in lift of approximately 30 % whereas the pressure drag was found to decrease by less than 5 %.
In addition, Schnerr & Dohrmann (Reference Schnerr and Dohrmann1994) studied the difference between transonic flows with either equilibrium or non-equilibrium condensation around airfoils for various angles of attack. Non-equilibrium and homogeneous condensation was found to produce, in certain cases, a decrease in pressure drag of  ${\sim}21\,\%$ and a decrease in lift of 35 %. In other cases, depending on the angle of attack, the pressure drag increased.
Rusak & Lee (Reference Rusak and Lee2000a) studied steady, transonic, inviscid and condensing flow of humid air at low pressures and at low temperatures around a thin airfoil. A small-disturbance model was formulated to describe the flow and condensation fields. The fluid thermodynamic behaviour was modelled by a perfect-gas equation of state and classical theory of nucleation and droplet growth modelled the homogeneous condensation process. The asymptotic theory identified a set of governing similarity parameters of the flow. Numerical results according to the small-disturbance model agreed well with numerical computations of Schnerr & Dohrmann (Reference Schnerr and Dohrmann1990). Lee & Rusak (Reference Lee and Rusak2000) conducted a parametric investigation to better understand the effects of varying these similarity parameters independently. They noticed that when the upstream Mach number was increased at fixed values of upstream temperature and pressure or the upstream temperature was increased at fixed values of upstream pressure and Mach number, condensation increased and the strength of the shock waves decreased. Reduction in shock wave strength has been found to be linked with reduction in wave drag coefficient.
Yamamoto (Reference Yamamoto2005) numerically studied high-speed flows of humid air around NACA0012 airfoils at atmospheric flow conditions with condensation. Classical nucleation theory was used to model homogeneous condensation whereas heterogeneous nucleation was approximated by an assumption of constant number density and constant radius of droplets. Heterogeneous condensation showed more downstream movement of the shock on the suction surface of the airfoil compared to flow assuming homogeneous condensation. Hence, the assumption of heterogeneous condensation was concluded to be vital when studying external flows around airfoils or wings. Internal steam flows through turbine cascades were also investigated and it was observed that the efficiency of the turbine decreased with homogeneous condensation and, hence, it becomes important to include condensation in studies to make a more accurate prediction of system behaviour.
More recently, Hamidi & Kermani (Reference Hamidi and Kermani2015) numerically studied non-equilibrium and homogeneous condensation in transonic flows of humid air and of pure steam through converging–diverging nozzles. They found that at similar flow conditions for water vapour, the droplet nucleation rate and wetness fraction in the nozzle for humid air flow were greater than those for pure steam flow. Their simulation results show agreement with Moore et al. (Reference Moore, Walters, Crane and Davidson1973). Virk & Rusak (Reference Virk and Rusak2019) have recently derived a theoretical asymptotic model to describe pure steam flow around a thin airfoil with non-equilibrium and homogeneous condensation. Perfect-gas equation of state described the thermodynamic behaviour of steam, which limited the applicability of the model to relatively low pressure and temperature conditions,  $p\leqslant 3$ bar and
 $T\leqslant 400~\text{K}$.
In the current study, a small-disturbance model is developed to investigate the steady transonic flow of water vapour (steam) around a thin airfoil with non-equilibrium and homogeneous condensation. The water vapour is assumed to be pure (free of foreign nuclei). The thermodynamic properties of the steam are modelled according to the van der Waals gas model (Moran et al. Reference Moran, Shapiro, Boettner and Bailey2014). This model accounts for real-gas effects such as intermolecular forces in the fluid and finite size of the molecules that affect the thermodynamic behaviour of steam, especially at relevant operating conditions of high pressures (up to 1.5 MPa), high temperatures (up to 450 K) and near the vapour–liquid saturation conditions (where  $S\sim 1$ or slightly greater than 1). In the current study, the van der Waals gas model provides the density and specific enthalpy of water vapour. A brief comparison with the more accurate International Association for the Properties of Water and Steam Industrial Formulation 1997 (IAPWS IF-97) (Wagner & Kretzschmar Reference Wagner and Kretzschmar2007), reveals that at a temperature of 450 K and a pressure of 1.5 MPa, the percentage difference between the densities of water vapour from the van der Waals gas model and IAPWS IF-97 is 3 % and from the ideal-gas model and IAPWS IF-97 is 6 %. The percentage difference between the specific enthalpies of water vapour from the van der Waals gas model and IAPWS IF-97 is 11 % and from ideal-gas model and IAPWS IF-97 is 15 %. Therefore, it is appropriate to describe the thermodynamic behaviour of water vapour under specified conditions by the van der Waals gas model. Also, under these circumstances, non-equilibrium and homogeneous condensation may be the dominant mode of condensation and can be accurately described by the condensation models of Wegener & Mack (Reference Wegener and Mack1958) and Hill (Reference Hill1966). Limited experimental and theoretical studies have investigated this flow problem, and a model that simplifies the governing equations of flow and condensation may help in understanding the complex interactions of flow and condensation of steam at a wide range of operating pressure and temperature conditions. The advantage of the analytical treatment is a set of similarity parameters which provide detailed insight into the physical nature of the problem and its dependence on variations of aerodynamic and thermodynamic parameters.
The current theoretical small-disturbance model is relevant to a two-dimensional, inviscid and steady water vapour flow at transonic speed around a thin airfoil characterized by a small thickness ratio ( $0<\unicode[STIX]{x1D716}\leqslant 0.14$), a small curvature (with maximum camber ratio
 ${<}$0.04) and at a small angle of attack (with
 $|\unicode[STIX]{x1D703}|\leqslant 6^{\circ }$). The upstream flow conditions lie close to the vapour–liquid saturation conditions and the flow experiences a small amount of condensate generation. Past experimental studies have shown that large amounts of condensation can lead to unsteadiness and flow instabilities. Upstream flow conditions beyond the specified limits could also result in the appearance of three-dimensional or transient flow structures which the model might not be able to suitably describe. Furthermore, the model explores only heat energy interactions between the vapour and the condensate along a streamline and assumes that no momentum exchange occurs between the two phases. For all the numerical computations, the maximum droplet size was computed to be below
 $10~\unicode[STIX]{x03BC}\text{m}$ which is much smaller than the size of a fluid element
 $(O(30~\unicode[STIX]{x03BC}\text{m}))$. Hence, the fluid element essentially carries the condensate along at the same velocity as the surrounding vapour with the condensate staying inside the fluid element at all times and consequently no shear forces are generated between the two phases.
The current model considers the curvature of the airfoil surface to be the primary source of perturbations to the uniform stream properties and ignores effects of surface roughness or impurities of the airfoil surface on the flow and condensation fields. Furthermore, it is assumed that there is no heat or mass exchange between the condensing flow and the airfoil surface. The velocity fluctuations caused by acceleration of the flow along the airfoil geometry primarily initiate the homogeneous nucleation process. This base model effectively describes the fundamental yet complex nature of pure water vapour flow through nozzles or around thin airfoils. The simplified model also serves as the first step towards the derivation of a more comprehensive theoretical model which includes the effects of viscosity, turbulence, surface energy and roughness of the airfoil, among others, on the flow and condensation dynamics. The solution of the current model could serve as an initial condition for solution of the comprehensive model.
An outline of this paper is described next. Section 2 describes the flow problem and develops a mathematical model to describe it. Section 3 presents a detailed derivation of the asymptotic small-disturbance model. Section 4 describes the numerical scheme applied for solution of the asymptotic model. Section 5 presents studies focused on grid convergence and parametric investigations. The model helps in investigating the effects of condensation on steam flow around airfoils operating at relatively high pressures and temperatures and near the vapour–liquid saturation line.
2 Mathematical model of the flow problem
A steady, two-dimensional, transonic, compressible and inviscid stream of pure water vapour flowing around a thin airfoil is considered, as depicted in figure 1. In this figure, the axial ( $x$) axis measures distance from the leading edge of the airfoil along the free-stream direction whereas the transverse (
 $y$) axis measures distance perpendicular to the
 $x$ axis. Far upstream of the airfoil, the pressure, temperature and velocity profiles are assumed to be uniform and dry (i.e. devoid of any liquid or solid condensate) i.e. the upstream flow conditions are given by the upstream pressure
 $p_{\infty }$, upstream temperature
 $T_{\infty }$ and upstream axial flow velocity
 $U_{\infty }$ with no transverse velocity. Upstream flow supersaturation ratio is
 $S_{\infty }=p_{\infty }/p_{g}(T_{\infty })$ and is taken to be slightly above 1 to ensure dry vapour without pre-existing condensate ahead of the airfoil. The upstream flow Mach number is
 $M_{\infty }=U_{\infty }/a_{\infty }$ (here
 $a_{\infty }$ is the isentropic frozen speed of sound in water vapour at the given temperature and pressure). Also, let
 $c$ be the chord length of the airfoil and
 $\unicode[STIX]{x1D703}$ be the small angle of attack between an axis along the chord of the airfoil and the upstream flow direction. The geometric shape of the airfoil is given as
 $$\begin{eqnarray}{\mathcal{S}}(\bar{x},{\tilde{y}})=\bar{y}-\unicode[STIX]{x1D716}F_{u,l}(\bar{x})=0,\quad 0\leqslant \bar{x}\leqslant 1,\end{eqnarray}$$
where  $\unicode[STIX]{x1D716}$ is the thickness ratio (
 $0<\unicode[STIX]{x1D716}\ll 1$),
 $\bar{y}=y/c$ and
 $\bar{x}=x/c$. Also,
 $F_{u,l}(\bar{x})$ correspond to the upper and lower surfaces of the airfoil, respectively and are described as
 $$\begin{eqnarray}F_{u}(\bar{x})=C_{a}(\bar{x})+t(\bar{x})-\unicode[STIX]{x1D6E9}\bar{x},\quad F_{l}(\bar{x})=C_{a}(\bar{x})-t(\bar{x})-\unicode[STIX]{x1D6E9}\bar{x},\quad 0\leqslant \bar{x}\leqslant 1.\end{eqnarray}$$
Here  $t(\bar{x})$ and
 $C_{a}(\bar{x})$ are functions that provide the thickness and camber along the airfoil chord,
 $\unicode[STIX]{x1D6E9}=\unicode[STIX]{x1D703}/\unicode[STIX]{x1D716}$ and the airfoil is characterized by a sharp trailing edge.
Flow problem.

The density of a characteristic fluid element can be defined as the sum of partial densities of the vapour and liquid phases of water contained in the fluid element, i.e.  $\unicode[STIX]{x1D70C}=\unicode[STIX]{x1D70C}_{v}+\unicode[STIX]{x1D70C}_{l}$. The partial density of a phase is the ratio of mass of the particular phase to the volume of the fluid element. In regions with no condensate formation,
 $\unicode[STIX]{x1D70C}_{l}=0$ and the fluid element density is simply the water vapour density. The condensate mass fraction is a measure of condensation and is defined as
 $g=\unicode[STIX]{x1D70C}_{l}/\unicode[STIX]{x1D70C}$. At the upstream conditions,
 $g_{\infty }=0$. Then,
 $\unicode[STIX]{x1D70C}_{v}=\unicode[STIX]{x1D70C}(1-g)$. Also, let
 $p$,
 $T$,
 $u$ and
 $v$ represent the local vapour pressure, local fluid temperature and the axial and transverse velocity components, respectively. The compressible flow field of steam can be described by the equations of balance of mass, momentum and energy,
 $$\begin{eqnarray}\displaystyle & \displaystyle (\unicode[STIX]{x1D70C}u)_{x}+(\unicode[STIX]{x1D70C}v)_{y}=0, & \displaystyle\end{eqnarray}$$
 $$\begin{eqnarray}\displaystyle & \displaystyle (p+\unicode[STIX]{x1D70C}u^{2})_{x}+(\unicode[STIX]{x1D70C}uv)_{y}=0, & \displaystyle\end{eqnarray}$$
 $$\begin{eqnarray}\displaystyle & \displaystyle (\unicode[STIX]{x1D70C}uv)_{x}+(p+\unicode[STIX]{x1D70C}v^{2})_{y}=0, & \displaystyle\end{eqnarray}$$
 $$\begin{eqnarray}\displaystyle & \displaystyle (\unicode[STIX]{x1D70C}h_{T}u)_{x}+(\unicode[STIX]{x1D70C}h_{T}v)_{y}=0. & \displaystyle\end{eqnarray}$$
Subindices  $x$ and
 $y$ symbolize partial derivatives with respect to these coordinates. Here, the specific total enthalpy
 $h_{T}$ is expressed as
 $\unicode[STIX]{x1D70C}h_{T}=\frac{1}{2}\unicode[STIX]{x1D70C}(u^{2}+v^{2})+\unicode[STIX]{x1D70C}_{v}h_{v}+\unicode[STIX]{x1D70C}_{l}h_{l}$, where
 $h_{l}$ and
 $h_{v}$ are the specific enthalpies of liquid water and water vapour, respectively.
The van der Waals equation of state (see Moran et al. Reference Moran, Shapiro, Boettner and Bailey2014) describes the thermodynamic behaviour of water vapour,
 $$\begin{eqnarray}p=\frac{\unicode[STIX]{x1D70C}_{v}R_{v}T}{1-b\unicode[STIX]{x1D70C}_{v}}-\unicode[STIX]{x1D6FC}\unicode[STIX]{x1D70C}_{v}^{2}.\end{eqnarray}$$
Here,  $R_{v}={\mathcal{R}}/\unicode[STIX]{x1D707}$ is the gas constant for water vapour where
 $\unicode[STIX]{x1D707}$ is the molecular weight of water and
 ${\mathcal{R}}$ is the universal gas constant. Coefficients
 $\unicode[STIX]{x1D6FC}$ and
 $b$ represent the effects of intermolecular forces and finite size of the molecules, respectively. These effects become significant, especially for flows at high pressures and temperatures and close to the water vapour saturation line. The coefficients
 $\unicode[STIX]{x1D6FC}$ and
 $b$ are related to the thermodynamic critical pressure (
 $p_{c}$) and critical temperature
 $(T_{c})$ of water as
 $$\begin{eqnarray}\unicode[STIX]{x1D6FC}=\frac{27R_{v}^{2}T_{c}^{2}}{64p_{c}},\quad b=\frac{R_{v}T_{c}}{8p_{c}}.\end{eqnarray}$$
According to the van der Waals gas model, the water vapour specific enthalpy is  $h_{v}=C_{vv}T-2\unicode[STIX]{x1D6FC}\unicode[STIX]{x1D70C}_{v}+R_{v}T/(1-b\unicode[STIX]{x1D70C}_{v})$ (see Rusak & Wang Reference Rusak and Wang1997) where
 $C_{vv}$ is the specific heat of water vapour at constant volume and is assumed to be fixed throughout the flow field. It is also assumed that the liquid specific enthalpy is approximated by
 $h_{l}\sim h_{f}(T)=h_{g}(T)-h_{fg}(T)$. Here,
 $h_{fg}$ is the specific latent heat of condensation of water;
 $h_{f}$ and
 $h_{g}$ are specific enthalpies of saturated liquid and saturated vapour of water, respectively. It is also assumed that
 $h_{g}(T)\sim h_{v}$. Then
 $\unicode[STIX]{x1D70C}h_{T}=\frac{1}{2}\unicode[STIX]{x1D70C}(u^{2}+v^{2})+\unicode[STIX]{x1D70C}[C_{vv}T-2\unicode[STIX]{x1D6FC}\unicode[STIX]{x1D70C}_{v}+R_{v}T/(1-b\unicode[STIX]{x1D70C}_{v})]-\unicode[STIX]{x1D70C}gh_{fg}$. Using (2.3) and (2.6), it may be noticed that
 $h_{T}$ is fixed along a streamline of a fluid element. It is also realized that
 $h_{T}=h_{T\infty }$ for all the streamlines in the flow, where
 $h_{T\infty }=\frac{1}{2}{U_{\infty }}^{2}+C_{vv}T_{\infty }-2\unicode[STIX]{x1D6FC}\unicode[STIX]{x1D70C}_{\infty }+R_{v}T_{\infty }/(1-b\unicode[STIX]{x1D70C}_{\infty })$. Therefore, the energy equation (2.6) becomes
 $$\begin{eqnarray}\frac{1}{2}(u^{2}+v^{2})+C_{vv}T-2\unicode[STIX]{x1D6FC}\unicode[STIX]{x1D70C}_{v}+\frac{R_{v}T}{(1-b\unicode[STIX]{x1D70C}_{v})}-gh_{fg}=\frac{1}{2}{U_{\infty }}^{2}+C_{vv}T_{\infty }-2\unicode[STIX]{x1D6FC}\unicode[STIX]{x1D70C}_{\infty }+\frac{R_{v}T_{\infty }}{(1-b\unicode[STIX]{x1D70C}_{\infty })}.\end{eqnarray}$$
Equations (2.3)–(2.5), (2.7) and (2.9) together describe the fields of the pressure, temperature, density and velocity components of water vapour with a heat source term ( $gh_{fg}$) in (2.9).
To complete this set of equations, the field of condensate mass fraction ( $g$) needs to be determined. For that, the classical nucleation and droplet growth models for non-equilibrium and homogeneous condensation given by Wegener & Mack (Reference Wegener and Mack1958) and Hill (Reference Hill1966) are used to model the condensation process. A brief review of these models can be found in the appendix availabe at https://doi.org/10.1017/jfm.2019.945. The following set of partial differential equations describes the fields of the condensation parameters:
 $$\begin{eqnarray}\displaystyle & \displaystyle (\unicode[STIX]{x1D70C}ug)_{x}+(\unicode[STIX]{x1D70C}vg)_{y}=4\unicode[STIX]{x03C0}\unicode[STIX]{x1D70C}_{f}\left(\unicode[STIX]{x1D70C}Q_{1}\frac{\text{d}r}{\text{d}t}+\frac{1}{3}Jr_{0}^{3}\right), & \displaystyle\end{eqnarray}$$
 $$\begin{eqnarray}\displaystyle & \displaystyle (\unicode[STIX]{x1D70C}uQ_{1})_{x}+(\unicode[STIX]{x1D70C}vQ_{1})_{y}=2\unicode[STIX]{x1D70C}Q_{2}\frac{\text{d}r}{\text{d}t}+Jr_{0}^{2}, & \displaystyle\end{eqnarray}$$
 $$\begin{eqnarray}\displaystyle & \displaystyle (\unicode[STIX]{x1D70C}uQ_{2})_{x}+(\unicode[STIX]{x1D70C}vQ_{2})_{y}=\unicode[STIX]{x1D70C}Q_{3}\frac{\text{d}r}{\text{d}t}+Jr_{0}, & \displaystyle\end{eqnarray}$$
 $$\begin{eqnarray}\displaystyle & \displaystyle (\unicode[STIX]{x1D70C}uQ_{3})_{x}+(\unicode[STIX]{x1D70C}vQ_{3})_{y}=J. & \displaystyle\end{eqnarray}$$
Here,  $Q_{1}$,
 $Q_{2}$ and
 $Q_{3}$ denote the sum of droplet surface area, sum of droplet radii and sum of droplets, respectively, all per mass of a fluid element. Also,
 $J$ is the nucleation rate, i.e. number of droplets nucleating per unit volume of fluid element per unit time,
 $\text{d}r/\text{d}t$ is the growth rate of the droplet’s radius (which may be given by Hertz–Knudsen model) and
 $r_{0}$ is the initial radius of a condensation nucleus. Expressions for calculation of
 $J$,
 $\text{d}r/\text{d}t$ and
 $r_{0}$ are provided in the appendix. Empirical correlations of the various parameters are used according to Schnerr & Dohrmann (Reference Schnerr and Dohrmann1990). Hill (Reference Hill1966) proposed that
 $r_{0}=1.3r_{c}$ where
 $r_{c}$ is the critical radius required for a condensation nucleus to grow. In (2.10),
 $\unicode[STIX]{x1D70C}_{f}$ is the liquid density. Equations (2.10)–(2.13) together provide the fields of
 $g$,
 $Q_{1}$,
 $Q_{2}$ and
 $Q_{3}$ in terms of the fluid pressure, temperature, density and velocity described by (2.3)–(2.5), (2.7) and (2.9). For all the numerical computations done in the study,
 $r_{c}$ was found to be below 6 nm and the maximum droplet radius (maximum value of
 $Q_{2}/Q_{3}$) was found to be below
 $10~\unicode[STIX]{x03BC}\text{m}$ and these are much smaller than the fluid element size.
The set of flow equations (2.3)–(2.5), (2.7) and (2.9) coupled with the condensation equations (2.10)–(2.13) describe the complex interactions among the flow and condensation fields for a steady, two-dimensional, compressible and inviscid steam flow with non-equilibrium and homogeneous condensation. The boundary conditions of the flow problem are obtained by noting that the flow cannot have a velocity component normal to airfoil surface, i.e.
 $$\begin{eqnarray}u{\mathcal{S}}_{x}+v{\mathcal{S}}_{y}=-u\unicode[STIX]{x1D716}(F_{u,l})_{\bar{x}}+v=0,\quad \text{on }\bar{y}=\unicode[STIX]{x1D716}F_{u,l}(\bar{x}),0\leqslant \bar{x}\leqslant 1.\end{eqnarray}$$
Also, at the trailing edge of the airfoil, the Kutta condition should be satisfied, i.e. the pressure of flow from both sides of the sharp trailing edge are equal:  $p(c,y_{TE}^{+})=p(c,y_{TE}^{-})$. The uniform and dry free-stream conditions of the flow give the far-field conditions
 $$\begin{eqnarray}\left.\begin{array}{@{}c@{}}\displaystyle u\rightarrow U_{\infty },\quad v\rightarrow 0,\quad \unicode[STIX]{x1D70C}\rightarrow \unicode[STIX]{x1D70C}_{\infty },\quad p\rightarrow p_{\infty },\\ \displaystyle Q_{1}\rightarrow 0,\quad Q_{2}\rightarrow 0,\quad Q_{3}\rightarrow 0,\quad g\rightarrow 0\quad \text{as }x\rightarrow -\infty .\end{array}\right\}\end{eqnarray}$$
The thin airfoil produces only small disturbances to the uniform water vapour free-stream properties in most of the flow region. Only exception is the nose region, which is a small region  $O(\unicode[STIX]{x1D716}^{2})$ around the leading edge, where the disturbances are of a higher order of magnitude due to the flow experiencing rapid deceleration to stagnation and acceleration back to uniform velocity. When
 $\unicode[STIX]{x1D716}$ is small,
 $M_{\infty }$ is close to unity and
 $g$ is small, the flow and condensation fields of pure steam can be described by an asymptotic transonic small-disturbance (TSD) model in the entire flow domain except the nose region. This model describes all the flow, thermodynamic and condensation properties by asymptotic expansions of the small perturbations about the uniform flow properties caused by the thin airfoil. The derivation of this model is discussed in the next section.
3 Transonic small-disturbance model of steam flow
Based on the approach of Cole & Cook (Reference Cole and Cook1986) and Rusak & Lee (Reference Rusak and Lee2000a), the properties of the pure steam flow may be approximated by the following asymptotic expansions
 $$\begin{eqnarray}\left.\begin{array}{@{}c@{}}\displaystyle \bar{p}=\frac{p}{p_{\infty }}=1+\unicode[STIX]{x1D716}^{2/3}\bar{p}_{1}+\unicode[STIX]{x1D716}^{4/3}\bar{p}_{2}+\cdots \,,\quad \bar{T}=\frac{T}{T_{\infty }}=1+\unicode[STIX]{x1D716}^{2/3}\bar{T}_{1}+\unicode[STIX]{x1D716}^{4/3}\bar{T}_{2}+\cdots \,,\\ \displaystyle \bar{\unicode[STIX]{x1D70C}}=\frac{\unicode[STIX]{x1D70C}}{\unicode[STIX]{x1D70C}_{\infty }}=1+\unicode[STIX]{x1D716}^{2/3}\bar{\unicode[STIX]{x1D70C}}_{1}+\unicode[STIX]{x1D716}^{4/3}\bar{\unicode[STIX]{x1D70C}}_{2}+\cdots \,,\quad \bar{u}=\frac{u}{U_{\infty }}=1+\unicode[STIX]{x1D716}^{2/3}\bar{u}_{1}+\unicode[STIX]{x1D716}^{4/3}\bar{u}_{2}+\cdots \,,\\ \displaystyle \bar{v}=\frac{v}{U_{\infty }}=\unicode[STIX]{x1D716}\bar{v}_{1}+\unicode[STIX]{x1D716}^{5/3}\bar{v}_{2}+\cdots \,,\quad g=\unicode[STIX]{x1D716}^{4/3}\bar{g}_{1}+\cdots \,,\\ \displaystyle \bar{Q}_{1}=\frac{Q_{1}}{1/(\unicode[STIX]{x1D70C}_{f_{\infty }}l_{c})}=\unicode[STIX]{x1D716}^{4/3}\bar{Q}_{11}+\cdots \,,\quad \bar{Q}_{2}=\frac{Q_{2}}{1/(\unicode[STIX]{x1D70C}_{f_{\infty }}l_{c}^{2})}=\unicode[STIX]{x1D716}^{4/3}\bar{Q}_{21}+\cdots \,,\\ \displaystyle \bar{Q}_{3}=\frac{Q_{3}}{1/(\unicode[STIX]{x1D70C}_{f_{\infty }}l_{c}^{3})}=\unicode[STIX]{x1D716}^{4/3}\bar{Q}_{31}+\cdots \,,\quad \bar{J}=\frac{J}{(\unicode[STIX]{x1D70C}_{\infty }u_{c})/(\unicode[STIX]{x1D70C}_{f_{\infty }}l_{c}^{4})}=\unicode[STIX]{x1D716}^{4/3}\bar{J}_{1}+\cdots \,.\end{array}\right\}\end{eqnarray}$$
The various powers of  $\unicode[STIX]{x1D716}$ in (3.1) are determined through a consistent asymptotic analysis to provide the richest asymptotic model. In (3.1),
 $l_{c}$ and
 $u_{c}$ denote the characteristic length and speed of condensation, respectively,
 $$\begin{eqnarray}l_{c}=\frac{2\unicode[STIX]{x1D70E}(T_{\infty })}{\unicode[STIX]{x1D70C}_{f\infty }R_{v}T_{\infty }},\quad u_{c}=\frac{p_{\infty }}{\unicode[STIX]{x1D70C}_{f\infty }\sqrt{2\unicode[STIX]{x03C0}R_{v}T_{\infty }}}.\end{eqnarray}$$
In (3.2),  $\unicode[STIX]{x1D70E}(T_{\infty })$ denotes the surface tension of liquid water at
 $T_{\infty }$. The liquid water density at the upstream state in (3.1) and (3.2) is given by
 $\unicode[STIX]{x1D70C}_{f\infty }=\unicode[STIX]{x1D70C}_{f}(T_{\infty })$. The functions with subscripts 1 and 2 are non-dimensional perturbation functions of the similarity parameters of the flow problem and of the non-dimensional coordinates
 $\bar{x}$ and
 ${\tilde{y}}$, where
 $$\begin{eqnarray}{\tilde{y}}=\unicode[STIX]{x1D716}^{1/3}\bar{y}.\end{eqnarray}$$
It should be noted that the non-dimensional transverse coordinate is compressed by a factor of  $\unicode[STIX]{x1D716}^{1/3}$ to reflect the relatively larger distance over which the uniform flow is affected at near sonic speeds in the transverse direction compared to the axial direction. Also, a classical transonic similarity parameter,
 $K$, which defines the upstream flow Mach number’s proximity to unity in terms of the small thickness ratio
 $\unicode[STIX]{x1D716}$ is introduced as
 $$\begin{eqnarray}K=\frac{1-M_{\infty }^{2}}{\unicode[STIX]{x1D716}^{2/3}}.\end{eqnarray}$$
Also, note that  $h_{fg}(T)=h_{fg}(T_{\infty })+O(\unicode[STIX]{x1D716}^{2/3})$.
3.1 Asymptotic equations of flow behaviour
Substituting (3.1)–(3.4) into (2.3)–(2.5), (2.7) and (2.9) results in the following equations relating the perturbation functions:
from (2.3)
 $$\begin{eqnarray}\unicode[STIX]{x1D716}^{2/3}(\bar{\unicode[STIX]{x1D70C}}_{1}+\bar{u}_{1})_{\bar{x}}+\unicode[STIX]{x1D716}^{4/3}[(\bar{\unicode[STIX]{x1D70C}}_{1}\bar{u}_{1}+\bar{\unicode[STIX]{x1D70C}}_{2}+\bar{u}_{2})_{\bar{x}}+\bar{v}_{1{\tilde{y}}}]+\cdots =0,\end{eqnarray}$$
from (2.4)
 $$\begin{eqnarray}\displaystyle & & \displaystyle \unicode[STIX]{x1D716}^{2/3}\left(\frac{a_{\infty }^{2}M_{\infty }^{2}\unicode[STIX]{x1D70C}_{\infty }}{p_{\infty }}\bar{u}_{1}+\bar{p}_{1}\right)_{\bar{x}}+\unicode[STIX]{x1D716}^{2/3}\frac{a_{\infty }^{2}M_{\infty }^{2}\unicode[STIX]{x1D70C}_{\infty }}{p_{\infty }}(\bar{\unicode[STIX]{x1D70C}}_{1}+\bar{u}_{1})_{\bar{x}}\nonumber\\ \displaystyle & & \displaystyle \quad +\,\unicode[STIX]{x1D716}^{4/3}\left[\left(\frac{a_{\infty }^{2}M_{\infty }^{2}\unicode[STIX]{x1D70C}_{\infty }}{p_{\infty }}(\bar{\unicode[STIX]{x1D70C}}_{2}+2\bar{u}_{2}+\bar{u}_{1}^{2}+2\bar{\unicode[STIX]{x1D70C}}_{1}\bar{u}_{1})+\bar{p}_{2}\right)_{\bar{x}}+\frac{a_{\infty }^{2}M_{\infty }^{2}\unicode[STIX]{x1D70C}_{\infty }}{p_{\infty }}\bar{v}_{1{\tilde{y}}}\right]\nonumber\\ \displaystyle & & \displaystyle \quad +\,\cdots =0,\end{eqnarray}$$
from (2.5)
 $$\begin{eqnarray}\unicode[STIX]{x1D716}\left(\bar{p}_{1{\tilde{y}}}+\frac{a_{\infty }^{2}M_{\infty }^{2}\unicode[STIX]{x1D70C}_{\infty }}{p_{\infty }}\bar{v}_{1\bar{x}}\right)+\cdots =0,\end{eqnarray}$$
from (2.7)
 $$\begin{eqnarray}\displaystyle & & \displaystyle \unicode[STIX]{x1D716}^{2/3}\left[\bar{p}_{1}-\left(1+\frac{\unicode[STIX]{x1D6FC}\unicode[STIX]{x1D70C}_{\infty }^{2}}{p_{\infty }}\right)\bar{T}_{1}-\left(\frac{p_{\infty }+\unicode[STIX]{x1D6FC}\unicode[STIX]{x1D70C}_{\infty }^{2}}{(1-b\unicode[STIX]{x1D70C}_{\infty })p_{\infty }}-\frac{2\unicode[STIX]{x1D6FC}\unicode[STIX]{x1D70C}_{\infty }^{2}}{p_{\infty }}\right)\bar{\unicode[STIX]{x1D70C}}_{1}\right]\nonumber\\ \displaystyle & & \displaystyle \quad +\,\unicode[STIX]{x1D716}^{4/3}\left[\bar{p}_{2}-\left(1+\frac{\unicode[STIX]{x1D6FC}\unicode[STIX]{x1D70C}_{\infty }^{2}}{p_{\infty }}\right)\bar{T}_{2}-\left(\frac{p_{\infty }+\unicode[STIX]{x1D6FC}\unicode[STIX]{x1D70C}_{\infty }^{2}}{(1-b\unicode[STIX]{x1D70C}_{\infty })p_{\infty }}-\frac{2\unicode[STIX]{x1D6FC}\unicode[STIX]{x1D70C}_{\infty }^{2}}{p_{\infty }}\right)\bar{\unicode[STIX]{x1D70C}}_{2}\right.\nonumber\\ \displaystyle & & \displaystyle \quad -\left(\frac{p_{\infty }+\unicode[STIX]{x1D6FC}\unicode[STIX]{x1D70C}_{\infty }^{2}}{(1-b\unicode[STIX]{x1D70C}_{\infty })p_{\infty }}\right)\bar{\unicode[STIX]{x1D70C}}_{1}\bar{T}_{1}\nonumber\\ \displaystyle & & \displaystyle \quad -\left.\left(\frac{b\unicode[STIX]{x1D70C}_{\infty }(p_{\infty }+\unicode[STIX]{x1D6FC}\unicode[STIX]{x1D70C}_{\infty }^{2})}{(1-b\unicode[STIX]{x1D70C}_{\infty })^{2}p_{\infty }}-\frac{\unicode[STIX]{x1D6FC}\unicode[STIX]{x1D70C}_{\infty }^{2}}{p_{\infty }}\right)\bar{\unicode[STIX]{x1D70C}}_{1}^{2}+\left(\frac{p_{\infty }+\unicode[STIX]{x1D6FC}\unicode[STIX]{x1D70C}_{\infty }^{2}}{(1-b\unicode[STIX]{x1D70C}_{\infty })p_{\infty }}-\frac{2\unicode[STIX]{x1D6FC}\unicode[STIX]{x1D70C}_{\infty }^{2}}{p_{\infty }}\right)\bar{g}_{1}\right]+\cdots =0,\nonumber\\ \displaystyle & & \displaystyle\end{eqnarray}$$
and from (2.9)
 $$\begin{eqnarray}\displaystyle & & \displaystyle \unicode[STIX]{x1D716}^{2/3}\left[\left(1+\frac{R_{v}}{C_{vv}(1-b\unicode[STIX]{x1D70C}_{\infty })}\right)\bar{T}_{1}+M_{\infty }^{2}\frac{a_{\infty }^{2}}{C_{vv}T_{\infty }}\bar{u}_{1}+\left(\frac{b\unicode[STIX]{x1D70C}_{\infty }R_{v}}{C_{vv}(1-b\unicode[STIX]{x1D70C}_{\infty })^{2}}-\frac{2\unicode[STIX]{x1D6FC}\unicode[STIX]{x1D70C}_{\infty }}{C_{vv}T_{\infty }}\right)\bar{\unicode[STIX]{x1D70C}}_{1}\right]\nonumber\\ \displaystyle & & \displaystyle \quad +\,\unicode[STIX]{x1D716}^{4/3}\left[\left(1+\frac{R_{v}}{C_{vv}(1-b\unicode[STIX]{x1D70C}_{\infty })}\right)\bar{T}_{2}+M_{\infty }^{2}\frac{a_{\infty }^{2}}{C_{vv}T_{\infty }}\left(\bar{u}_{2}+\frac{\bar{u}_{1}^{2}}{2}\right)\right.\nonumber\\ \displaystyle & & \displaystyle \quad +\,\left(\frac{b\unicode[STIX]{x1D70C}_{\infty }R_{v}}{C_{vv}(1-b\unicode[STIX]{x1D70C}_{\infty })^{2}}-\frac{2\unicode[STIX]{x1D6FC}\unicode[STIX]{x1D70C}_{\infty }}{C_{vv}T_{\infty }}\right)\bar{\unicode[STIX]{x1D70C}}_{2}+\frac{(b\unicode[STIX]{x1D70C}_{\infty })^{2}R_{v}}{C_{vv}(1-b\unicode[STIX]{x1D70C}_{\infty })^{3}}\bar{\unicode[STIX]{x1D70C}}_{1}^{2}+\frac{b\unicode[STIX]{x1D70C}_{\infty }R_{v}}{C_{vv}(1-b\unicode[STIX]{x1D70C}_{\infty })^{2}}\bar{T}_{1}\bar{\unicode[STIX]{x1D70C}}_{1}\nonumber\\ \displaystyle & & \displaystyle \quad -\left.\bar{g}_{1}\left(\frac{h_{fg}(T_{\infty })}{C_{vv}T_{\infty }}+\frac{b\unicode[STIX]{x1D70C}_{\infty }R_{v}}{C_{vv}(1-b\unicode[STIX]{x1D70C}_{\infty })^{2}}-\frac{2\unicode[STIX]{x1D6FC}\unicode[STIX]{x1D70C}_{\infty }}{C_{vv}T_{\infty }}\right)\right]+\cdots =0.\end{eqnarray}$$
Note that in (3.5) and (3.6), the term  $\unicode[STIX]{x1D716}^{2/3}(\bar{\unicode[STIX]{x1D70C}}_{1}+\bar{u}_{1})$ may be
 $O(\unicode[STIX]{x1D716}^{4/3})$. The leading-order
 $O(\unicode[STIX]{x1D716}^{2/3})$ terms of (3.6) then give
 $\bar{p}_{1}+a_{\infty }^{2}M_{\infty }^{2}\unicode[STIX]{x1D70C}_{\infty }\bar{u}_{1}/p_{\infty }=f({\tilde{y}})$. Owing to the uniformity of the upstream flow,
 $f({\tilde{y}})=0$. Therefore,
 $$\begin{eqnarray}\bar{p}_{1}=-\frac{a_{\infty }^{2}M_{\infty }^{2}\unicode[STIX]{x1D70C}_{\infty }}{p_{\infty }}\bar{u}_{1}.\end{eqnarray}$$
The isentropic frozen speed of sound ( $a_{\infty }$) in a van der Waals fluid can be expressed as (see Rusak & Wang Reference Rusak and Wang1997)
 $$\begin{eqnarray}a_{\infty }^{2}=\frac{p_{\infty }+\unicode[STIX]{x1D6FC}\unicode[STIX]{x1D70C}_{\infty }^{2}}{(1-b\unicode[STIX]{x1D70C}_{\infty })\unicode[STIX]{x1D70C}_{\infty }}\left(1+\frac{R_{v}}{C_{vv}}\right)-2\unicode[STIX]{x1D6FC}\unicode[STIX]{x1D70C}_{\infty }\end{eqnarray}$$
or
 $$\begin{eqnarray}\displaystyle \frac{a_{\infty }^{2}\unicode[STIX]{x1D70C}_{\infty }}{p_{\infty }}=\frac{p_{\infty }+\unicode[STIX]{x1D6FC}\unicode[STIX]{x1D70C}_{\infty }^{2}}{(1-b\unicode[STIX]{x1D70C}_{\infty })p_{\infty }}\left(1+\frac{R_{v}}{C_{vv}}\right)-\frac{2\unicode[STIX]{x1D6FC}\unicode[STIX]{x1D70C}_{\infty }^{2}}{p_{\infty }}. & & \displaystyle\end{eqnarray}$$
For the following analysis, the formula
 $$\begin{eqnarray}\displaystyle \frac{a_{\infty }^{2}}{C_{vv}T_{\infty }}=\frac{R_{v}}{C_{vv}(1-b\unicode[STIX]{x1D70C}_{\infty })^{2}}\left(1+\frac{R_{v}}{C_{vv}}\right)-\frac{2\unicode[STIX]{x1D6FC}\unicode[STIX]{x1D70C}_{\infty }}{C_{vv}T_{\infty }} & & \displaystyle\end{eqnarray}$$
is also needed. To simplify the above equations, the following non-dimensional parameters are defined:
 $$\begin{eqnarray}K_{r}=\frac{R_{v}}{C_{vv}(1-b\unicode[STIX]{x1D70C}_{\infty })},\quad K_{b}=\frac{b\unicode[STIX]{x1D70C}_{\infty }}{1-b\unicode[STIX]{x1D70C}_{\infty }},\quad K_{a}=\frac{2\unicode[STIX]{x1D6FC}\unicode[STIX]{x1D70C}_{\infty }}{C_{vv}T_{\infty }},\quad K_{\unicode[STIX]{x1D6FC}}=\frac{\unicode[STIX]{x1D6FC}\unicode[STIX]{x1D70C}_{\infty }^{2}}{p_{\infty }}.\end{eqnarray}$$
Expressing the isentropic speed of sound in terms of these parameters:
 $$\begin{eqnarray}\frac{a_{\infty }^{2}\unicode[STIX]{x1D70C}_{\infty }}{p_{\infty }}=(1+K_{\unicode[STIX]{x1D6FC}})(1+K_{b}+K_{r})-2K_{\unicode[STIX]{x1D6FC}};\quad \frac{a_{\infty }^{2}}{C_{vv}T_{\infty }}=K_{r}(1+K_{b}+K_{r})-K_{a}.\end{eqnarray}$$
The leading-order  $O(\unicode[STIX]{x1D716}^{2/3})$ terms in (3.8) and (3.9) together with the result of (3.10) give
 $$\begin{eqnarray}\bar{T}_{1}=-K_{r}M_{\infty }^{2}\bar{u}_{1}.\end{eqnarray}$$
Utilizing (3.10) and (3.16), the leading-order  $O(\unicode[STIX]{x1D716}^{2/3})$ terms in (3.8) give
 $$\begin{eqnarray}\bar{\unicode[STIX]{x1D70C}}_{1}=-M_{\infty }^{2}\bar{u}_{1}.\end{eqnarray}$$
As a result,  $\unicode[STIX]{x1D716}^{2/3}(\bar{\unicode[STIX]{x1D70C}}_{1}+\bar{u}_{1})=\unicode[STIX]{x1D716}^{2/3}(1-M_{\infty }^{2})\bar{u}_{1}=\unicode[STIX]{x1D716}^{4/3}K\bar{u}_{1}$ which validates the previous assumption. Therefore, in the higher order
 $O(\unicode[STIX]{x1D716}^{4/3})$, (3.5) becomes
 $$\begin{eqnarray}(\bar{\unicode[STIX]{x1D70C}}_{2}+\bar{u}_{2}+K\bar{u}_{1}-M_{\infty }^{2}\bar{u}_{1}^{2})_{\bar{x}}+\bar{v}_{1{\tilde{y}}}=0,\end{eqnarray}$$
and (3.6) becomes
 $$\begin{eqnarray}\left(\bar{p}_{2}+\frac{a_{\infty }^{2}\unicode[STIX]{x1D70C}_{\infty }}{p_{\infty }}M_{\infty }^{2}[\bar{\unicode[STIX]{x1D70C}}_{2}+2\bar{u}_{2}+\bar{u}_{1}^{2}(1-2M_{\infty }^{2})+K\bar{u}_{1}]\right)_{\bar{x}}+\frac{a_{\infty }^{2}\unicode[STIX]{x1D70C}_{\infty }}{p_{\infty }}M_{\infty }^{2}\bar{v}_{1{\tilde{y}}}=0.\end{eqnarray}$$
 $$\begin{eqnarray}\displaystyle \bar{p}_{2}=-\frac{a_{\infty }^{2}\unicode[STIX]{x1D70C}_{\infty }}{p_{\infty }}M_{\infty }^{2}[\bar{u}_{2}+\bar{u}_{1}^{2}(1-M_{\infty }^{2})], & & \displaystyle\end{eqnarray}$$
or
 $$\begin{eqnarray}\bar{p}_{2}=-[(1+K_{\unicode[STIX]{x1D6FC}})(1+K_{b}+K_{r})-2K_{\unicode[STIX]{x1D6FC}}]M_{\infty }^{2}[\bar{u}_{2}+\bar{u}_{1}^{2}(1-M_{\infty }^{2})].\end{eqnarray}$$
Higher-order  $O(\unicode[STIX]{x1D716}^{4/3})$ terms in (3.9) give
 $$\begin{eqnarray}\displaystyle & & \displaystyle [K_{r}(1+K_{b}+K_{r})-K_{a}]M_{\infty }^{2}\left(\bar{u}_{2}+\frac{\bar{u}_{1}^{2}}{2}\right)+(1+K_{r})\bar{T}_{2}+(K_{b}K_{r}-K_{a})\bar{\unicode[STIX]{x1D70C}}_{2}+K_{r}K_{b}^{2}\bar{\unicode[STIX]{x1D70C}}_{1}^{2}\nonumber\\ \displaystyle & & \displaystyle \quad +\,K_{r}K_{b}\bar{\unicode[STIX]{x1D70C}}_{1}\bar{T}_{1}-\left(\frac{h_{fg}(T_{\infty })}{C_{vv}T_{\infty }}+K_{r}K_{b}-K_{a}\right)\bar{g}_{1}=0.\end{eqnarray}$$
Utilizing (3.16) and (3.17) in the above equation gives
 $$\begin{eqnarray}\displaystyle & & \displaystyle [K_{r}(1+K_{b}+K_{r})-K_{a}]M_{\infty }^{2}\frac{\bar{u}_{1}^{2}}{2}+(1+K_{r})(\bar{T}_{2}+K_{r}M_{\infty }^{2}\bar{u}_{2})+(K_{b}K_{r}-K_{a})(\bar{\unicode[STIX]{x1D70C}}_{2}+M_{\infty }^{2}\bar{u}_{2})\nonumber\\ \displaystyle & & \displaystyle \quad +\,K_{r}K_{b}(K_{r}+K_{b})M_{\infty }^{4}\bar{u}_{1}^{2}-\left(\frac{h_{fg}(T_{\infty })}{C_{vv}T_{\infty }}+K_{r}K_{b}-K_{a}\right)\bar{g}_{1}=0.\end{eqnarray}$$
Higher-order  $O(\unicode[STIX]{x1D716}^{4/3})$ terms in (3.8) give
 $$\begin{eqnarray}\displaystyle & & \displaystyle \bar{p}_{2}-(1+K_{\unicode[STIX]{x1D6FC}})\bar{T}_{2}-[(1+K_{\unicode[STIX]{x1D6FC}})(1+K_{b})-2K_{\unicode[STIX]{x1D6FC}}]\bar{\unicode[STIX]{x1D70C}}_{2}- [(1+K_{\unicode[STIX]{x1D6FC}})(1+K_{b})(K_{b}+K_{r})\nonumber\\ \displaystyle & & \displaystyle \quad -\,K_{\unicode[STIX]{x1D6FC}}\!]M_{\infty }^{4}\bar{u}_{1}^{2}+[(1+K_{\unicode[STIX]{x1D6FC}})(1+K_{b})-2K_{\unicode[STIX]{x1D6FC}}]\bar{g}_{1}=0.\end{eqnarray}$$
Equations (3.18) and (3.21)–(3.24) together result in
 $$\begin{eqnarray}(K-K_{G}M_{\infty }^{2}\bar{u}_{1})\bar{u}_{1\bar{x}}+\bar{v}_{1{\tilde{y}}}=\bar{g}_{1\bar{x}}\left(\frac{h_{fg}(T_{\infty })}{K_{3}C_{vv}T_{\infty }(1+K_{r})}-1\right).\end{eqnarray}$$
Here,
 $$\begin{eqnarray}\displaystyle K_{G}=2\left(1+\frac{K_{1}+K_{2}}{K_{3}}\right), & & \displaystyle\end{eqnarray}$$
where
 $$\begin{eqnarray}\displaystyle \left.\begin{array}{@{}c@{}}\displaystyle K_{1}=-\frac{K_{r}}{2}-\frac{K_{b}K_{r}-K_{a}}{2(1+K_{r})},\quad K_{2}=-\frac{K_{\unicode[STIX]{x1D6FC}}}{1+K_{\unicode[STIX]{x1D6FC}}}+(1+K_{b})(K_{b}+K_{r})-K_{b}K_{r}\frac{K_{b}+K_{r}}{1+K_{r}},\\ \displaystyle K_{3}=(1+K_{b})-\frac{K_{b}K_{r}-K_{a}}{1+K_{r}}-2\frac{K_{\unicode[STIX]{x1D6FC}}}{1+K_{\unicode[STIX]{x1D6FC}}}.\end{array}\right\} & & \displaystyle \nonumber\\ \displaystyle & & \displaystyle\end{eqnarray}$$
Also, from (3.7) and (3.10), it is found that
 $$\begin{eqnarray}\bar{u}_{1{\tilde{y}}}-\bar{v}_{1\bar{x}}=0.\end{eqnarray}$$
The set of equations (3.25) and (3.28) constitute an extended Kármán–Guderley system for transonic small-disturbance flow of steam with condensation. Equation (3.25) contains a heat source term which depends on the condensate mass fraction perturbation function,  $\bar{g}_{1}$. It can be concluded from (3.28) that the flow has no vorticity and, hence, is isentropic to the leading order
 $O(\unicode[STIX]{x1D716}^{2/3})$ of perturbations in temperature, density, pressure and velocity. This allows for the definition of a velocity perturbation potential function
 $\unicode[STIX]{x1D719}_{1}$ where
 $\bar{u}_{1}=\unicode[STIX]{x1D719}_{1\bar{x}}$ and
 $\bar{v}_{1}=\unicode[STIX]{x1D719}_{1{\tilde{y}}}$. Then, (3.25) can be written as
 $$\begin{eqnarray}(K-K_{G}M_{\infty }^{2}\unicode[STIX]{x1D719}_{1\bar{x}})\unicode[STIX]{x1D719}_{1\bar{x}\bar{x}}+\unicode[STIX]{x1D719}_{1{\tilde{y}}{\tilde{y}}}=\bar{g}_{1\bar{x}}\left(\frac{h_{fg}(T_{\infty })}{K_{3}C_{vv}T_{\infty }(1+K_{r})}-1\right).\end{eqnarray}$$
Equation (3.29) is also referred to as the extended TSD equation.
Substitution of the asymptotic expansions (3.1) in airfoil boundary conditions (2.14), the far-field conditions (2.15) and the Kutta condition provide the boundary conditions for the extended TSD equation
 $$\begin{eqnarray}\left.\begin{array}{@{}c@{}}\displaystyle \unicode[STIX]{x1D719}_{1{\tilde{y}}}(\bar{x},0^{+})=F_{u}^{\prime }(\bar{x})\quad \text{and}\quad \unicode[STIX]{x1D719}_{1{\tilde{y}}}(\bar{x},0^{-})=F_{l}^{\prime }(\bar{x})\quad \text{for }0\leqslant \bar{x}\leqslant 1,\\ \displaystyle \unicode[STIX]{x1D719}_{1\bar{x}},\unicode[STIX]{x1D719}_{1{\tilde{y}}}\rightarrow 0\quad \text{as }\bar{x}\rightarrow -\infty ,\quad \unicode[STIX]{x1D719}_{1\bar{x}}(1,0^{-})=\unicode[STIX]{x1D719}_{1\bar{x}}(1,0^{+}).\end{array}\right\}\end{eqnarray}$$
At low pressures and temperatures, the water vapour thermodynamic behaviour approaches the perfect-gas behaviour. Under these limiting conditions,  $\unicode[STIX]{x1D6FC}=b=0$, and therefore,
 $K_{\unicode[STIX]{x1D6FC}}=K_{a}=K_{b}=0$,
 $K_{G}=\unicode[STIX]{x1D6FE}_{v}+1$,
 $K_{3}=1$ and
 $1+K_{r}=\unicode[STIX]{x1D6FE}_{v}$, where
 $\unicode[STIX]{x1D6FE}_{v}$ is the specific heat ratio of water vapour. Equation (3.29) then becomes
 $$\begin{eqnarray}(K-(\unicode[STIX]{x1D6FE}_{v}+1)M_{\infty }^{2}\unicode[STIX]{x1D719}_{1\bar{x}})\unicode[STIX]{x1D719}_{1\bar{x}\bar{x}}+\unicode[STIX]{x1D719}_{1{\tilde{y}}{\tilde{y}}}=\bar{g}_{1\bar{x}}\left(\frac{h_{fg}(T_{\infty })}{C_{pv}T_{\infty }}-1\right),\end{eqnarray}$$
which is the TSD equation for perfect-gas steam flow with non-equilibrium and homogeneous condensation (see Virk & Rusak Reference Virk and Rusak2019).
3.2 Asymptotic equations of the condensation process
Substituting the asymptotic expansions (3.1) into the set of condensation equations (2.10)–(2.13) gives the relationships between the leading-order  $O(\unicode[STIX]{x1D716}^{4/3})$ perturbation functions of the condensation parameters,
 $\bar{g}_{1},\bar{Q}_{11},\bar{Q}_{21}$ and
 $\bar{Q}_{31}$,
 $$\begin{eqnarray}\displaystyle & \displaystyle \bar{g}_{1\bar{x}}=4\unicode[STIX]{x03C0}K_{t}\left(\bar{Q}_{11}\frac{\text{d}\bar{r}}{\text{d}\bar{t}}+\frac{1}{3}\bar{J}_{1}\bar{r}_{0}^{3}\right), & \displaystyle\end{eqnarray}$$
 $$\begin{eqnarray}\displaystyle & \displaystyle \bar{Q}_{11\bar{x}}=K_{t}\left(2\bar{Q}_{21}\frac{\text{d}\bar{r}}{\text{d}\bar{t}}+\bar{J}_{1}\bar{r}_{0}^{2}\right), & \displaystyle\end{eqnarray}$$
 $$\begin{eqnarray}\displaystyle & \displaystyle \bar{Q}_{21\bar{x}}=K_{t}\left(\bar{Q}_{31}\frac{\text{d}\bar{r}}{\text{d}\bar{t}}+\bar{J}_{1}\bar{r}_{0}\right), & \displaystyle\end{eqnarray}$$
 $$\begin{eqnarray}\displaystyle & \displaystyle \bar{Q}_{31\bar{x}}=K_{t}\bar{J}_{1}. & \displaystyle\end{eqnarray}$$
Equations (3.32)–(3.35) form a complex set of first-order and closed-coupled nonlinear ordinary differential equations. In these equations,  $\bar{r}_{0}=r_{0}/l_{c}$ while
 $\text{d}\bar{r}/\text{d}\bar{t}$ and
 $\bar{J}_{1}$ are non-dimensional forms of
 $\text{d}r/\text{d}t$ and
 $J$ (see appendix for expressions). It should be noted that
 $\bar{J}_{1}$ depends on the number of water molecules in a characteristic droplet
 $n_{c}=(4\unicode[STIX]{x03C0}/3)\unicode[STIX]{x1D70C}_{f\infty }l_{c}^{3}/m$. Here,
 $m$ is the mass of a water molecule. Note that
 $n_{c}$ is a function of upstream temperature (
 $T_{\infty }$) only. Also, the nucleation rate
 $\bar{J}_{1}$ is a highly sensitive function of
 $\bar{T}$, that is given by
 $$\begin{eqnarray}\bar{T}=1-\unicode[STIX]{x1D716}^{2/3}K_{r}M_{\infty }^{2}\unicode[STIX]{x1D719}_{1\bar{x}}+\unicode[STIX]{x1D716}^{4/3}\left(1+K_{b}-\frac{2K_{\unicode[STIX]{x1D6FC}}}{1+K_{\unicode[STIX]{x1D6FC}}}\right)\left(\frac{h_{fg}(T_{\infty })}{K_{3}C_{vv}T_{\infty }}\right)\bar{g}_{1}+\cdots \,.\end{eqnarray}$$
Note that  $\bar{T}$ depends on
 $\unicode[STIX]{x1D719}_{1\bar{x}}$ and
 $\bar{g}_{1}$; it is necessary for accuracy of the computations to account for the effects of changes in
 $\bar{g}_{1}$ (of
 $O(\unicode[STIX]{x1D716}^{4/3})$) when computing the temperature field. In addition, in (3.32)–(3.35),
 $K_{t}$ is the condensation similarity parameter,
 $$\begin{eqnarray}K_{t}=\frac{t_{f}}{t_{c}}=\frac{cp_{\infty }}{\unicode[STIX]{x1D70E}(T_{\infty })M_{\infty }a_{\infty }}\sqrt{\frac{R_{v}T_{\infty }}{8\unicode[STIX]{x03C0}}},\end{eqnarray}$$
where  $t_{f}=c/U_{\infty }$ represents the characteristic convection time and
 $t_{c}=l_{c}/u_{c}$ represents the characteristic condensation time. If
 $K_{t}<1$, time spent by the steam to convect across the airfoil surface is less than the time spent by the steam to condense, and thus no condensation is observed. Conversely, if
 $K_{t}$ is very large (i.e. time required for initiation of condensation is much less than the time required for the flow to convect over the airfoil surface) then condensation might be observed along the airfoil surface.
The far-field conditions for the condensation equations
 $$\begin{eqnarray}\bar{g}_{1}=\bar{Q}_{11}=\bar{Q}_{21}=\bar{Q}_{31}=0,\quad \text{as }\bar{x}\rightarrow -\infty ,\end{eqnarray}$$
provide the initial values for integration of (3.32)–(3.35).
3.3 Summary of asymptotic model
In summary, the theoretical transonic small-disturbance model describes the flow and condensation fields of pure water vapour around a thin airfoil with a nonlinear partial differential equation (3.29) coupled with a set of ordinary differential equations (3.32)–(3.35). The numerical solution of these equations requires a coupled iterative process which provides the fields of  $\unicode[STIX]{x1D719}_{1}(\bar{x},{\tilde{y}})$ and of
 $\bar{g}_{1}(\bar{x},{\tilde{y}})$. The field of
 $\unicode[STIX]{x1D719}_{1}$ results in the pressure field,
 $\bar{p}=p/p_{\infty }=1-\unicode[STIX]{x1D716}^{2/3}(a_{\infty }^{2}M_{\infty }^{2}\unicode[STIX]{x1D70C}_{\infty }/p_{\infty })\unicode[STIX]{x1D719}_{1\bar{x}}+\cdots \,$, the axial velocity field
 $u/U_{\infty }=1+\unicode[STIX]{x1D716}^{2/3}\unicode[STIX]{x1D719}_{1\bar{x}}+\cdots \,$, the transverse velocity field
 $v/U_{\infty }=\unicode[STIX]{x1D716}\unicode[STIX]{x1D719}_{1\bar{y}}+\cdots \,$ and, together with
 $\bar{g}_{1}$, the temperature field according to (3.36). The field of condensate mass fraction (
 $g$) is obtained as
 $g=\unicode[STIX]{x1D716}^{4/3}\bar{g}_{1}+\cdots \,$. The pressure coefficient (
 $C_{p}$) is computed as
 $C_{p}=(p-p_{\infty })/(\frac{1}{2}\unicode[STIX]{x1D70C}_{\infty }U_{\infty }^{2})=-2\unicode[STIX]{x1D716}^{2/3}\unicode[STIX]{x1D719}_{1\bar{x}}+\cdots \,$. The wave drag and lift coefficients,
 $C_{d}$ and
 $C_{l}$, can be obtained by the integration of pressure distributions along the airfoil surfaces as
 $$\begin{eqnarray}C_{d}=\unicode[STIX]{x1D716}\int _{0}^{1}[(C_{p})_{u}F_{u}^{\prime }-(C_{p})_{l}F_{l}^{\prime }]\,\text{d}\bar{x},\quad C_{l}=\int _{0}^{1}[(C_{p})_{l}-(C_{p})_{u}]\,\text{d}\bar{x},\end{eqnarray}$$
where  $u,l$ represent values on the upper and lower surfaces of airfoil. The model also identifies the similarity parameters of the flow problem which are as follows: thickness ratio of airfoil
 $\unicode[STIX]{x1D716}$, scaled angle of attack
 $\unicode[STIX]{x1D6E9}$, classical transonic similarity parameter
 $K$, real-gas similarity parameter
 $K_{G}$, scaled latent heat of condensation
 $h_{fg}(T_{\infty })/[K_{3}C_{vv}T_{\infty }(1+K_{r})]$, upstream flow supersaturation ratio
 $S_{\infty }$, ratio of time scales of convection to condensation
 $K_{t}$ and number of molecules in a characteristic droplet
 $n_{c}$.
We note that the extended TSD equation (3.29) displays a leading-edge singularity as the flow approaches stagnation near the leading edge ( $\bar{x}\rightarrow 0,{\tilde{y}}\rightarrow 0$). The singularity affects the TSD solution in a small region
 $O(\unicode[STIX]{x1D716}^{2})$ around the airfoil’s nose. As flow becomes transonic and the upstream flow Mach number approaches unity, the nose singularity causes the flow to be nearly symmetric about the leading edge and with respect to subsonic flows, induces a loss of leading-edge suction and lift. In regions away from the leading edge of the order of
 $\unicode[STIX]{x1D716}$ and lower, the TSD model solution is not affected by the nose singularity. In the present study, the nose singularity is removed from the TSD solution with the multiscale matched-asymptotic approach of Rusak (Reference Rusak1993) around the leading edge by replacing
 $\unicode[STIX]{x1D6FE}_{v}+1$ with
 $K_{G}$ in that analysis. After removal of the nose singularity, the TSD model solution was found to match better with an Euler flow problem solution around the nose region. Note, however, that in the nose region the temperature is high, and no condensation occurs.
4 Numerical algorithm
The extended TSD equation (3.29) is a type-changing partial differential equation, the nature of which is determined by the value of  $(K-K_{G}M_{\infty }^{2}\unicode[STIX]{x1D719}_{1\bar{x}})$. The equation is elliptic in regions where
 $(K-K_{G}M_{\infty }^{2}\unicode[STIX]{x1D719}_{1\bar{x}})>0$, is hyperbolic in regions where
 $(K-K_{G}M_{\infty }^{2}\unicode[STIX]{x1D719}_{1\bar{x}})<0$ and is parabolic at points where
 $(K-K_{G}M_{\infty }^{2}\unicode[STIX]{x1D719}_{1\bar{x}})=0$. Due to this, the numerical computation of the extended TSD equation requires a finite-difference scheme which is sensitive to its nature. Murman & Cole (Reference Murman and Cole1971) devised a numerical method to solve type-changing partial differential equations which they encountered during their TSD study of non-lifting dry air flow over a thin airfoil. In this method, a simple test is performed to discover the nature of the TSD equation at a particular computational point. Then a suitable finite-difference scheme is implemented to discretize the TSD equation at that point. A line relaxation algorithm is then used to iteratively solve the discretized equations while marching downstream in the computational domain. Krupp & Murman (Reference Krupp and Murman1972) extended this approach to solve problems of transonic dry air flow around thin airfoils at small angles of attack. An analytical approximation of the solution was used at the edges of the computational domain. The circulation was represented by a leap in velocity perturbation potential across the wake of the airfoil. Circulation was obtained as part of the solution after every iteration and the far-field approximation was regularly updated using this value. The numerical scheme was found to accurately predict the shock wave location along the airfoil surface; however, it slightly under-predicted its strength. Cole & Cook (Reference Cole and Cook1986) refined the numerical method of Krupp & Murman (Reference Krupp and Murman1972) by including a test to identify a shock wave point. A finite-difference scheme was then applied that used elements of forward and backward difference schemes to discretize the TSD equation at the shock wave point. This numerical scheme was found to more accurately predict the shock wave strength and location along the airfoil surface. Rusak & Lee (Reference Rusak and Lee2000a) used this method in their numerical computations of non-lifting humid air flow around a NACA0012 airfoil and the results matched well with the numerical results of Schnerr & Dohrmann (Reference Schnerr and Dohrmann1990) which were based on the inviscid flow equations.
Computational domain.

Following the approach of Cole & Cook (Reference Cole and Cook1986), the flow domain in the current study is transformed into a rectangular uniformly structured mesh with equal grid spacings  $\triangle \bar{x}$ and
 $\triangle {\tilde{y}}$ along the axial (
 $x$) and transverse (
 $y$) axes, respectively. The computational domain is depicted in figure 2. Here, the indices
 $i,j$ denote a grid point. The upstream, downstream, bottom and top edges of the computational domain are denoted by
 $i=1$,
 $i=M_{x}$,
 $j=1$ and
 $j=M_{y}$ grid lines respectively. The
 $j=LA$ and
 $j=LA-1$ grid lines are positioned one half of a grid spacing above and below the airfoil surface, respectively. Vertical grid line
 $i=LE$ is positioned one half of a grid spacing downstream from the leading edge of the airfoil and vertical grid line
 $i=TE$ is positioned one half of a grid spacing upstream from the trailing edge of the airfoil. Equation (3.29) can be written as
 $$\begin{eqnarray}(K\unicode[STIX]{x1D719}_{1\bar{x}}-K_{G}M_{\infty }^{2}{\unicode[STIX]{x1D719}_{1\bar{x}}}^{2})_{\bar{x}}+(\unicode[STIX]{x1D719}_{1{\tilde{y}}})_{{\tilde{y}}}=\bar{g}_{1\bar{x}}\left(\frac{h_{fg}(T_{\infty })}{K_{3}C_{vv}T_{\infty }(1+K_{r})}-1\right).\end{eqnarray}$$
The finite-difference approximation of (4.1) can be written as
 $$\begin{eqnarray}\displaystyle & & \displaystyle (K\unicode[STIX]{x1D719}_{1\bar{x}}-K_{G}M_{\infty }^{2}{\unicode[STIX]{x1D719}_{1\bar{x}}}^{2})_{i+1/2,j}\triangle {\tilde{y}}-(K\unicode[STIX]{x1D719}_{1\bar{x}}-K_{G}M_{\infty }^{2}{\unicode[STIX]{x1D719}_{1\bar{x}}}^{2})_{i-1/2,j}\triangle {\tilde{y}}\nonumber\\ \displaystyle & & \displaystyle \quad +\,(\unicode[STIX]{x1D719}_{1{\tilde{y}}})_{i,j+1/2}\triangle \bar{x}-(\unicode[STIX]{x1D719}_{1{\tilde{y}}})_{i,j-1/2}\triangle \bar{x}=(\bar{g}_{1\bar{x}})_{i,j}\left(\frac{h_{fg}(T_{\infty })}{K_{3}C_{vv}T_{\infty }(1+K_{r})}-1\right)\triangle \bar{x}\triangle {\tilde{y}}.\qquad\end{eqnarray}$$
Following the method of Cole & Cook (Reference Cole and Cook1986), two parameters are calculated at every grid point:
 $$\begin{eqnarray}f_{c}=-K+K_{G}\frac{(\unicode[STIX]{x1D719}_{1})_{i+1,j}-(\unicode[STIX]{x1D719}_{1})_{i-1,j}}{2\triangle \bar{x}},\quad f_{b}=-K+K_{G}\frac{(\unicode[STIX]{x1D719}_{1})_{i,j}-(\unicode[STIX]{x1D719}_{1})_{i-2,j}}{2\triangle \bar{x}}.\end{eqnarray}$$
If  $f_{c}<0$ and
 $f_{b}<0$, then (3.29) is elliptic at the grid point and central differencing is used for discretization of the
 $\bar{x}$ derivatives in (4.2). If
 $f_{c}>0$ and
 $f_{b}>0$, then (3.29) is hyperbolic and backward differencing is used for discretization of the
 $\bar{x}$ derivatives in (4.2).
If  $f_{c}<0$ and
 $f_{b}>0$, then
 $i,j$ is a shock wave point and a mixed difference scheme is used:
 $$\begin{eqnarray}\left.\begin{array}{@{}c@{}}\displaystyle {(\unicode[STIX]{x1D719}_{1\bar{x}})^{M}}_{i+1/2,j}=\frac{(\unicode[STIX]{x1D719}_{1})_{i+1,j}-(\unicode[STIX]{x1D719}_{1})_{i,j}}{\triangle \bar{x}},\quad {(\unicode[STIX]{x1D719}_{1\bar{x}})^{M}}_{i-1/2,j}=\frac{(\unicode[STIX]{x1D719}_{1})_{i-1,j}-(\unicode[STIX]{x1D719}_{1})_{i-2,j}}{\triangle \bar{x}}\\ \displaystyle {(\bar{g}_{1\bar{x}})^{M}}_{i,j}=\frac{(\bar{g}_{1})_{i+1,j}-(\bar{g}_{1})_{i,j}+(\bar{g}_{1})_{i-1,j}-(\bar{g}_{1})_{i-2,j}}{2\triangle \bar{x}}.\end{array}\right\}\end{eqnarray}$$
If  $f_{c}>0$ and
 $f_{b}<0$, then (3.29) is parabolic at the grid point and central differencing is used to discretize
 $(\unicode[STIX]{x1D719}_{1\bar{x}})_{i-1/2,j}$ and
 $(\bar{g}_{1\bar{x}})_{i,j}$, and backward differencing is used to discretize
 $(\unicode[STIX]{x1D719}_{1\bar{x}})_{i+1/2,j}$. In all cases,
 ${\tilde{y}}$-derivatives are discretized by a central difference scheme.
Airfoil surface boundary conditions (3.30) are implemented as  $(\unicode[STIX]{x1D719}_{1{\tilde{y}}})_{i,j+1/2}=F_{l}^{\prime }(x_{i})$ and
 $(\unicode[STIX]{x1D719}_{1{\tilde{y}}})_{i,j-1/2}=F_{u}^{\prime }(x_{i})$ in finite-difference equations along lines
 $j=LA-1$ and
 $j=LA$, respectively, for
 $LE\leqslant i\leqslant TE$. Values of
 $\unicode[STIX]{x1D719}_{1}$ and
 $\unicode[STIX]{x1D719}_{1x}$ at the airfoil surfaces are obtained through simple extrapolation of computed results.
For non-lifting flows, the far-field conditions (3.30) are applied as  $(\unicode[STIX]{x1D719}_{1{\tilde{y}}})_{i,j-1/2}=0$ in the finite-difference equations at grid line
 $j=1$, as
 $(\unicode[STIX]{x1D719}_{1{\tilde{y}}})_{i,j+1/2}=0$ in the finite-difference equations at grid line
 $j=M_{y}$, as
 $(\unicode[STIX]{x1D719}_{1\tilde{x}})_{i-1/2,j}=0$ in the finite-difference equations at grid line
 $i=1$ and as
 $(\unicode[STIX]{x1D719}_{1\tilde{x}})_{i+1/2,j}=0$ in the finite-difference equations at grid line
 $i=M_{x}$. For lifting flows, a far-field analytical approximation of the solution is used (see Krupp & Murman Reference Krupp and Murman1972) on the boundaries of the computational domain. A jump in
 $\unicode[STIX]{x1D719}_{1}$ across the wake (i.e.
 ${\tilde{y}}=0,\bar{x}>1$) is incorporated in the iterative solver to represent the circulation of flow around the airfoil. It is noted that the axial and transverse velocities are continuous across the wake.
An explicit iterative solver is used to solve (4.2). An initial guess of  $\unicode[STIX]{x1D719}_{1}=0$ and
 $\bar{g}_{1}=0$ at all grid points is used to start the iterative solver. The solver works in two steps, first (4.2) is solved iteratively until a converged solution of
 $\unicode[STIX]{x1D719}_{1}$ is obtained (i.e. absolute relative change in
 $\unicode[STIX]{x1D719}_{1}$ at all grid points is smaller than
 $10^{-7}$). Then this solution of
 $\unicode[STIX]{x1D719}_{1}$ is used to calculate the pressure and temperature at all computational points. These thermodynamic properties are then used to calculate the condensation parameters
 $\bar{J}_{1}$,
 $\text{d}\bar{r}/\text{d}\bar{t}$ and
 $\bar{r}_{0}$ at all computational points. Then, (3.32)–(3.35) are integrated along each grid line
 $j$ by Simpson’s rule iteratively until the absolute change in
 $\bar{g}_{1}$ at all grid points is smaller than
 $10^{-10}$. The far-field equation (3.38) is used to initiate the integration. This constitutes a global iteration. This two-step process of each global iteration is repeated until global convergence criteria are met, i.e.
 $\text{max}_{i,j}|\unicode[STIX]{x1D719}_{1i,j,n}-\unicode[STIX]{x1D719}_{1i,j,n-1}|/|\unicode[STIX]{x1D719}_{1i,j,n-1}|<10^{-7}$ and
 $\text{max}_{i,j}|\bar{g}_{1i,j,n}-\bar{g}_{1i,j,n-1}|<10^{-10}$, where
 $n$ is a global iteration number. For lifting flows, the relative change in absolute value of circulation was found to be less than
 $10^{-7}$ upon convergence.
The solution of the extended TSD model effectively describes the flow and condensation fields in all regions other than the nose region (of the order of  $\unicode[STIX]{x1D716}^{2}$). In the present numerical calculations, the approach of Rusak (Reference Rusak1993) is used to remove the nose singularity from the TSD solution and form a composite solution of the flow. This composite solution consists of an inner solution (which describes the flow in the nose region) and an outer solution (which describes the flow in regions away from the nose). To obtain the inner solution, dry flow of water at a sonic upstream Mach number and at zero angle of attack around an infinite canonic parabola was solved. The present TSD model solution was used as the outer solution. Overlapping of the inner solution with the outer solution was done to ensure smooth transition of the pressure coefficient as the flow moves from the nose region to regions far away from nose. Details of the approach can be found in Rusak (Reference Rusak1993) as well as Lee & Rusak (Reference Lee and Rusak2000). The current numerical method is second-order accurate in space, with the exception of being first-order accurate across shock waves.
5 Computed results
5.1 Grid convergence studies
Convergence of the current numerical algorithm upon mesh refinement is studied first. We focus on a representative example of a steady wet steam flow around a NACA0012 airfoil ( $c=0.1~\text{m}$,
 $\unicode[STIX]{x1D716}=0.12$) at zero angle of attack that is computed using several progressively refined meshes. The uniform upstream conditions of this flow problem are described by
 $T_{\infty }=450~\text{K}$,
 $p_{\infty }=1.2~\text{MPa}$ (
 $S_{\infty }=1.28$) and
 $M_{\infty }=0.8$. Stagnation conditions of the upstream fluid are given by
 $T_{0}=501~\text{K}$,
 $p_{0}=1.87~\text{MPa}$ and
 $\unicode[STIX]{x1D6F7}_{0}=69.4\,\%$. For this case, the similarity parameters are
 $K=1.48,h_{fg}(T_{\infty })/[K_{3}C_{vv}T_{\infty }(1+K_{r})]=2.035,K_{G}=2.20,n_{c}=18.14$ and
 $K_{t}=5.88\times 10^{5}$. For this problem, the flow and thermodynamic fields are symmetrical about the
 $x$ axis, so only the upper half of the computational flow domain is considered with dimensions
 $3c$ (along the
 $\bar{x}$ axis) and
 $3c$ (along the
 ${\tilde{y}}$ axis). The upstream boundary of the domain is placed
 $1c$ ahead of the leading edge of the airfoil; the downstream boundary is placed
 $1c$ behind the trailing edge; the top boundary is placed
 $3c$ over the airfoil whereas the bottom boundary coincides with the chord of the airfoil. The different mesh sizes chosen for the convergence study are: 300 (along the
 $\bar{x}$ axis)
 $\times$ 150 (along the
 ${\tilde{y}}$ axis),
 $300\times 200$,
 $450\times 200$,
 $450\times 300$ and
 $600\times 300$. The computed distributions of the pressure coefficient (
 $-C_{p}$) and the condensate mass fraction (
 $g$) at the airfoil surface for the selected meshes are presented in figures 3 and 4, respectively. Figure 5 shows the pressure–temperature (
 $p{-}T$) phase diagram for a streamline along the airfoil surface for several mesh sizes. Also shown for reference in figure 5 is the vapour–liquid saturation pressure (
 $p_{g}$) line. The numerical results converge upon mesh refinement. From figures 3, 4 and 5, it can be noticed that the numerical solutions of
 $-C_{p},g$ and the
 $p{-}T$ line computed by the various meshes are close to each other. The numerical results from using a
 $450\times 300$ mesh are within 1 % of the corresponding numerical results from using a finer mesh i.e.
 $600\times 300$. It is therefore concluded that a 450
 $\times$ 300 mesh provides grid-converged computations for non-lifting wet steam flows around airfoils. Figures 6 and 7 show the distributions of local supersaturation ratio (
 $S$) and nucleation rate (
 $J$) along a streamline close to the airfoil surface for the chosen mesh, respectively.
Distribution of  $-C_{p}$ at the NACA0012 airfoil surface for wet steam flow at
 $S_{\infty }=1.28$,
 $T_{\infty }=450~\text{K}$,
 $M_{\infty }=0.8$ and
 $\unicode[STIX]{x1D6E9}=0$ using several meshes (points 1–3 and 9 are beyond the scale of the figure).

Distribution of  $g$ at the NACA0012 airfoil surface for wet steam flow at
 $S_{\infty }=1.28$,
 $T_{\infty }=450~\text{K}$,
 $M_{\infty }=0.8$ and
 $\unicode[STIX]{x1D6E9}=0$ using several meshes (points 1–3 are beyond the scale of the figure).

The  $p{-}T$ phase diagram along the NACA0012 airfoil surface for wet steam flow at
 $S_{\infty }=1.28$,
 $T_{\infty }=450~\text{K}$,
 $M_{\infty }=0.8$ and
 $\unicode[STIX]{x1D6E9}=0$ using several meshes.

Enlarging the computational domain along the  $\bar{x}$ and
 ${\tilde{y}}$ directions provides numerical results which are within 2 % of the current numerical results. Using a far-field analytical approximation of the solution (Krupp & Murman Reference Krupp and Murman1972) on the boundaries of the computational domain for non-lifting flows, also gives numerical results within 2 % of the current TSD results. Similar behaviour was observed in past numerical studies of dry air flow with TSD theory (Cole & Cook Reference Cole and Cook1986). For flow problems with
 $K<1.5$ and
 $\unicode[STIX]{x1D6E9}<0.3$, the supersonic regions of dry air flows over NACA0012 airfoils lie below
 $\bar{y}=1$ (Krupp Reference Krupp1972). The computational domain with dimensions
 $3$ (along
 $\bar{x}$ axis) and
 $3$ (along
 ${\tilde{y}}$ axis) provides a good balance between accuracy of predictions and computational costs.
Distribution of supersaturation ratio ( $S$) along a streamline close to the NACA0012 airfoil surface for wet steam flow at
 $S_{\infty }=1.28$,
 $T_{\infty }=450~\text{K}$,
 $M_{\infty }=0.8$ and
 $\unicode[STIX]{x1D6E9}=0$ (point 1 is beyond the scale of the figure).

Distribution of nucleation rate ( $J$) along a streamline close to the NACA0012 airfoil surface for wet steam flow at
 $S_{\infty }=1.28$,
 $T_{\infty }=450~\text{K}$,
 $M_{\infty }=0.8$ and
 $\unicode[STIX]{x1D6E9}=0$ (points 1–3 and 7–9 are beyond the scale of the figure).

Figures 3–7 help in understanding the physical and thermodynamic behaviour of the flow. Important characteristic states in the flow are marked with points numbered from 1 to 9. The stagnation reservoir conditions are denoted by point 1 ( $T_{0}=501~\text{K}$,
 $p_{0}=1.87~\text{MPa}$ and
 $\unicode[STIX]{x1D6F7}_{0}=69.4\,\%$). The upstream flow (point 2) ahead of the airfoil (
 $\bar{x}<0$) is decelerated, compressed and reaches stagnation at the airfoil’s leading edge (point 3). This results in maximum values of local pressure and temperature at the leading edge. Flow is in a superheated state in this region, preventing condensation occurring (see point 3 in figure 6). Flow then expands as it accelerates along the airfoil surface. As velocity increases, local pressure and temperature decrease, which leads to the flow becoming supersaturated (
 $S>1$). Substantial homogeneous nucleation is initiated on the airfoil surface (see point 4 in figure 7). Flow continues to accelerate and becomes sonic (point 5). Flow velocity increases and pressure decreases until it reaches minimum values of local pressure and temperature (
 $p=0.83~\text{MPa}$,
 $T=424~\text{K}$) at
 $\bar{x}\sim 0.15$ (point 6). The flow attains the maximum supersaturation ratio (see point 6 in figure 6) at this point, which is commonly referred to as the Wilson point. This marks the onset of macroscopic heat release due to condensation and related compression of the flow.
Condensate mass fraction  $g$ increases from 0 in a nearly constant pressure process. The temperature is increased from 424 K at
 $\bar{x}=0.15$ to 445 K at
 $\bar{x}=0.4$ (point 7) at which the flow is nearly saturated (
 $p\sim p_{g}(T)$). Condensate mass fraction also attains its maximum value (
 $g\sim 0.027$). At
 $\bar{x}\sim 0.4$ (point 7), a shock wave occurs and the flow is compressed from
 $p=0.83~\text{MPa}$,
 $T=445~\text{K}$ to
 $p=1.04~\text{MPa}$,
 $T=459~\text{K}$ (point 8) and liquid droplets evaporate across the shock wave. The flow exhibits the classical Zierep shock wave behaviour downstream of the shock wave for
 $0.41\leqslant \bar{x}\leqslant 0.54$ where the pressure and temperature decrease and then increase with distance from the shock wave. Yet, evaporation continues and
 $g$ decreases in this range. For
 $0.54<\bar{x}<1$, water vapour compresses at near saturation conditions and evaporation of liquid droplets continues as flow decelerates along the airfoil towards the trailing edge (point 9). Behind the trailing edge, flow is accelerated, pressure and temperature decrease and condensation is re-initiated because
 $S$ becomes greater than 1 (see point 9 in figure 6). Far downstream of the airfoil,
 $g$ reaches a nearly constant value of 0.013 and a wake of saturated liquid trails behind the airfoil. All other flow cases presented in the following sections and figures follow similar flow and condensation processes.
Contours of  $C_{p}$ (solid line) and
 $g$ (dashed line) for wet steam flow around a NACA0012 airfoil (
 $c=0.1~\text{m}$) at
 $S_{\infty }=1.28$,
 $M_{\infty }=0.8$,
 $T_{\infty }=450~\text{K}$ and
 $\unicode[STIX]{x1D6E9}=0$.

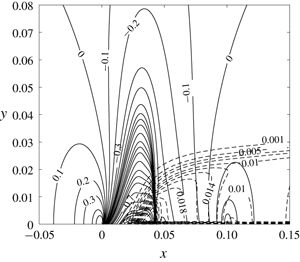
Figure 8 shows the mesh-converged solution of the contours of the pressure coefficient  $C_{p}$ (solid contours) and the condensate mass fraction
 $g$ (dashed contours) in the airfoil’s near field at the given flow conditions. The flow around the shock wave at
 $x\sim 0.4c$ is apparent from the coalescence of
 $C_{p}$ contour lines. The shock wave also spreads in the transverse direction up to
 $y\sim 0.03~\text{m}$. The condensation region starts on the airfoil surface at
 $x\sim 0.15c$ and spreads downstream as well as in the transverse direction to form a saturated parallel condensation zone with transverse size
 $y\sim 0.03~\text{m}$.
For flows around airfoils at small angles of attack, a rectangular computational domain centred around the airfoil with dimensions  $3c$ (along
 $\bar{x}$ axis) and
 $6c$ (along
 ${\tilde{y}}$ axis) is used. The upstream boundary of this domain is placed
 $1c$ ahead of the leading edge of the airfoil; the downstream boundary is placed
 $1c$ behind the trailing edge; the top boundary is placed
 $3c$ above the airfoil whereas the bottom boundary is placed
 $3c$ below the airfoil. Grid convergence studies for a flow problem with upstream conditions as described above and with
 $\unicode[STIX]{x1D703}=1.5^{\circ }$ reveal that a
 $450\times 600$ mesh provides grid-converged results and this mesh is used in all computations of lifting wet steam flows around airfoils with
 $|\unicode[STIX]{x1D703}|\leqslant 2^{\circ }$.
We also emphasize that, when compared with homogeneously condensing flow of humid air around the same airfoils (such as circular arcs) in the same Mach number regime ( $M_{\infty }\sim 0.8$) and operating at similar flow conditions, diabatic compressions inside local supersonic regimes in steam flow are much weaker. For example, the present computations with external steam flows around airfoils do not depict any local recompression regions or two separated local supersonic regimes terminated by shock waves, as was found in the numerical computations of Schnerr & Dohrmann (Reference Schnerr and Dohrmann1990, Reference Schnerr and Dohrmann1994). The steam flow case is different from the humid air flow case. The difference is due to several reasons. First, since in the steam flow case there is no carrier gas of the water content, the right-hand side of the TSD equation is different from that of the humid air case; compare (3.29) of the present paper with (35) in Rusak & Lee (Reference Rusak and Lee2000a). The heat release of condensation goes from steam to air in the humid air case while in the steam flow case, it goes directly from the condensate to the water vapour, which has a lower specific heat ratio
 $\unicode[STIX]{x1D6FE}_{v}$ than air. Second, all the humid air cases are characterized by upstream pressure that is atmospheric and below and temperatures are relatively low (below 270 K). However, in the steam flow cases studied in this paper, upstream pressure and temperature are much higher and therefore characterized by higher
 $C_{vv}$, lower
 $\unicode[STIX]{x1D6FE}_{v}$ and lower
 $h_{fg}$ which lead to much weaker nonlinear effects and heat release from condensation to the vapour.
5.2 Computed examples
In engineering applications that employ high-speed steam flows, it is necessary to predict the flow behaviour and the resulting wave drag of the airfoils or blades, in an attempt to reduce the drag for higher energy efficiency of the system. The upstream flow and thermodynamic conditions of steam and the airfoil’s geometry and angle of attack are the primary parameters that determine the real-gas flow and condensation fields, and consequently the airfoil’s wave drag. With this purpose, the present TSD model of steam flow is used to conduct parametric studies where each one of these parameters is varied independently and their effects on flow and condensation physics are analysed.
First, the effects of varying upstream temperature ( $T_{\infty }$) in the range of 375–450 K at fixed values of
 $S_{\infty }=1.3$ and
 $M_{\infty }=0.8$ for wet steam flow over a NACA0012 airfoil (
 $c=0.1~\text{m}$,
 $\unicode[STIX]{x1D716}=0.12$) at
 $\unicode[STIX]{x1D6E9}=0$ are studied. Table 1 lists the values of similarity parameters
 $n_{c}$,
 $K_{t}$,
 $K_{G}$,
 $h_{fg}(T_{\infty })/[K_{3}C_{vv}T_{\infty }(1+K_{r})]$, upstream pressure (
 $p_{\infty }$) and the stagnation properties of the upstream fluid (
 $p_{0}$,
 $T_{0}$ and
 $\unicode[STIX]{x1D6F7}_{0}$) for several flow cases. Note that
 $K=1.48$ for all the cases. From table 1, it can be noticed that
 $K_{G}$ decreases slightly as a result of a change in
 $T_{\infty }$ within the given range, whereas the changes in
 $n_{c}$,
 $K_{t}$,
 $h_{fg}(T_{\infty })/[K_{3}C_{vv}T_{\infty }(1+K_{r})]$ and
 $p_{\infty }$ are more pronounced. It is therefore expected that condensation increases as
 $T_{\infty }$ increases at the described conditions.
Distribution of  $-C_{p}$ at the NACA0012 airfoil surface for wet steam flow at
 $S_{\infty }=1.3$,
 $M_{\infty }=0.8$,
 $\unicode[STIX]{x1D6E9}=0$ and several
 $T_{\infty }$.

Values of  $n_{c},K_{t},K_{G},h_{fg}(T_{\infty })/[K_{3}C_{vv}T_{\infty }(1+K_{r})]$,
 $p_{\infty }$,
 $p_{0}$,
 $T_{0}$ and
 $\unicode[STIX]{x1D6F7}_{0}$ for various
 $T_{\infty }$ at the given conditions.

Distribution of  $g$ at the NACA0012 airfoil surface for wet steam flow at
 $S_{\infty }=1.3$,
 $M_{\infty }=0.8$,
 $\unicode[STIX]{x1D6E9}=0$ and several
 $T_{\infty }$.

Figures 9 and 10 depict the  $-C_{p}$ and
 $g$ distributions at the airfoil surface. A
 $p{-}T$ phase diagram for a streamline along the airfoil surface for the various flow cases is presented in figure 11. Also shown for reference in figure 11 is the vapour–liquid saturation pressure (
 $p_{g}$) line to help visualize the regions where the flow is supersaturated. From figures 9 and 10, it can be observed that the condensation region on the airfoil surface increases in terms of axial extent and magnitude of
 $g$ with an increase in
 $T_{\infty }$. At
 $T_{\infty }=375~\text{K}$, the condensation region and the amount of condensate mass fraction are relatively small and affect the pressure and temperature distributions negligibly. At
 $T_{\infty }=450~\text{K}$, the region of condensation and size of
 $g$ are significant and affect the pressure and temperature distributions notably. As
 $T_{\infty }$ increases, the characteristic length of condensation
 $l_{c}$ decreases (see (3.2)) which causes
 $n_{c}$ to decrease. This leads to an increase in nucleation rate
 $\bar{J}_{1}$. Also,
 $u_{c}$ increases (see (3.2)); this, along with the decrease in
 $l_{c}$, reduces the characteristic condensation time
 $t_{c}$. This causes a considerable increase in
 $K_{t}$ (see (3.37)). Combined effects of changes in
 $\bar{J}_{1}$ and
 $K_{t}$ result in increased condensation as
 $T_{\infty }$ increases. It can also be observed that the point of condensation onset moves upstream along the airfoil surface with an increase in
 $T_{\infty }$. The effect of condensation on the pressure field is clearly visible in figure 9. With increase in
 $T_{\infty }$, as the condensation region over the airfoil increases, the flow experiences increased compression in the supersonic region as a consequence of heat addition due to condensation of water vapour and increased expansion in the subsonic region as a result of heat absorption due to the evaporation of liquid droplets behind the shock wave. Therefore, as condensation increases, the shock wave strength decreases. The shock wave shifts upstream along the airfoil surface in the range
 $375\leqslant T_{\infty }\leqslant 400~\text{K}$ after which it moves downstream in the range
 $400\leqslant T_{\infty }\leqslant 450~\text{K}$. Behind the airfoil, condensation is reinitiated and
 $g$ achieves a fully developed value in the far wake.
The  $p{-}T$ phase diagram along the NACA0012 airfoil surface for wet steam flow at
 $\unicode[STIX]{x1D6E9}=0$,
 $S_{\infty }=1.3$,
 $M_{\infty }=0.8$ and several
 $T_{\infty }$.

Variation of  $C_{d}$ for steam flow around the NACA0012 airfoil at
 $S_{\infty }=1.3$,
 $M_{\infty }=0.8$,
 $\unicode[STIX]{x1D6E9}=0$ and several
 $T_{\infty }$.

Figure 12 shows that the pressure drag coefficient ( $C_{d}$) increases monotonically with an increase of
 $T_{\infty }$. The condensation affects the pressure distribution around the airfoil and subsequently, the wave drag in three major ways. First, due to condensation compression, the pressure in the increasing locally supersonic wet flow region increases; this causes the shock wave strength to reduce and wave drag decreases. Second, it shifts the shock wave along the airfoil surface. If the shock wave shifts downstream, drag increases, and if it shifts upstream, drag decreases. Third, as a result of heat absorption due to evaporation of liquid droplets downstream of the shock wave, pressure decreases, which increases the wave drag. In this case, the sum of the second and third effects dominates over the first effect and, thus, an almost linear increase in
 $C_{d}$ is observed with an increase in
 $T_{\infty }$ at the prescribed conditions. Also shown, for reference, in figure 12 are
 $C_{d}$ values for the adiabatic flow cases. Adiabatic flow solutions are computed by imposing a no condensation (
 $g=0$) condition in the whole domain. The adiabatic
 $C_{d}$ decreases as
 $T_{\infty }$ increases at a fixed
 $S_{\infty }$. This happens because the thermodynamic similarity parameter
 $K_{G}$ decreases with an increase in
 $T_{\infty }$, and causes the shock wave to shift upstream on the airfoil surface. The percentage difference between diabatic and adiabatic
 $C_{d}$ values increases from 11 % at
 $T_{\infty }=375~\text{K}$ to 50 % at
 $T_{\infty }=450~\text{K}$.
Zierep & Lin (Reference Zierep and Lin1967) derived a similarity law for the onset of condensation Mach number ( $M_{c}$) as it is related to the stagnation relative humidity (
 $\unicode[STIX]{x1D6F7}_{0}$),
 $$\begin{eqnarray}\unicode[STIX]{x1D6F7}_{0}^{a}=\frac{\displaystyle \frac{\unicode[STIX]{x1D6FE}_{e}+1}{2}}{\displaystyle 1+\frac{\unicode[STIX]{x1D6FE}_{e}-1}{2}M_{c}^{2}}.\end{eqnarray}$$
In (5.1),  $\unicode[STIX]{x1D6FE}_{e}$ is the effective specific heat ratio of the gas, and exponent
 $a$ has to be determined from numerical simulations or experiments. In this study, we use
 $\unicode[STIX]{x1D6FE}_{e}=K_{G}-1$. Note that
 $K_{G}$ changes primarily with a change in upstream temperature
 $T_{\infty }$. Figure 13 shows the results of the TSD computed condensation onset Mach number (circles and squares) as a function of
 $\unicode[STIX]{x1D6F7}_{0}$ for various
 $T_{\infty }$ at fixed values of
 $S_{\infty }=1.2$ and
 $S_{\infty }=1.3$. Also shown for the two fixed values of
 $S_{\infty }$, are the results of (5.1) (lines). The exponents are found to be
 $a=0.066$ for
 $S_{\infty }=1.2$, and
 $a=0.060$ for
 $S_{\infty }=1.3$. The exponent
 $a$ is found to be slightly dependent on
 $S_{\infty }$, thereby making a separate line for each
 $S_{\infty }$ value. The TSD results follow the similarity law (5.1) of Zierep & Lin (Reference Zierep and Lin1967) within a computational accuracy of 2 %.
Condensation onset Mach number ( $M_{c}$) versus stagnation relative humidity (
 $\unicode[STIX]{x1D6F7}_{0}$) for steam flows around the NACA0012 airfoil surface at
 $S_{\infty }=1.2$ and
 $S_{\infty }=1.3$,
 $M_{\infty }=0.8$,
 $\unicode[STIX]{x1D6E9}=0$ and several
 $T_{\infty }$.

Values of  $K_{t},K_{G},h_{fg}(T_{\infty })/[K_{3}C_{vv}T_{\infty }(1+K_{r})]$,
 $p_{\infty }$ and the stagnation conditions of fluid for various
 $S_{\infty }$ at the given conditions.

Next, we analyse the effects of varying the upstream supersaturation ratio ( $S_{\infty }$) in the range of 1.2–1.3 at constant values of
 $M_{\infty }=0.8$ and
 $T_{\infty }=450~\text{K}$ for wet steam flow around a NACA0012 airfoil (
 $c=0.1~\text{m}$,
 $\unicode[STIX]{x1D716}=0.12$) at
 $\unicode[STIX]{x1D6E9}=0$. Increasing the upstream supersaturation ratio
 $S_{\infty }$ at a fixed
 $T_{\infty }$, increases the upstream pressure
 $p_{\infty }$. Table 2 lists the values of
 $K_{t}$,
 $K_{G}$,
 $h_{fg}(T_{\infty })/[K_{3}C_{vv}T_{\infty }(1+K_{r})]$,
 $p_{\infty }$ and the stagnation conditions of upstream fluid for the various flow cases. Note that
 $n_{c}=18.14,K=1.48$ and
 $T_{0}=501~\text{K}$ for all the cases. As can be noticed from the values of the various similarity parameters,
 $h_{fg}(T_{\infty })/[K_{3}C_{vv}T_{\infty }(1+K_{r})]$ and
 $K_{G}$ do not vary by much over the range of
 $S_{\infty }$ studied, whereas
 $K_{t}$ shows a comparatively larger increase in values. We find that there is only negligible condensation at
 $S_{\infty }<1.2$. For these flow cases, the critical supersaturation ratio required for initiation of homogeneous nucleation is not attained in any flow region. The increase in
 $S_{\infty }$ is expected to increase condensation at the prescribed conditions.
Distribution of  $-C_{p}$ at the NACA0012 airfoil surface for wet steam flow at
 $\unicode[STIX]{x1D6E9}=0$,
 $T_{\infty }=450~\text{K}$,
 $M_{\infty }=0.8$ and several
 $S_{\infty }$.

Distribution of  $g$ at the NACA0012 airfoil surface for wet steam flow at
 $\unicode[STIX]{x1D6E9}=0$,
 $T_{\infty }=450~\text{K}$,
 $M_{\infty }=0.8$ and several
 $S_{\infty }$.

The  $p{-}T$ phase diagram along the surface of the NACA0012 airfoil for wet steam flow at
 $\unicode[STIX]{x1D6E9}=0$,
 $T_{\infty }=450~\text{K}$,
 $M_{\infty }=0.8$ and several
 $S_{\infty }$.

Variation of  $C_{d}$ for steam flow around the NACA0012 airfoil at
 $\unicode[STIX]{x1D6E9}=0$,
 $T_{\infty }=450~\text{K}$,
 $M_{\infty }=0.8$ and several
 $S_{\infty }$.

Figures 14 and 15 show the  $-C_{p}$ and
 $g$ distributions at the airfoil surface for the various flow cases. Figure 16 shows a
 $p{-}T$ phase diagram for a streamline along the airfoil surface for a few selected flow cases. From figure 14, it can be clearly noticed that the condensation compression effect on the flow dynamics increases as
 $S_{\infty }$ increases. Condensation compression in the supersonic region of the flow and evaporative expansion in the subsonic region behind the shock wave reduces the strength of shock wave. Also, the shock wave shifts upstream on the airfoil surface in the range
 $1.2\leqslant S_{\infty }\leqslant 1.26$ after which it shifts downstream for
 $1.26\leqslant S_{\infty }\leqslant 1.3$. From figures 15 and 16, it can be noticed that the condensation region on the airfoil surface increases in axial size and magnitude of
 $g$ as
 $S_{\infty }$ increases above 1.2. This is primarily due to the flow experiencing higher local supersaturation ratio (
 $S$) values as
 $S_{\infty }$ increases, which results in higher values of nucleation rate
 $J$. The increase in
 $K_{t}$ with
 $S_{\infty }$ also contributes to an increase in condensation as
 $S_{\infty }$ increases. Also, the point of initiation of condensation moves upstream with the increase of
 $S_{\infty }$, indicating that the critical supersaturation ratio required for spontaneous homogeneous nucleation is attained relatively upstream on the airfoil surface as
 $S_{\infty }$ increases. Figure 17 shows the nonlinear increase of
 $C_{d}$ with increase in
 $S_{\infty }$. Also shown, for comparison, in figure 17 are the values of
 $C_{d}$ for the adiabatic flow cases. The adiabatic
 $C_{d}$ values stay constant at the given conditions, and the percentage difference between the diabatic and adiabatic flows increases as
 $S_{\infty }$ increases, from 2 % at
 $S_{\infty }=1.2$ to 50 % at
 $S_{\infty }=1.3$ due to an increase in condensation. This can be explained by the collective drag-increasing effects of downstream shock wave movement and pressure reduction behind the shock wave (due to evaporative heat absorption) dominating the drag-reducing effect of condensation compression.
Condensation onset Mach number ( $M_{c}$) versus stagnation relative humidity (
 $\unicode[STIX]{x1D6F7}_{0}$) for steam flows around the NACA0012 airfoil surface at
 $T_{\infty }=400~\text{K}$ and
 $T_{\infty }=450~\text{K}$,
 $M_{\infty }=0.8$,
 $\unicode[STIX]{x1D6E9}=0$ and several
 $S_{\infty }$.

Figure 18 shows the results of TSD computed condensation onset Mach number (circles and squares) as a function of  $\unicode[STIX]{x1D6F7}_{0}$ for various
 $S_{\infty }$ at fixed values of
 $T_{\infty }=400~\text{K}$ and
 $T_{\infty }=450~\text{K}$. Also shown for the two fixed values of
 $T_{\infty }$ are the results of (5.1) (lines). The exponents are found to be
 $a=0.062$ for
 $T_{\infty }=400~\text{K}$, and
 $a=0.066$ for
 $T_{\infty }=450~\text{K}$. Note that
 $K_{G}=2.27$ (
 $\unicode[STIX]{x1D6FE}_{e}=1.27$) at
 $T_{\infty }=400~\text{K}$ and
 $K_{G}=2.20$ (
 $\unicode[STIX]{x1D6FE}_{e}=1.20$) at
 $T_{\infty }=450~\text{K}$. Therefore, we have a separate line for each value of
 $T_{\infty }$. The TSD results show good agreement, within a computational accuracy of 2 %, with the similarity law (5.1) of Zierep & Lin (Reference Zierep and Lin1967).
The effects of independently varying the upstream Mach number ( $M_{\infty }$) of wet steam flow around a NACA0012 airfoil (
 $c=0.1~\text{m}$,
 $\unicode[STIX]{x1D716}=0.12$) at
 $\unicode[STIX]{x1D6E9}=0$ are also investigated. Various cases are solved where the upstream conditions are defined as
 $T_{\infty }=450~\text{K}$,
 $S_{\infty }=1.27$ and
 $M_{\infty }$ ranges from 0.78 to 0.83. For all these flow problems,
 $p_{\infty }=1.18~\text{MPa}$,
 $n_{c}=18.14$,
 $h_{fg}(T_{\infty })/[K_{3}C_{vv}T_{\infty }(1+K_{r})]=2.034$ and
 $K_{G}=2.203$. Values of
 $K$,
 $K_{t}$ and the stagnation conditions of fluid for the various flow cases are provided in table 3. Both
 $K$ and
 $K_{t}$ decrease with increase of
 $M_{\infty }$. Flow is subsonic and there is no condensation for
 $M_{\infty }<0.76$. It is expected that the supersonic zone over the airfoil increases, the location of the shock wave is pushed downstream and the shock wave becomes stronger with increase of
 $M_{\infty }$ above 0.76. Thereby, within the subsonic range, the condensation region and size of
 $g$ also increase with
 $M_{\infty }$. The transonic similarity parameter
 $K$ decreases with an increase of
 $M_{\infty }$. This increases the relative effect of nonlinear terms in (3.29) on the flow and condensation physics.
Distribution of  $-C_{p}$ at the NACA0012 airfoil surface for wet steam flow at
 $\unicode[STIX]{x1D6E9}=0$,
 $T_{\infty }=450~\text{K}$,
 $S_{\infty }=1.27$ and several
 $M_{\infty }$.

Values of  $K$,
 $K_{t}$ and the stagnation conditions of fluid for various
 $M_{\infty }$ at the given conditions.

The distributions of  $-C_{p}$ and
 $g$ at the airfoil surface for several flow cases are shown in figures 19 and 20. A
 $p{-}T$ diagram for a streamline along the airfoil surface for the various flow cases is shown in figure 21. From figures 20 and 21, it can be observed that the condensation region and size of
 $g$ increase as
 $M_{\infty }$ increases. The point of condensation onset and the steady state value of
 $g$ in the far wake of the airfoil are the same for the various values of
 $M_{\infty }$. This occurs because the various flow cases have the same values of
 $n_{c}$, similar
 $S$ and
 $\bar{J}_{1}$ values in regions prior to condensation onset. This is also reflected in figure 21, which depicts that the various flow cases follow the same
 $p{-}T$ phase diagram in regions prior to condensation onset and in the far wake of the airfoil. Figure 19 depicts clearly the increasing effect of condensation compression on the supersonic flow. Figure 22 shows the nonlinear increase of diabatic and adiabatic
 $C_{d}$ with increasing values of
 $M_{\infty }$. This is expected as a result of the significant downstream movement and strengthening of the shock wave with an increase in
 $M_{\infty }$ and at fixed thermodynamic conditions. The difference between the adiabatic and diabatic
 $C_{d}$ increases until
 $M_{\infty }\leqslant 0.8$ and reduces as
 $M_{\infty }$ rises above 0.8. Condensation leads to an increase in wave drag for
 $M_{\infty }\leqslant 0.82$. However, at higher upstream Mach numbers
 $M_{\infty }\geqslant 0.83$, condensation results in a decrease in wave drag, primarily due to dominant effects of flow compression.
Distribution of  $g$ at the NACA0012 airfoil surface for wet steam flow at
 $\unicode[STIX]{x1D6E9}=0$,
 $T_{\infty }=450~\text{K}$,
 $S_{\infty }=1.27$ and several
 $M_{\infty }$.

The  $p{-}T$ phase diagram along the NACA0012 airfoil surface for wet steam flow at
 $\unicode[STIX]{x1D6E9}=0$,
 $T_{\infty }=450~\text{K}$,
 $S_{\infty }=1.27$ and several
 $M_{\infty }$.

Variation of  $C_{d}$ for steam flow around the NACA0012 airfoil at
 $\unicode[STIX]{x1D6E9}=0$,
 $T_{\infty }=450~\text{K}$,
 $S_{\infty }=1.27$ and several
 $M_{\infty }$.

Several flow cases are solved to understand the effects of increasing a small angle of attack ( $\unicode[STIX]{x1D703}$) on the steady flow and condensation fields of the steam flowing around the airfoil. In these problems, flows of supersaturated steam around a NACA0012 airfoil (
 $c=0.1~\text{m}$,
 $\unicode[STIX]{x1D716}=0.12$) with
 $T_{\infty }=450~\text{K}$,
 $p_{\infty }=1.12~\text{MPa}$ and
 $M_{\infty }=0.8$ are studied. For all cases,
 $T_{0}=501~\text{K}$,
 $p_{0}=1.75~\text{MPa}$,
 $\unicode[STIX]{x1D6F7}_{0}=65.2\,\%$,
 $K=1.48$,
 $K_{t}=5.49\times 10^{5}$,
 $K_{G}=2.206$,
 $n_{c}=18.14$ and
 $h_{fg}(T_{\infty })/[K_{3}C_{vv}T_{\infty }(1+K_{r})]=2.026$. We study cases with
 $\unicode[STIX]{x1D703}=0^{\circ },0.5^{\circ },1^{\circ }$ and
 $1.5^{\circ }$, for which
 $\unicode[STIX]{x1D6E9}=\unicode[STIX]{x1D703}/\unicode[STIX]{x1D716}=0,0.073,0.145$ and 0.218, respectively. Figure 23(a,b) presents distributions of
 $-C_{p}$ on the suction and pressure surfaces of the airfoil, respectively. With increase of
 $\unicode[STIX]{x1D703}$, the flow on the suction surface accelerates to higher supersonic speeds while the flow on the pressure surface decelerates and even becomes subsonic. Consequently, the shock wave shifts downstream on the suction surface and becomes stronger while the shock wave shifts upstream on the pressure surface and becomes weaker as
 $\unicode[STIX]{x1D703}$ increases. Shock wave disappears on the pressure surface for
 $\unicode[STIX]{x1D703}>1^{\circ }$.
Distribution of  $-C_{p}$ at (a) suction and (b) pressure surfaces of NACA0012 airfoil for steam flow at
 $T_{\infty }=450~\text{K}$,
 $S_{\infty }=1.2$,
 $M_{\infty }=0.8$ and several
 $\unicode[STIX]{x1D703}$.

Distribution of  $g$ at the suction surface of NACA0012 airfoil for wet steam flow at
 $T_{\infty }=450~\text{K}$,
 $S_{\infty }=1.2$,
 $M_{\infty }=0.8$ and several
 $\unicode[STIX]{x1D703}$.

Figure 24 shows the distribution of  $g$ on the suction surface. As
 $\unicode[STIX]{x1D703}$ increases, the condensation region expands on the suction surface with higher values of
 $g$. This happens because of the coupled interaction between flow acceleration on the suction surface and the corresponding pressure and temperature reduction (as noticed in figure 23a,b). This results in the flow attaining higher supersaturation ratio (
 $S$) values in the supersonic region on the suction surface, which lead to higher nucleation rates (
 $J$) and hence higher
 $g$ values. The point of condensation onset also drifts upstream on the airfoil surface with an increase of
 $\unicode[STIX]{x1D703}$. This is because with an increase of
 $S$, the flow attains the critical supersaturation ratio value required for initiation of homogeneous nucleation relatively upstream on the airfoil surface. Note that the condensate mass fraction attains the same steady state value (
 ${\sim}0.009$) in the far wake of the airfoil irrespective of
 $\unicode[STIX]{x1D703}$. In tandem, condensation on the pressure surface becomes negligible with a decrease of velocity and increase of pressure and temperature, and is therefore not shown. Figure 25 shows that the pressure drag coefficient (
 $C_{d}$) increases monotonically with increase of
 $\unicode[STIX]{x1D703}$. As
 $\unicode[STIX]{x1D703}$ increases, the downstream shift in shock wave position, strengthening of the shock wave and reduction in pressure in the supersonic region on the suction surface dominate the increase of wave drag. Also shown for comparison are the values of
 $C_{d}$ for the adiabatic flow cases. With an increase of angle of attack and consequent increase in condensation, the percentage difference between the
 $C_{d}$ of diabatic and adiabatic flow cases increases from 4 % at
 $\unicode[STIX]{x1D703}=0^{\circ }$ to 28 % at
 $\unicode[STIX]{x1D703}=1.5^{\circ }$. The ratios of lift to wave drag for the flow problems are given in table 4. Also given are values for the adiabatic flow cases. For fixed values of upstream flow conditions, the lift to wave drag ratio increases as angle of attack increases. Compared to the dry flow cases, the lift to drag ratio increases as a result of condensation. As the angle of attack increases and the amount of condensation on the suction surface of the airfoil increases, the jump in the lift to wave drag ratio compared to the corresponding dry flow case increases.
Variation of  $C_{d}$ for steam flow around the NACA0012 airfoil at
 $T_{\infty }=450~\text{K}$,
 $S_{\infty }=1.2$,
 $M_{\infty }=0.8$ and several
 $\unicode[STIX]{x1D703}$.

Ratio of lift to drag for various angles of attack at the given conditions.

A few cases are also solved to analyse the effects of airfoil geometry on the flow and condensation fields of wet steam flow over a thin airfoil. Upstream conditions for all the flow problems are  $T_{\infty }=450~\text{K}$,
 $p_{\infty }=1.21~\text{MPa}$ (
 $S_{\infty }=1.3$),
 $M_{\infty }=0.8$ and
 $\unicode[STIX]{x1D6E9}=0$. Stagnation conditions of the upstream fluid are given by
 $T_{0}=501~\text{K}$,
 $p_{0}=1.89~\text{MPa}$ and
 $\unicode[STIX]{x1D6F7}_{0}=70.2\,\%$. All airfoils have a thickness ratio of
 $0.12$ and a chord length of 0.1 m. The various airfoil geometries selected for analysis are: NACA0012 airfoil, circular arc airfoil, a modified airfoil (see, for shape function, Rusak & Lee (Reference Rusak and Lee2000b)) and an optimum critical airfoil of a sonic arc (see, for shape function, Rusak (Reference Rusak1995)).
The distributions of  $-C_{p}$ and
 $g$ on the various airfoils for a wet steam flow at the given conditions are presented in figures 26 and 27 respectively. For the NACA0012, circular arc and modified airfoils, the effect of condensation compression on the
 $-C_{p}$ distributions (see figure 26) causes a reduction in shock wave strength due to compression of supersonic flow and expansion of subsonic flow behind shock wave. The condensation region stretches widest for the NACA0012 airfoil with a higher value of maximum
 $g$. This is due to the curvature of the NACA0012 airfoil which allows the flow to achieve higher speeds, lower pressures and temperatures and higher supersaturation ratio values upon acceleration past the nose region. This also leads to onset of condensation at a point on the NACA0012 airfoil which is relatively upstream as compared to the other airfoils. Due to increased flow acceleration, the flow attains the critical supersaturation ratio required for initiation of homogeneous nucleation far upstream on the NACA0012 airfoil compared to other airfoils. Far downstream of the airfoil,
 $g$ reaches the same steady state value (
 ${\sim}0.013$) for these airfoils. It is noted that, at the given conditions, the sonic arc does not show any shock wave and condensation along the airfoil surface.
Distribution of  $-C_{p}$ at various airfoil surfaces for wet steam flow at
 $T_{\infty }=450~\text{K}$,
 $S_{\infty }=1.3$,
 $M_{\infty }=0.8$ and
 $\unicode[STIX]{x1D6E9}=0$.

Distribution of  $g$ at various airfoil surfaces for wet steam flow at
 $T_{\infty }=450~\text{K}$,
 $S_{\infty }=1.3$,
 $M_{\infty }=0.8$ and
 $\unicode[STIX]{x1D6E9}=0$.

The  $C_{d}$ values of the dry and wet steam flow around the various airfoils at the prescribed conditions are provided in table 5. Wave drag on the optimum critical sonic arc airfoil is found to be zero in both cases. Condensation leads to an increase in drag for the other airfoil geometries. The rise in drag for the circular arc is 0.0021, for the modified airfoil is 0.0015 and for the NACA0012 airfoil is 0.0027. The rise in wave drag is primarily due to the shift of shock wave position and reduction of pressure downstream of the shock wave.
Values of  $C_{d}$ for the various airfoils at the given conditions.

It is known that, due to the mass flow constraint of internal flows through nozzles and channels by walls (Schnerr & Dohrmann Reference Schnerr and Dohrmann1990, Reference Schnerr and Dohrmann1994), increasing the amount of heat addition due to condensation results in the initiation of self-excited high frequency oscillations in the flow. Identification of a similar stability limit in external flows remains a problem of interest. The current TSD theory helps in providing an insight into the limit of the amount of condensation heat release to the steam flow beyond which a steady state solution does not exist. The present computations are performed where steam at  $M_{\infty }=0.8$ flows around a NACA0012 airfoil (
 $c=0.1~\text{m}$,
 $\unicode[STIX]{x1D716}=0.12$) at
 $\unicode[STIX]{x1D6E9}=0$. Upstream supersaturation ratio
 $S_{\infty }$ is increased at a fixed
 $T_{\infty }$ until the computations show oscillations, fail to converge and provide a steady state solution. Table 6 lists the values of maximum upstream supersaturation ratio
 $S_{\infty }$ for which steady state solution at a particular
 $T_{\infty }$ exists according to the current TSD model. As
 $T_{\infty }$ is increased at fixed values of
 $M_{\infty }$ and airfoil geometry and angle of attack, the steady state limiting
 $S_{\infty }$ decreases. Increasing the heat addition to the steam flow beyond a certain amount, for example, beyond a maximum condensate mass fraction generation on the airfoil surface of 3 %, resulted in the numerical algorithm producing oscillations, and not converging to a steady state.
Values of maximum  $S_{\infty }$ for various
 $T_{\infty }$ at the given conditions.

Virk & Rusak (Reference Virk and Rusak2019) derived a transonic small-disturbance theory to describe the physics of pure steam flow with non-equilibrium and homogeneous condensation where thermodynamics of steam flow was modelled by the perfect-gas law. Comparisons of numerical results of the current TSD model which takes into account the real-gas effects with the perfect-gas model may provide meaningful insights into the sensitivity of the TSD numerical results to thermodynamic modelling of steam.
First, a flow problem is solved using the two TSD models where pure steam with free-stream conditions defined by  $M_{\infty }=0.8$,
 $T_{\infty }=375~\text{K}$ and
 $S_{\infty }=0.8$ (
 $p_{\infty }=0.87~\text{bar}$) flows around a NACA0012 airfoil (
 $c=0.1~\text{m}$,
 $\unicode[STIX]{x1D716}=0.12$) at zero angle of attack (
 $\unicode[STIX]{x1D6E9}=0$). The stagnation properties of the upstream fluid are:
 $p_{0}=1.23$ bar,
 $T_{0}=413~\text{K}$ and
 $\unicode[STIX]{x1D6F7}_{0}=34.3\,\%$. Similarity parameters for the flow problem are:
 $K=1.48$,
 $K_{t}=3.16\times 10^{4}$,
 $K_{G}=2.293$,
 $n_{c}=51.49$ and
 $h_{fg}(T_{\infty })/[K_{3}C_{vv}T_{\infty }(1+K_{r})]=2.99$. No condensation is observed in any flow region for both flow cases because the low upstream supersaturation ratio does not allow the flow to reach the critical supersaturation ratio required for initiation of homogeneous nucleation anywhere in the flow. The value of
 $K_{G}=2.29$ for a van der Waals gas is close to the perfect gas
 $K_{G}=\unicode[STIX]{x1D6FE}_{v}+1=2.33$, and the thermodynamics of steam flow in these flow conditions can be adequately described by the perfect-gas law. The solution of the two models nearly overlap in most of the flow region.
The numerical results of the van der Waals gas TSD model are also compared to perfect-gas TSD model for a condensing pure steam flow problem. For this, a pure steam flow around a NACA0012 airfoil ( $c=0.1~\text{m}$,
 $\unicode[STIX]{x1D716}=0.12$) at zero angle of attack (
 $\unicode[STIX]{x1D6E9}=0$) and at free-stream conditions defined by
 $M_{\infty }=0.8$,
 $T_{\infty }=375~\text{K}$ and
 $S_{\infty }=1.3$ (
 $p_{\infty }=1.41~\text{bar}$) is considered. The stagnation properties of fluid are
 $p_{0}=2.24~\text{bar}$,
 $T_{0}=426~\text{K}$ and
 $\unicode[STIX]{x1D6F7}_{0}=43.3\,\%$. Similarity parameters for the flow problem are
 $K=1.48$,
 $K_{t}=5.14\times 10^{4}$,
 $K_{G}=2.291$,
 $n_{c}=51.49$ and
 $h_{fg}(T_{\infty })/[K_{3}C_{vv}T_{\infty }(1+K_{r})]=3$.
Distribution of  $-C_{p}$ at the NACA0012 airfoil surface for wet steam flow at
 $T_{\infty }=375~\text{K}$,
 $S_{\infty }=1.3$,
 $M_{\infty }=0.8$ and
 $\unicode[STIX]{x1D6E9}=0$ according to the perfect-gas and van der Waals gas TSD models.

Distribution of  $g$ at the NACA0012 airfoil surface for wet steam flow at
 $T_{\infty }=375~\text{K}$,
 $S_{\infty }=1.3$,
 $M_{\infty }=0.8$ and
 $\unicode[STIX]{x1D6E9}=0$ according to the perfect-gas and van der Waals gas TSD models.

Figures 28 and 29 show the distributions of the pressure coefficient and condensate mass fraction along the airfoil surface, respectively. Figure 29 shows that the perfect-gas TSD model predicts higher condensation and the condensation initiation occurs relatively upstream in the flow compared to van der Waals gas TSD model. The shock wave for the van der Waals gas model is located upstream and does not show condensation compression effects as significant as in the perfect-gas model (see figure 28). Due to significant condensation in the supersonic region ahead of shock wave for the perfect gas, the shock wave also drifts downstream towards the trailing edge as the pressure is increased in the local supersonic region. The condensation compression ahead of shock wave and evaporation heat release behind the shock wave, together reduce the shock wave strength considerably for the perfect-gas case relative to the van der Waals gas solution. Thus, it can be concluded that the predictions according to TSD models are sensitive to the thermodynamic modelling of the gas for flows at high upstream pressures ( $p_{\infty }>2~\text{bar}$) and temperatures (
 $T_{\infty }>400~\text{K}$). Moreover, even for flows at low temperatures, which involve condensation initiation, thermodynamic sensitivity is significant, although without condensation there is not much difference between the predictions of the two TSD models. Real-gas behaviour needs to be considered in describing the flow thermodynamics under such conditions to improve modelling of the physical behaviour according to TSD theory.
6 Conclusions
A transonic small-disturbance model is derived to describe the near-sonic flow and thermodynamic properties of pure water vapour flow around a thin airfoil at a small angle of attack. A van der Waals gas model describes the real-gas thermodynamic behaviour of water vapour. An extended TSD equation (3.29) describes the flow field and is coupled with a set of ordinary differential equations (3.32)–(3.35) to model the condensation field. A numerical algorithm based on the method of Cole & Cook (Reference Cole and Cook1986) is used to iteratively solve the TSD equation and obtain predictions of the velocity, temperature and pressure fields of the flow. Simpson’s rule is used to integrate the ordinary differential equations and obtain the field of condensate mass fraction. The TSD solution exhibits a nose singularity, which is removed by the multiscale matched-asymptotic approach of Rusak (Reference Rusak1993). The analysis gives a list of similarity parameters that characterize the flow problem: the thickness ratio of the airfoil  $\unicode[STIX]{x1D716}$, the scaled angle of attack
 $\unicode[STIX]{x1D6E9}$, the classical transonic similarity parameter
 $K$, the real-gas similarity parameter
 $K_{G}$, the scaled latent heat of condensation
 $h_{fg}(T_{\infty })/[K_{3}C_{vv}T_{\infty }(1+K_{r})]$, the upstream flow supersaturation ratio
 $S_{\infty }$, the ratio of the time scales of convection to condensation
 $K_{t}$ and the number of molecules in a characteristic droplet
 $n_{c}$.
To understand the effects of upstream conditions on the thermodynamic and condensation fields of the flow, various wet steam flow problems around a NACA0012 airfoil are studied. In each one of these cases, the upstream conditions ( $T_{\infty },S_{\infty }$ and
 $M_{\infty }$) are varied over a given range independently. It is noticed that, with an increase in
 $T_{\infty }$ at constant values of
 $M_{\infty },S_{\infty }$ and
 $\unicode[STIX]{x1D703}$, the condensation region on the airfoil surface increases in terms of the expanse and magnitude of the condensate mass fraction. The point of initiation of condensation moves upstream as well. These effects are attributed to the increase in
 $K_{t}$ and decrease in
 $n_{c}$ as
 $T_{\infty }$ increases. The increased condensation compression in supersonic regions, and increased evaporative expansion in subsonic regions behind the shock wave, cause the strength of the shock wave to reduce. The wave drag coefficient (
 $C_{d}$) increases almost linearly with an increase in
 $T_{\infty }$. Similar effects are observed when
 $S_{\infty }$ is increased for fixed values of
 $M_{\infty },T_{\infty }$ and
 $\unicode[STIX]{x1D703}$. However, in this case, the increase in condensation is a result of higher local supersaturation values and an increase in
 $K_{t}$ with increase in
 $S_{\infty }$. The value of
 $C_{d}$ increases nonlinearly with an increase in
 $S_{\infty }$. The effects of independently increasing
 $M_{\infty }$ are the downstream movement and strengthening of the shock wave. Condensation region on the airfoil surface increases in terms of expanse and magnitude with an increase in
 $M_{\infty }$, although the point of condensation initiation remains unchanged. The TSD results also confirm the similarity law of Zierep & Lin (Reference Zierep and Lin1967), relating the condensation onset Mach number to upstream stagnation relative humidity, when an effective specific heats ratio (
 $\unicode[STIX]{x1D6FE}_{e}=K_{G}-1$) is used in (5.1).
Increasing the angle of attack ( $\unicode[STIX]{x1D703}$) for constant values of upstream conditions, results in higher condensation compression effects on the suction surface. This is caused by the increased flow acceleration on the suction surface, which leads to higher supersaturation ratios and higher nucleation rates. The point of condensation initiation also shifts upstream due to the same reason. The wave drag coefficient
 $C_{d}$ and lift coefficient
 $C_{l}$ increase monotonically with an increase in
 $\unicode[STIX]{x1D703}$. Comparing the flow and condensation fields of wet steam around airfoils with the same chord length and thickness ratio but with different geometries, reveals that NACA0012 airfoil produces the strongest shock wave and the highest condensation. The point of initiation of condensation for the NACA0012 airfoil is also relatively upstream compared to the circular arc and a modified airfoil. As a result,
 $C_{d}$ is highest for the NACA0012 airfoil. On the other hand, the optimum critical sonic arc airfoil exhibits no supersonic speeds or condensation and has zero wave drag.
Predictions according to the current TSD model were also compared with computations of the perfect-gas TSD model for steam flow with homogeneous condensation. For flows at low upstream temperature ( $T_{\infty }<400~\text{K}$) and with no condensation, the computed solutions according to the two models are almost the same. However, for flows which involve condensation, thermodynamic sensitivity is significant.
The present model is applicable to a steady, inviscid, two-dimensional and pure (free of foreign nuclei) steam flow at near-sonic speed around a thin airfoil (with small curvature and small thickness ratio) at a small angle of attack and with a small amount of condensation. The airfoil surface is also assumed to be smooth (and free of impurities) and does not have any thermodynamic interaction with the flow. The present model is applicable to flow problems with upstream pressures below 1.5 MPa and upstream temperatures below 450 K. Future studies will focus on incorporating the effects of a viscous boundary layer, surface energy and surface roughness of the airfoil into the TSD model. To deal with flows operating at higher temperatures and pressures, a more accurate equation of state may be used to model the real-gas thermodynamic behaviour. Unsteady effects shall also be included in the model to better understand the critical limit of condensation beyond which the flow and thermodynamic properties become oscillatory. An uncertainty analysis of the computed results with respect to the empirical correlations in the condensation model will be also be performed to relate results to practical applications.
Declaration of interests
The authors report no conflict of interest.
Supplementary material
Supplementary material is available at https://doi.org/10.1017/jfm.2019.945.



