





Introduction
An ever-increasing number of pathogenic genetic variants associated with atypical neurodevelopment is being identified (Lowther et al., Reference Lowther, Merico, Costain, Waserman, Boyd, Noor, Speevak, Stavropoulos, Wei, Lionel, Marshall, Scherer and Bassett2017; Malhotra & Sebat, Reference Malhotra and Sebat2012; Sun et al., Reference Sun, Noss, Banerjee, das and Girirajan2024). While each of these high-impact variants is individually rare, they collectively contribute substantially to neurodevelopmental morbidity (Sanders et al., Reference Sanders, Sahin, Hostyk, Thurm, Jacquemont, Avillach, Douard, Martin, Modi, Moreno-de-Luca, Raznahan, Anticevic, Dolmetsch, Feng, Geschwind, Glahn, Goldstein, Ledbetter, Mulle and Bearden2019). The 22q11.2 deletion is the most common recurrent pathogenic microdeletion, with an estimated prevalence of 1 in 2,000–4,000 (Blagojevic et al., Reference Blagojevic, Heung, Theriault, Tomita-Mitchell, Chakraborty, Kernohan, Bulman and Bassett2021); and has preceded the discovery of most other pathogenic variants by approximately two decades (McDonald-McGinn et al., Reference McDonald-McGinn, Sullivan, Marino, Philip, Swillen, Vorstman, Zackai, Emanuel, Vermeesch, Morrow, Scambler and Bassett2015). The 22q11.2 deletion syndrome (22q11DS) thus serves as a useful clinical model for the study of other pathogenic variants associated with aberrant neurodevelopment, and for variation in neurodevelopmental expression more generally (Fiksinski et al., Reference Fiksinski, Schneider, Zinkstok, Baribeau, Chawner and Vorstman2021c; Gur et al., Reference Gur, Bassett, McDonald-McGinn, Bearden, Chow, Emanuel, Owen, Swillen, van den Bree, Vermeesch, Vorstman, Warren, Lehner and Morrow2017; Insel, Reference Insel2010; Sommer et al., Reference Sommer, Bearden, van Dellen, Breetvelt, Duijff, Maijer, van Amelsvoort, de Haan, Gur, Arango, Díaz-Caneja, Vinkers and Vorstman2016). Among many organ systems that can be affected by 22q11DS (McDonald-McGinn et al., Reference McDonald-McGinn, Sullivan, Marino, Philip, Swillen, Vorstman, Zackai, Emanuel, Vermeesch, Morrow, Scambler and Bassett2015), brain-related psychiatric and developmental phenotypes are prominent and include schizophrenia spectrum disorders (SSDs; prevalence ~20–25%) (Fiksinski et al., Reference Fiksinski, Schneider, Murphy, Armando, Vicari, Canyelles, Gothelf, Eliez, Breetvelt, Arango and Vorstman2018b; Schneider et al., Reference Schneider, Debbane, Bassett, Chow, Fung, van den Bree, Owen, Murphy, Niarchou, Kates, Antshel, Fremont, McDonald-McGinn, Gur, Zackai, Vorstman, Duijff, Klaassen, Swillen and Eliez2014). The spectrum of intellectual functioning in individuals with 22q11DS is broad, ranging from severe ID to (above) average intellectual functioning (De Smedt et al., Reference De Smedt, Devriendt, Fryns, Vogels, Gewillig and Swillen2007). Diverse trajectories of cognitive development have been described, with, on average, a modest decline in IQ in early adolescence (Duijff et al., Reference Duijff, Klaassen, de Veye, Beemer, Sinnema and Vorstman2012b; Fiksinski et al., Reference Fiksinski, Bearden, Bassett, Kahn, Zinkstok, Hooper, Tempelaar, McDonald-McGinn, Swillen, Emanuel, Morrow, Gur, Chow, van den Bree, Vermeesch, Warren, Owen, van Amelsvoort, Eliez and Breetvelt2021a; Swillen & McDonald-McGinn, Reference Swillen and McDonald-McGinn2015), and a continued decline into older adulthood in some individuals (Evers et al., Reference Evers, van Amelsvoort, Candel, Boer, Engelen and Curfs2014).
In individuals with 22q11DS, studies of cognition have largely focused on overall IQ (i.e. Full Scale IQ [FSIQ]), and/or Verbal and Performance IQ (VIQ and PIQ, respectively), complementary to studies of various operationalizations of narrower neurocognitive domains (e.g. attention, executive functioning, motor performance, and visuospatial function) (Fiksinski et al., Reference Fiksinski, Breetvelt, Lee, Boot, Butcher, Palmer, Chow, Kahn, Vorstman and Bassett2018a, Goldenberg et al., Reference Goldenberg, Calkins, Richard, McDonald-McGinn, Zackai, Mitra, Emanuel, Devoto, Borgmann-Winter, Kohler, Conroy, Gur and Gur2012, Henry et al., Reference Henry, van Amelsvoort, Morris, Owen, Murphy and Murphy2002, Hooper et al., Reference Hooper, Curtiss, Schoch, Keshavan, Allen and Shashi2013, Maeder, J., et al., Reference Maeder, Schneider, Bostelmann, Debbane, Glaser, Menghetti, Schaer and Eliez2016, Morrison et al., Reference Morrison, Chawner, van Amelsvoort, Swillen, Vingerhoets, Vergaelen, Linden, Linden, Owen and van den Bree2020, van Amelsvoort et al., Reference van Amelsvoort, Henry, Morris, Owen, Linszen, Murphy and Murphy2004). However, in addition to VIQ and PIQ, the core domains of global cognitive functioning also include Processing Speed (PS) and Working Memory (WM) (Wechsler, Reference Wechsler2008). These components and their association with overall IQ have not yet been well studied in sufficiently large cohorts of individuals with 22q11DS, mostly due to limited availability of such data. This is a relevant knowledge gap: first, PS and WM are assessed independently from VIQ and PIQ in Wechsler IQ tests (i.e. with different tasks), while in almost all Wechsler versions they contribute equally to overall IQ (FSIQ). Second, PS and WM represent neuropsychological processes distinct from VIQ and PIQ and the real-life ramifications associated with scores on any of the four IQ domains are distinct (Wechsler, Reference Wechsler2003, Reference Wechsler2008). Third, these domains may be differentially associated with psychopathology (Leib et al., Reference Leib, Keezer, Cerny, Holbrook, Gallagher, Jennette, Ovsiew and Soble2021; Morrison et al., Reference Morrison, Chawner, van Amelsvoort, Swillen, Vingerhoets, Vergaelen, Linden, Linden, Owen and van den Bree2020; Oberauer, Schulze, Wilhelm, & Süß, Reference Oberauer, Schulze, Wilhelm and Süß2005; Schubert, Hagemann, & Frischkorn, Reference Schubert, Hagemann and Frischkorn2017).
Beyond 22q11DS, atypical levels and trajectories of cognitive functioning are inherent to virtually all known pathogenic genetic variants associated with atypical neurodevelopmental trajectories, often with significant but variable consequences for the daily functioning of affected individuals. In addition, parameters of cognitive functioning have been associated with psychopathology in people with 22q11DS, consistent with findings in the general population (Mollon et al., Reference Mollon, David, Zammit, Lewis and Reichenberg2018; Woodberry, Giuliano, & Seidman, Reference Woodberry, Giuliano and Seidman2008). Acting as a potential ‘magnifying lens’ (Fiksinski et al., Reference Fiksinski, Schneider, Zinkstok, Baribeau, Chawner and Vorstman2021c; Sanders et al., Reference Sanders, Sahin, Hostyk, Thurm, Jacquemont, Avillach, Douard, Martin, Modi, Moreno-de-Luca, Raznahan, Anticevic, Dolmetsch, Feng, Geschwind, Glahn, Goldstein, Ledbetter, Mulle and Bearden2019), such findings begin to provide insight into etiology and mechanisms of neurodevelopmental conditions. For example, previous studies using a partially overlapping cohort (IBBC 22q11DS) have demonstrated that in individuals with 22q11DS, a significant decline in IQ is not only phenotypically associated with subsequent risk of developing SSDs (Fiksinski et al., Reference Fiksinski, Bearden, Bassett, Kahn, Zinkstok, Hooper, Tempelaar, McDonald-McGinn, Swillen, Emanuel, Morrow, Gur, Chow, van den Bree, Vermeesch, Warren, Owen, van Amelsvoort, Eliez and Breetvelt2021a; Vorstman et al., Reference Vorstman, Breetvelt, Duijff, Eliez, Schneider, Jalbrzikowski, Armando, Vicari, Shashi, Hooper, Chow, Fung, Butcher, Young, McDonald-McGinn, Vogels, van Amelsvoort, Gothelf and Weinberger2015), but that it also shares, at least in part, the same genetic underpinnings (Davies et al., Reference Davies, Fiksinski, Breetvelt, Williams, Hooper, Monfeuga, Bassett, Owen, Gur, Morrow, McDonald-McGinn, Swillen, Chow, van den Bree, Emanuel, Vermeesch, van Amelsvoort, Arango and Armando2020. This finding suggests that cognitive decline is an early stage of the SSD disease trajectory, both in 22q11DS patients and in the idiopathic SSD population (Mollon et al., Reference Mollon, David, Zammit, Lewis and Reichenberg2018). Furthermore, the association with SSD risk in 22q11DS was most pronounced for a decline in VIQ versus PIQ, underlining the relevance of examining the different IQ domains, VIQ, PIQ, PS, and WM, independently.
Here, building on previous studies of IQ, including those in the 22q11DS dataset (Davies et al., Reference Davies, Fiksinski, Breetvelt, Williams, Hooper, Monfeuga, Bassett, Owen, Gur, Morrow, McDonald-McGinn, Swillen, Chow, van den Bree, Emanuel, Vermeesch, van Amelsvoort, Arango and Armando2020; Fiksinski et al., Reference Fiksinski, Bearden, Bassett, Kahn, Zinkstok, Hooper, Tempelaar, McDonald-McGinn, Swillen, Emanuel, Morrow, Gur, Chow, van den Bree, Vermeesch, Warren, Owen, van Amelsvoort, Eliez and Breetvelt2021a; Vorstman et al., Reference Vorstman, Breetvelt, Duijff, Eliez, Schneider, Jalbrzikowski, Armando, Vicari, Shashi, Hooper, Chow, Fung, Butcher, Young, McDonald-McGinn, Vogels, van Amelsvoort, Gothelf and Weinberger2015), we examine the complete cognitive IQ profile in individuals with 22q11DS, including the four key components of global cognitive functioning (VIQ, PIQ, PS, and WM) as defined by the Wechsler Intelligence Scales. We focus on the profile of these domains using the earliest available IQ assessment, capturing relative cognitive performance across domains at the first observed measurement point. In addition, we explore the cognitive profile over three different developmental stages, comparing children, adolescents, and adults. Given known associations between level of cognitive functioning and cognitive decline and SSD risk (Mollon et al., Reference Mollon, David, Zammit, Lewis and Reichenberg2018; Weinberger et al., Reference Weinberger, Yi, Calkins, Guri, McDonald-McGinn, Emanuel, Zackai, Ruparel, Carmel, Michaelovsky, Weizman, Gur, Gur and Gothelf2016), we also compare these profiles between individuals with 22q11DS with SSDs and without SSDs.
Methods
Participants and instruments
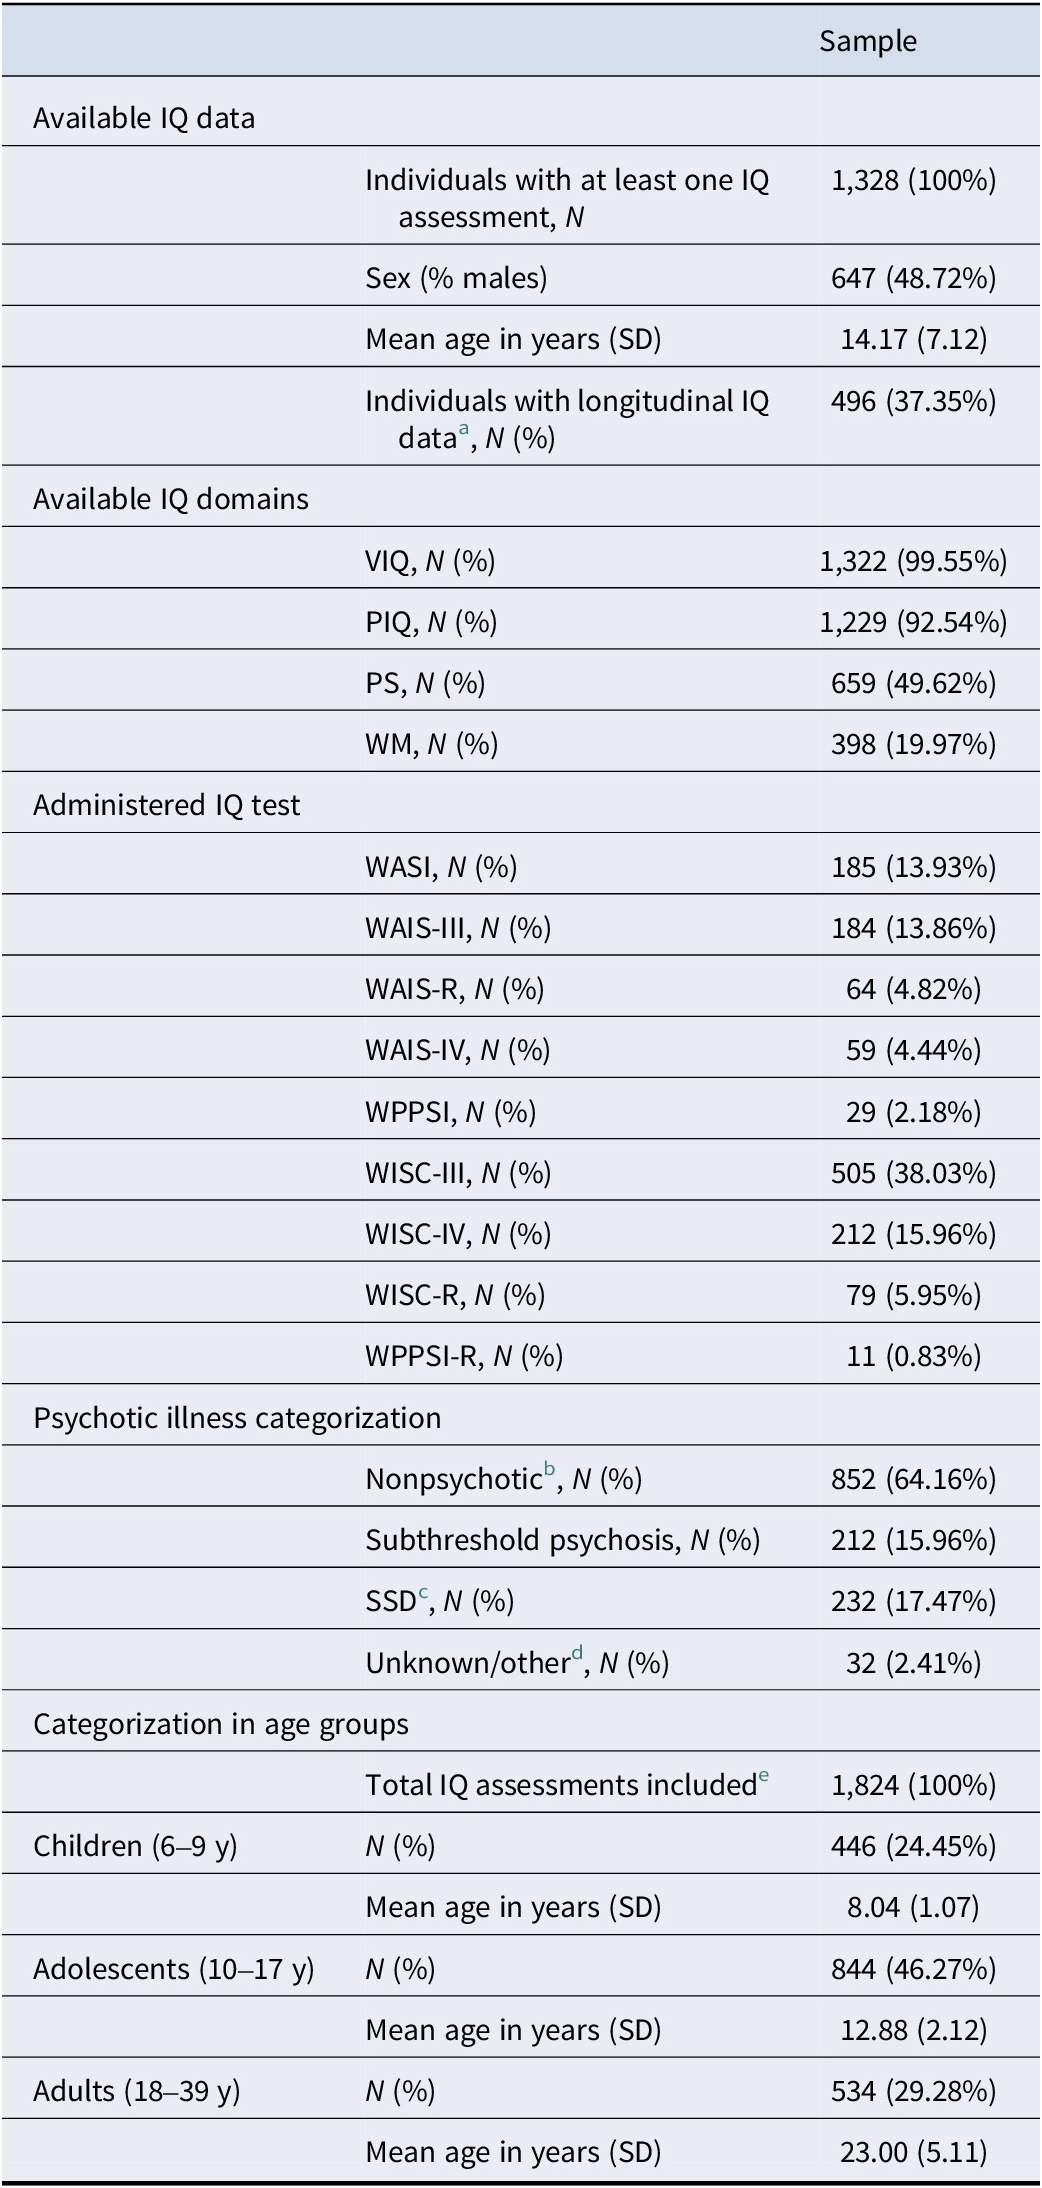
Participants were part of the international Brain and Behavior Consortium on 22q11DS (IBBC), an international collaboration that included 1,789 individuals with a molecularly confirmed 22q11.2 deletion (Gur et al., Reference Gur, Bassett, McDonald-McGinn, Bearden, Chow, Emanuel, Owen, Swillen, van den Bree, Vermeesch, Vorstman, Warren, Lehner and Morrow2017). We have previously reported on IQ data in this sample, not including PS and WM data (Davies et al., Reference Davies, Fiksinski, Breetvelt, Williams, Hooper, Monfeuga, Bassett, Owen, Gur, Morrow, McDonald-McGinn, Swillen, Chow, van den Bree, Emanuel, Vermeesch, van Amelsvoort, Arango and Armando2020; Fiksinski et al., Reference Fiksinski, Bearden, Bassett, Kahn, Zinkstok, Hooper, Tempelaar, McDonald-McGinn, Swillen, Emanuel, Morrow, Gur, Chow, van den Bree, Vermeesch, Warren, Owen, van Amelsvoort, Eliez and Breetvelt2021a; Vorstman et al., Reference Vorstman, Breetvelt, Duijff, Eliez, Schneider, Jalbrzikowski, Armando, Vicari, Shashi, Hooper, Chow, Fung, Butcher, Young, McDonald-McGinn, Vogels, van Amelsvoort, Gothelf and Weinberger2015). For the current study, at least one (Wechsler-based) assessment of IQ, including at least one of the four core IQ domains, was available in n = 1,328 individuals (n = 647 [48.72%] males). In line with previous work (Fiksinski et al., Reference Fiksinski, Bearden, Bassett, Kahn, Zinkstok, Hooper, Tempelaar, McDonald-McGinn, Swillen, Emanuel, Morrow, Gur, Chow, van den Bree, Vermeesch, Warren, Owen, van Amelsvoort, Eliez and Breetvelt2021a), we included participants aged between 6 and 39 years (mean = 14.17, SD = 7.12). Demographic details of the sample are described in Table 1. All individuals and, when appropriate, their legal guardians provided informed consent, and the local institutional research ethics boards approved the study of each site.
Descriptive data of total sample of 1,328 individuals with 22q11DS

Table 1. Long description
The table is organized into five main sections.
1. Available I Q data:
- Total individuals: 1,328 (100 percent).
- Sex: 647 males (48.72 percent).
- Mean age: 14.17 years with a standard deviation of 7.12.
- Individuals with longitudinal I Q data: 496 (37.35 percent).
2. Available I Q domains:
- V I Q: 1,322 (99.55 percent).
- P I Q: 1,229 (92.54 percent).
- P S: 659 (49.62 percent).
- W M: 398 (19.97 percent).
3. Administered I Q test:
- W I S C-III is the most frequent at 505 (38.03 percent), followed by W I S C-IV at 212 (15.96 percent), W A S I at 185 (13.93 percent), and W A I S-III at 184 (13.86 percent). Other tests include W A I S-R, W A I S-IV, W P P S I, W I S C-R, and W P P S I-R, each under 6 percent.
4. Psychotic illness categorization:
- Nonpsychotic: 852 (64.16 percent).
- Subthreshold psychosis: 212 (15.96 percent).
- S S D: 232 (17.47 percent).
- Unknown or other: 32 (2.41 percent).
5. Categorization in age groups (Total assessments = 1,824):
- Children (6 to 9 years): 446 (24.45 percent), mean age 8.04.
- Adolescents (10 to 17 years): 844 (46.27 percent), mean age 12.88.
- Adults (18 to 39 years): 534 (29.28 percent), mean age 23.00.
a This includes individuals who have one or more subsequent IQ assessment(s) in a different age category.
b Consistent with previous studies (Davies et al., 2020; Fiksinski et al., 2021a), individuals were included in the nonpsychotic group if they had never experienced psychotic symptoms nor psychotic illness, regardless their age, suggesting that a portion of individuals in the nonpsychotic group might still go on to develop psychosis as they mature. However, both previous results14, 30 and current data demonstrate no effect differences as a function of including or excluding nonpsychotic individuals based on their age at last psychiatric assessment (e.g. whether or not they were over 25 years, the age after which novel SSD onset is highly unlikely).
c SSD, schizophrenia spectrum disorder, including schizophrenia, schizoaffective disorder, delusional disorder, or psychotic disorder not otherwise specified.
d As previously described (Davies et al., Reference Davies, Fiksinski, Breetvelt, Williams, Hooper, Monfeuga, Bassett, Owen, Gur, Morrow, McDonald-McGinn, Swillen, Chow, van den Bree, Emanuel, Vermeesch, van Amelsvoort, Arango and Armando2020; Fiksinski et al., Reference Fiksinski, Bearden, Bassett, Kahn, Zinkstok, Hooper, Tempelaar, McDonald-McGinn, Swillen, Emanuel, Morrow, Gur, Chow, van den Bree, Vermeesch, Warren, Owen, van Amelsvoort, Eliez and Breetvelt2021a 14, 30), these individuals either had insufficient data available to determine psychosis status, or had affective psychotic disorder and were thus excluded from analyses involving psychosis group-status.
e For individuals with multiple IQ assessments, only one (first) IQ assessment per age group is included.
Global cognitive functioning (FSIQ) and the four core IQ domains were assessed using age-appropriate Wechsler scales (Wechsler, Reference Wechsler1981, Reference Wechsler1997, Reference Wechsler1991, Reference Wechsler2002, Reference Wechsler2003, Reference Wechsler2008, Reference Wechsler2011) (Table 1). All IQ data underwent extensive quality control, as previously described (Davies et al., Reference Davies, Fiksinski, Breetvelt, Williams, Hooper, Monfeuga, Bassett, Owen, Gur, Morrow, McDonald-McGinn, Swillen, Chow, van den Bree, Emanuel, Vermeesch, van Amelsvoort, Arango and Armando2020; Fiksinski et al., Reference Fiksinski, Bearden, Bassett, Kahn, Zinkstok, Hooper, Tempelaar, McDonald-McGinn, Swillen, Emanuel, Morrow, Gur, Chow, van den Bree, Vermeesch, Warren, Owen, van Amelsvoort, Eliez and Breetvelt2021a). For analyses involving the association of IQ parameters and SSDs, participants were divided into three clinical subgroups, as previously described (Davies et al., Reference Davies, Fiksinski, Breetvelt, Williams, Hooper, Monfeuga, Bassett, Owen, Gur, Morrow, McDonald-McGinn, Swillen, Chow, van den Bree, Emanuel, Vermeesch, van Amelsvoort, Arango and Armando2020): SSDs (i.e. where the participant had received a formal psychiatric diagnosis of schizophrenia, schizoaffective disorder, delusional disorder, or psychotic disorder not otherwise specified); subthreshold psychosis (i.e. any participant who had never met criteria for any psychotic disorder diagnosis, but had endorsed clinically significant positive psychotic symptoms at any time point, based on structured diagnostic interview); and controls (i.e. participants without a lifetime diagnosis of any psychotic illness and who had never endorsed subthreshold psychotic symptoms). SSD group status was based on semi-structured in-person interviews at each site (Kaufman et al., Reference Kaufman, Birmaher, Brent, Rao, Flynn, Moreci, Williamson and Ryan1997; Kay, Fiszbein, & Opler, Reference Kay, Fiszbein and Opler1987; McGlashan, Walsh, & Woods, Reference McGlashan, Walsh and Woods2010; Yung et al., Reference Yung, Yuen, McGorry, Phillips, Kelly, Dell’Olio, Francey, Cosgrave, Killackey, Stanford, Godfrey and Buckby2005) and clinical diagnoses of SSDs were determined by experienced clinicians in accordance with the Diagnostic and Statistical Manual of Mental Disorders (2013; American Psychiatric Association, 2000).
Statistical analyses
All data quality control/preparation and statistical analyses were conducted in R 3.6.2 GUI 1.70 (R Core Team, Reference Team2019).
Overall IQ profile
Primary analyses focused on the overall IQ profile, using the first available Wechsler-assessed IQ data. Data from 1,328 participants were available, with differing numbers across the 4 domains (Table 1).
Our first objective was to investigate the absolute differences between the four core IQ domains. We conducted multiple paired t-tests, given that multiple domain scores are measured within individual participants (when available). We carried out six comparisons in total (VIQ-PIQ, VIQ-PS, VIQ-WM, PIQ-PS, PIQ-WM, and PS-WM) and used Bonferroni corrections to account for multiple testing. We explored whether the profile differed as a function of biological sex.
In addition, we used a median split to divide the sample into a higher and a lower FSIQ group. We explored whether results for the IQ profile were comparable in both (median-split FSIQ) groups.
To obtain a more detailed indication of how the four IQ domains and the complete profile relate to FSIQ, we calculated difference scores between FSIQ and each IQ domain (difference score [DS] = FSIQ – IQ domain). Then, we compared the DSs between the four IQ domains (resulting in six comparisons in total) using multiple paired t-tests, and applied Bonferroni corrections for multiple testing.
IQ profile across developmental stages
Consistent with other cognition studies in 22q11DS (Morrison et al., Reference Morrison, Chawner, van Amelsvoort, Swillen, Vingerhoets, Vergaelen, Linden, Linden, Owen and van den Bree2020), we divided participants into three age groups: children (6–9.9 years), adolescents (10–17.9 years), and adults (18 years and older), following World Health Organization (WHO) guidelines (WHO, 2017). A subset of participants (n = 496; 37.35%) had multiple IQ datapoints across varying time points and IQ domains. To maximize sample size, these longitudinal data points were included in the age-group analyses using the first available data point per age group. To account for the mixed data structure, linear mixed models were used to compare IQ-domain scores across the three age groups and examine the timing of developmental IQ differences. We also assessed IQ profiles (i.e. the relative positions of the four core IQ domains) across age groups by testing whether between-domain differences (paired Wilcoxon t-tests with Bonferroni correction) were comparable across groups. As an additional sensitivity analysis to examine whether results would be impacted differentially by the addition of longitudinal data points, we repeated analyses without the longitudinal data (ANOVA).
IQ profile and SSDs
We analyzed differences in overall IQ profile associated with the presence or absence of SSDs. For each IQ domain, we compared IQ scores between individuals with an SSD, individuals with subthreshold psychosis, and nonpsychotic individuals (NP; as previously described [Davies et al., Reference Davies, Fiksinski, Breetvelt, Williams, Hooper, Monfeuga, Bassett, Owen, Gur, Morrow, McDonald-McGinn, Swillen, Chow, van den Bree, Emanuel, Vermeesch, van Amelsvoort, Arango and Armando2020]), using ANOVA and appropriate subsequent comparisons. We also examined whether there were domain-specific differences between the three groups, that is, investigated whether the profile of IQ domains within the three groups was comparable, using paired t-tests with Bonferroni corrections. To control for potential age effects, we repeated analyses excluding NP individuals under 25 years of age (Davies et al., Reference Davies, Fiksinski, Breetvelt, Williams, Hooper, Monfeuga, Bassett, Owen, Gur, Morrow, McDonald-McGinn, Swillen, Chow, van den Bree, Emanuel, Vermeesch, van Amelsvoort, Arango and Armando2020; Gur et al., Reference Gur, McDonald-McGinn, Moore, Gallagher, McClellan, White, Ruparel, Hillman, Crowley, McGinn, Zackai, Emanuel, Calkins, Roalf and Gur2023; Vorstman et al., Reference Vorstman, Breetvelt, Duijff, Eliez, Schneider, Jalbrzikowski, Armando, Vicari, Shashi, Hooper, Chow, Fung, Butcher, Young, McDonald-McGinn, Vogels, van Amelsvoort, Gothelf and Weinberger2015).
Finally, we visually explored potential differences in the IQ profile across the three age groups between the three SSD groups, as sample sizes of subgroups based on the intersection of age and SSD status did not permit adequately powered statistical analyses.
Results
Overall IQ profile
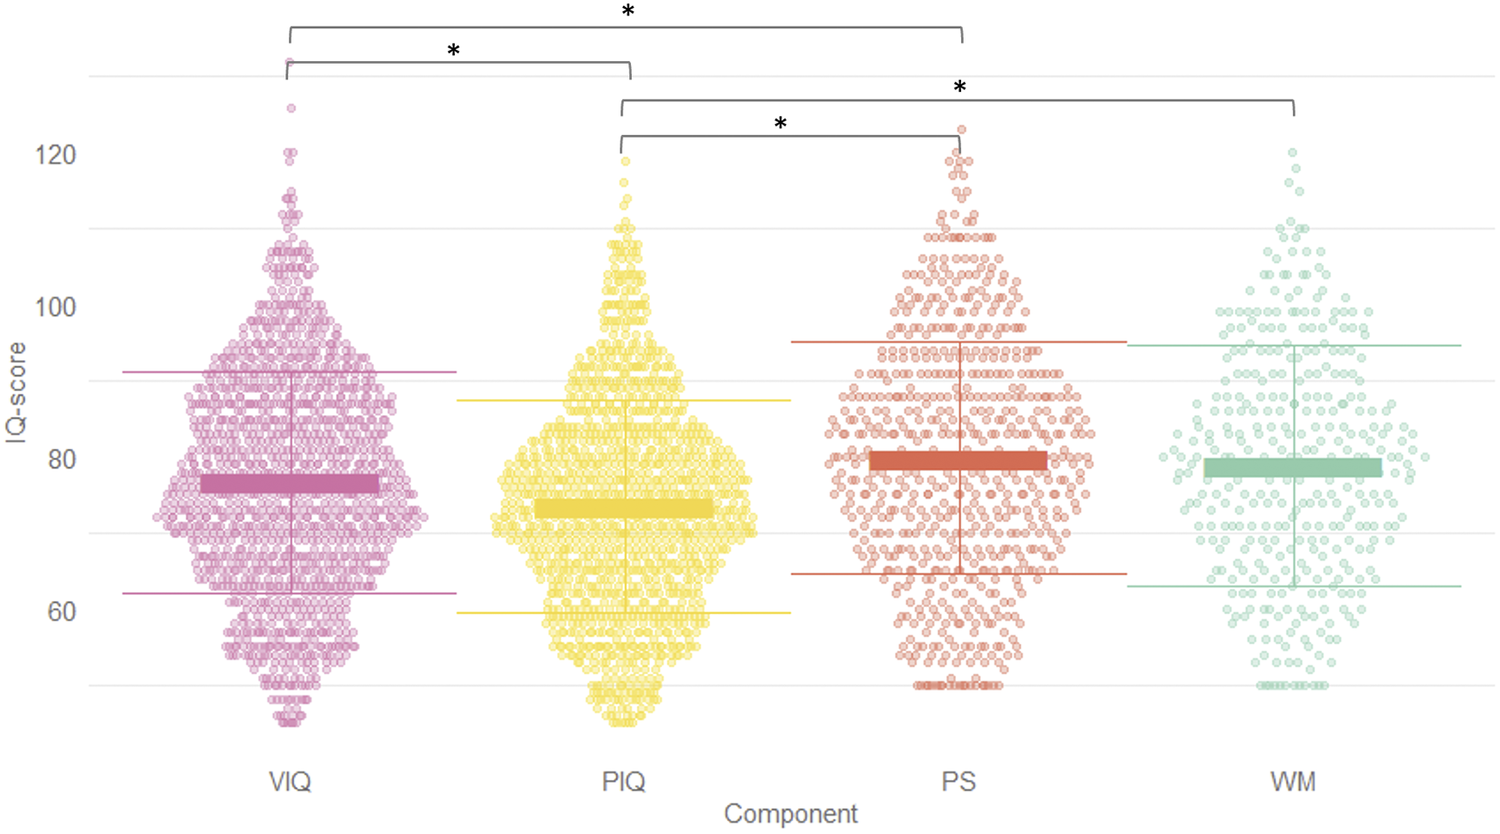
Exploration of the absolute IQ-domain scores at initial assessment resulted in the IQ score distributions presented in Figure 1. The overall IQ profile was discrepant, indicating significant differences between most components (VIQ > PIQ, VIQ < PS, PIQ < PS, and PIQ < WM; all p < 0.001; Supplemental Table 1). Ranked from strongest to weakest, the order of IQ domains was PS (mean = 79.83, SD = 15.85), WM (mean = 79.08, SD = 15.05), VIQ (mean = 76.65, SD = 14.54), and PIQ (mean = 73.53, SD = 14.02).
Overall complete IQ profile in individuals with 22q11DS. VIQ mean = 76.65, SD = 14.54; PIQ mean = 73.53, SD = 14.02; PS mean = 79.83, SD = 15.85; WM mean = 79.08, SD = 15.05. * indicates significant difference at p < 0.001 level, after Bonferroni correction. Details regarding between-domain comparisons are provided in Supplemental Table 1.

Figure 1. Long description
A swarm plot displays individual data points for four I Q components. The vertical Y-axis is labeled I Q-score and ranges from 40 to 140 in increments of 20. The horizontal X-axis is labeled Component and includes four categories from left to right.
* V I Q in purple: Data points are concentrated between 60 and 90 with a thick horizontal mean bar at 76.65 and thin horizontal lines indicating one standard deviation above and below.
* P I Q in yellow: Data points are concentrated between 60 and 85 with a thick mean bar at 73.53.
* P S in orange: Data points are concentrated between 65 and 95 with a thick mean bar at 79.83.
* W M in green: Data points are concentrated between 65 and 95 with a thick mean bar at 79.08.
At the top of the plot, horizontal brackets with asterisks indicate significant differences between V I Q and P S, V I Q and W M, P I Q and P S, and P I Q and W M.
Absolute pairwise IQ differences are displayed in Supplemental Figure 1, illustrating the distribution and directionality of group-level differences. Supplemental Figure 2 shows the distribution of ‘maxdif’, a measure of within-individual IQ discrepancy defined as the maximum difference between any two IQ domains within a single assessment per individual.
Compared to females, the average PS score in males was relatively lower, changing the order of the relative ranking to WM > PS > VIQ > PIQ (vs. PS > WM > VIQ > PIQ in females) (Supplemental Figure 3).
Implementing a median FSIQ split of 73, IQ profile characteristics remained consistent comparing those with lower IQ (40–72) to those with higher IQ (73–114), showing similarly discrepant profiles, the same domain rankings, and comparable magnitude and distribution of scores (means and SDs).
Analyses of the difference score (DS) of each IQ domain compared with FSIQ provided highly similar results (Supplemental Figure 4), showing, on average, IQ domain values higher than FSIQ as demonstrated by negative DS. The largest mean difference with FSIQ was observed for PS (mean DS = −8.21, SD = 11.91), followed by WM (mean DS = −6.50, SD = 9.61), VIQ (mean DS = −3.79, SD = 6.45), and PIQ (mean DS = −0.81, SD = 6.59), with significant differences in the effect size of DS (VIQ > PIQ, VIQ < PS; PIQ < PS, and PIQ < WM; all p < 0.001).
IQ profile across developmental stages
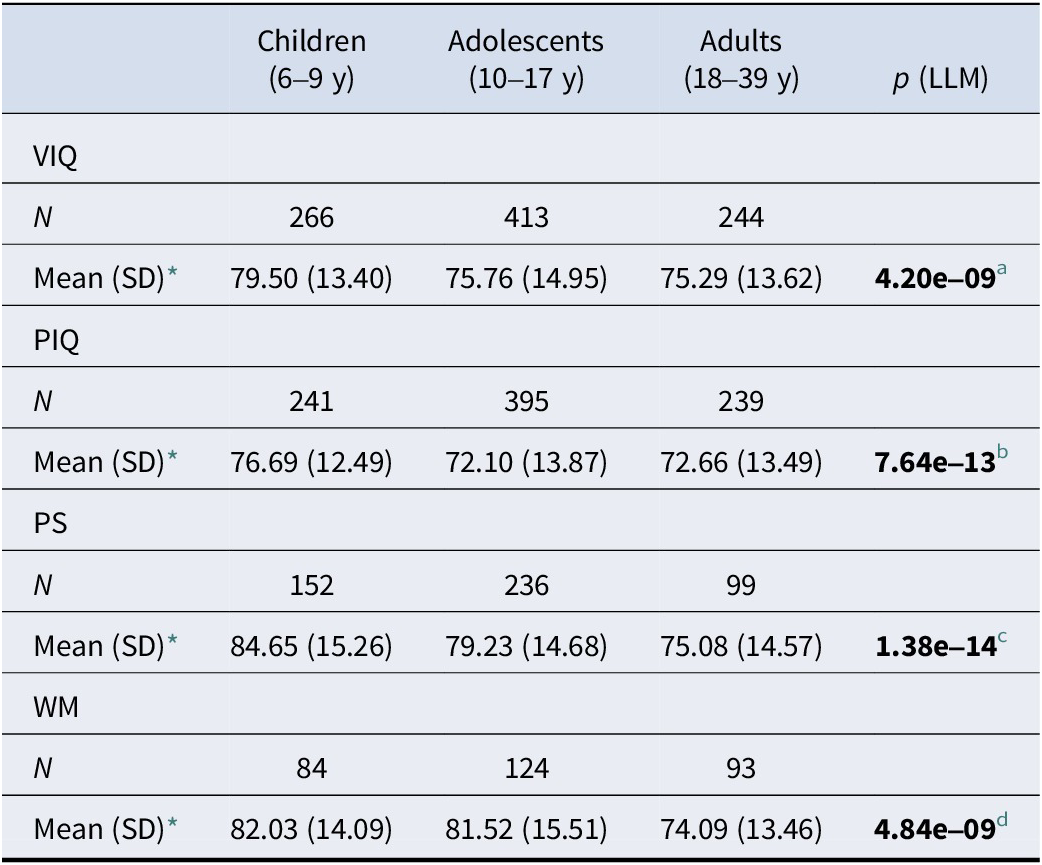
The overall IQ profile was discrepant in all three age groups, but with differences in the order of ranking. In children, the strength ranking of IQ domains was PS > WM > VIQ > PIQ, with significant differences between VIQ and PIQ, VIQ and PS, PIQ and PS, and PIQ and WM (p < 0.001). In adolescents, the ranking was WM > PS > VIQ > PIQ, with significant differences between all IQ domains (p < 0.001). In adults, the ranking was VIQ > PS > WM > PIQ, with significant differences between VIQ and PIQ, and between PIQ and PS (Table 2).
Comparisons between mean IQ scores (SD) per IQ domain across three developmental age groups in individuals with 22q11DS (linear mixed model [LLM])

Table 2. Long description
The table contains four main rows for I Q domains, each with sub-rows for sample size N and Mean with standard deviation in parentheses.
* V I Q domain: Children (N equals 266) mean 79.50 (13.40); Adolescents (N equals 413) mean 75.76 (14.95); Adults (N equals 244) mean 75.29 (13.62). The p-value is 4.20e minus 09.
* P I Q domain: Children (N equals 241) mean 76.69 (12.49); Adolescents (N equals 395) mean 72.10 (13.87); Adults (N equals 239) mean 72.66 (13.49). The p-value is 7.64e minus 13.
* P S domain: Children (N equals 152) mean 84.65 (15.26); Adolescents (N equals 236) mean 79.23 (14.68); Adults (N equals 99) mean 75.08 (14.57). The p-value is 1.38e minus 14.
* W M domain: Children (N equals 84) mean 82.03 (14.09); Adolescents (N equals 124) mean 81.52 (15.51); Adults (N equals 93) mean 74.09 (13.46). The p-value is 4.84e minus 09.
All p-values are significant at the p less than 0.001 level.
* Of first available IQ data point.
a χ2(2) = 38.58; (adjusted) pairwise comparisons: children versus adolescents p < 0.0001; adolescents versus adults p = 0.39; children versus adults p = 0.0004.
b χ2(2) = 38.58; (adjusted) pairwise comparisons: children versus adolescents p < 0.0001; adolescents versus adults p = 0.12; children versus adults p < 0.0001.
c χ2(2) = 38.58; (adjusted) pairwise comparisons: children versus adolescents p < 0.0001; adolescents versus adults p < 0.0001; children versus adults p < 0.0001.
d χ2(2) = 38.58; (adjusted) pairwise comparisons: children versus adolescents p = 0.89; adolescents versus adults p < 0.0001; children versus adults p < 0.0001.
Bold font indicates significance at the p < 0.001 level.
In a post-hoc ANOVA analysis, including only cross-sectional data points, results remained unchanged.
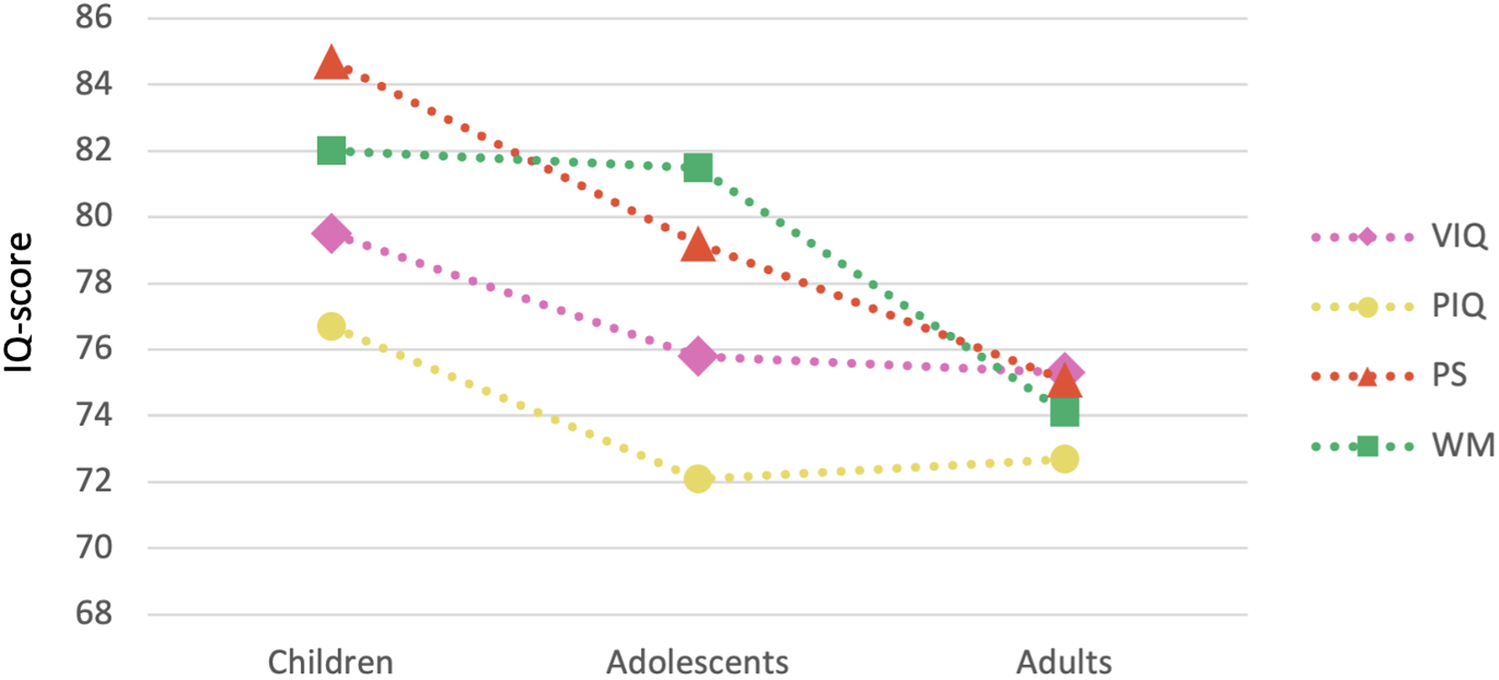
The linear mixed model analysis revealed significant between-age-group differences for all four IQ domains (Table 2). Each of the four IQ domains had significantly lower mean scores in the adult group compared to the children group. Specifically, VIQ, PIQ, and PS scores were significantly lower for adolescents compared to children. PS and WM scores were significantly lower for the adult group compared to the adolescent group (Figure 2).
Visualization of mean IQ scores per IQ domain across developmental age groups in individuals with 22q11DS. Note: Details of mean scores per IQ domain across age groups can be found in Table 2. Data included in this figure include all available IQ points, that is, including the (first) available IQ score per domain for each participant (n = 1,328, 100%), and for those with multiple IQ assessments available (n = 496, 37.35%), also the first available IQ score per domain in each age group. Results remained unchanged when excluding these longitudinal data points in post-hoc analyses.

Figure 2. Long description
The Y-axis represents I Q-score ranging from 68 to 86 in increments of 2. The X-axis lists three developmental groups: Children, Adolescents, and Adults. Four dotted lines represent different I Q domains:
* P S (Processing Speed, orange triangles): Starts highest in children at approximately 85, drops sharply to 79 in adolescents, and continues to decline to 75 in adults.
* W M (Working Memory, green squares): Starts at 82 in children, remains relatively stable at 81.5 in adolescents, then drops significantly to 74 in adults.
* V I Q (Verbal I Q, pink diamonds): Starts at 79.5 in children, drops to 76 in adolescents, and remains stable at 75.5 in adults.
* P I Q (Performance I Q, yellow circles): Starts lowest in children at 76.5, drops to 72 in adolescents, and shows a slight increase to 72.5 in adults.
Overall, all domains show a downward trend from childhood to adulthood, with P S and W M showing the most dramatic declines.
IQ profile and SSDs
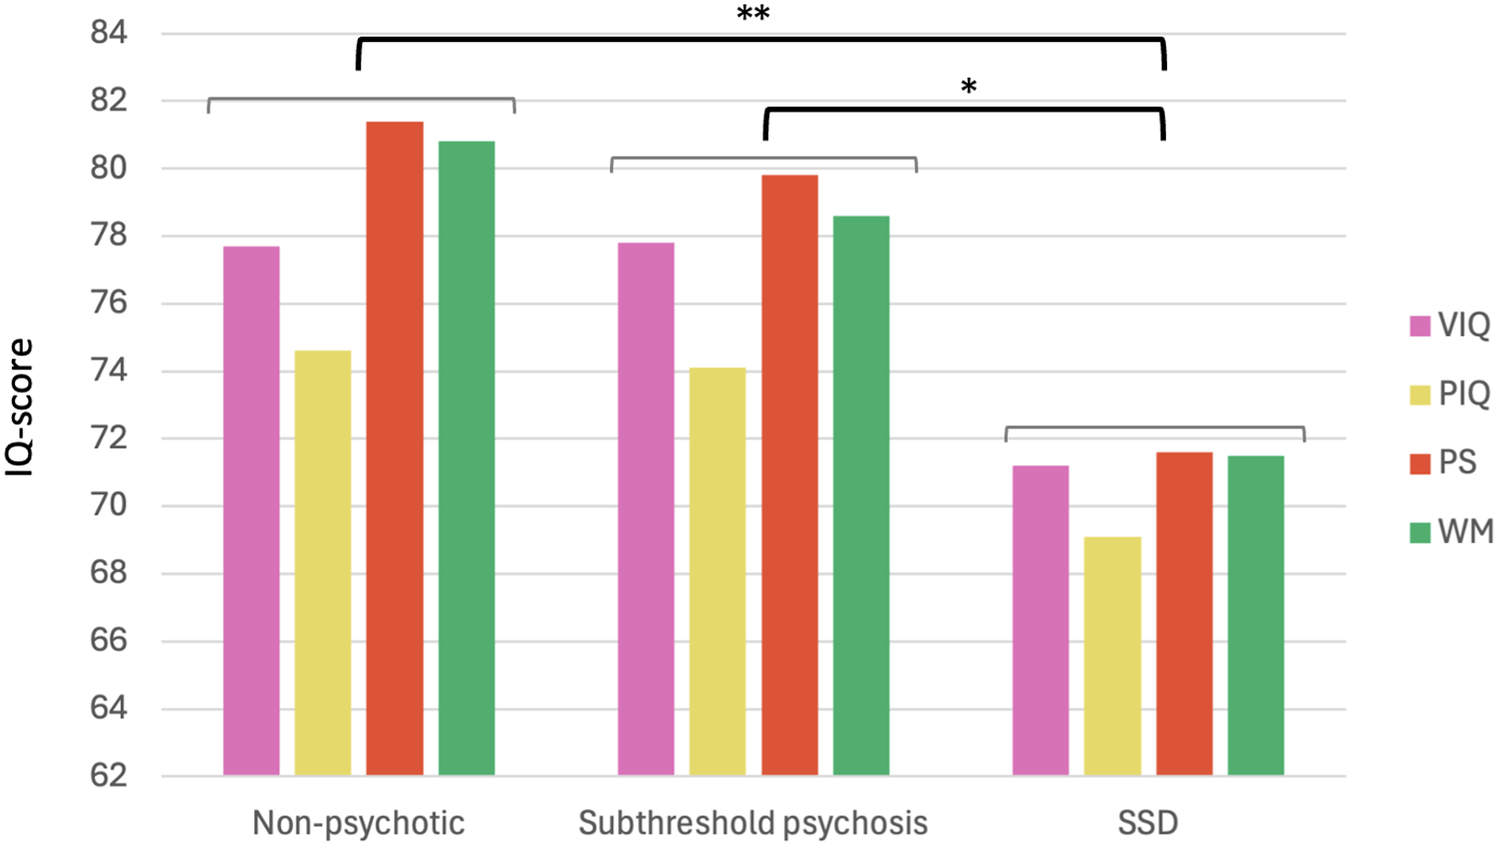
From the individuals with complete IQ data at initial assessment available, 17.47% (n = 232) fell in the SSD group, 15.96% (n = 212) fell in the subthreshold psychosis group, and 64.16% (n = 852) fell in the no psychosis group (Table 1). There were n = 32 (2.41%) individuals who did not fall in any of these three SSD groups and were thus excluded from this portion of the analyses. ANOVAs revealed significant between-group differences for all four IQ domains. Specifically, IQ scores were higher on all domains in the nonpsychotic group compared to the SSD group (p < 0.001). In the subthreshold psychosis group, IQ scores across all domains were intermediate between those of the SSD and NP groups, with significant differences compared to the IQ scores in the SSD group (p < 0.01), and differences compared to the NP group not reaching statistical significance (p > 0.05) (Supplemental Table 2). Notably, the relative positions of the four IQ domains (i.e. PS > WM > VIQ > PIQ) and between-domain differences were almost identical across the three groups (Figure 3 and Supplemental Table 3). Results were unchanged in post-hoc analyses restricted to nonpsychotic individuals aged ≥25 years.
IQ profile including four core IQ domains in individuals with 22q11DS: comparison between individuals with no psychotic illness, with subthreshold psychosis, and with an SSD. SSD: schizophrenia spectrum disorder, including schizophrenia, schizoaffective disorder, delusional disorder, or psychotic disorder not otherwise specified. *Significant between-group difference at p < 0.01 level, after Bonferroni correction. **Significance at the p < 0.001 level, after Bonferroni correction. More details are provided in Supplemental Tables 2 and 3.

Figure 3. Long description
The y-axis is labeled I Q-score, ranging from 62 to 84 in increments of 2. The x-axis contains three groups: Non-psychotic, Subthreshold psychosis, and S S D. A legend on the right identifies four color-coded domains: V I Q (pink), P I Q (yellow), P S (orange), and W M (green).
1. Non-psychotic group: V I Q is approximately 78, P I Q is 75, P S is 81, and W M is 81.
2. Subthreshold psychosis group: V I Q is approximately 78, P I Q is 74, P S is 80, and W M is 79.
3. S S D group: All scores are notably lower. V I Q is approximately 71, P I Q is 69, P S is 72, and W M is 71.
Statistical significance brackets at the top indicate:
- A double asterisk (**) spans from the Non-psychotic group to the S S D group, indicating a significant difference at the p < 0.001 level.
- A single asterisk (*) spans from the Subthreshold psychosis group to the S S D group, indicating a significant difference at the p < 0.01 level.
Exploration of the between-age and between-SSD groups IQ-profile differences suggests that the developmental group differences are largely similar between those with SSDs, those with subthreshold psychosis, and those with no psychotic illness, and are in line with the total sample developmental group IQ-profile differences. For VIQ, there appear to be only very minor developmental group differences in the nonpsychotic group, compared to decreasing VIQ scores in higher age groups in individuals with SSDs or subthreshold psychosis (Supplemental Figure 5).
Discussion
In the current study, comprising the largest sample available to date, we examined the complete IQ profile of individuals with 22q11DS, including VIQ, PIQ, PS, and WM scores. Alongside substantial individual-level variability, we observed a tendency toward a distinct IQ profile at group level, with, on average, PS emerging as the relatively strongest domain, followed by WM, VIQ, and PIQ as the relatively weakest domains. The differences between IQ domains are significant in children, adolescents, and adults with 22q11DS. IQ scores on all domains are lower in consecutive age groups, with subtle domain-specific differences in the timing of these IQ differences. Finally, while IQ scores on all domains are lower in individuals with SSDs compared to nonpsychotic individuals or those with subthreshold psychotic symptoms, the profile of IQ domains remains similar, regardless of psychosis status.
In the general population, intra-individual discrepancies between IQ domains are common but typically occur bidirectionally, resulting in small mean differences at the group level. Accordingly, group-level averages of between-domain discrepancy scores close to zero likely reflect the cancellation of opposing individual patterns rather than uniform cognitive profiles (Gorlyn et al., Reference Gorlyn, Keilp, Oquendo, Burke, Sackeim and Mann2006; Gyurke, Prifitera, & Sharp, Reference Gyurke, Prifitera and Sharp1991; Iverson, Reference Iverson2001; Matarazzo & Herman, Reference Matarazzo and Herman1984; Wechsler, Reference Wechsler1997). In this context, the mean discrepancies (between 0 and 8 IQ points) observed in our sample suggest a systematic directional shift in cognitive profile shape among individuals with 22q11DS (Supplemental Figure 1). Although modest at the individual level, such a shift may have important population-level implications, as it increases the proportion of individuals showing discrepancies in the same direction and, consequently, those exceeding clinically relevant thresholds. Therefore, even relatively small average differences may reflect meaningful changes in the distribution of cognitive profiles at the group level.
Beyond the previously observed higher VIQ than PIQ scores (De Smedt et al., Reference De Smedt, Devriendt, Fryns, Vogels, Gewillig and Swillen2007; Fiksinski et al., Reference Fiksinski, Bearden, Bassett, Kahn, Zinkstok, Hooper, Tempelaar, McDonald-McGinn, Swillen, Emanuel, Morrow, Gur, Chow, van den Bree, Vermeesch, Warren, Owen, van Amelsvoort, Eliez and Breetvelt2021a; Niarchou et al., Reference Niarchou, Zammit, van Goozen, Thapar, Tierling, Owen and van den Bree2014), this study suggests that PS and WM are relative strengths in individuals with 22q11DS across age groups and IQ levels. Alongside impairments in executive functioning (Bish et al., Reference Bish, Ferrante, McDonald-McGinn, Zackai and Simon2005), social cognition (Campbell et al., Reference Campbell, McCabe, Melville, Strutt and Schall2015), visual motor integration (Duijff et al., Reference Duijff, Klaassen, Beemer, de Veye, Vorstman and Sinnema2012a), and memory (Campbell et al., Reference Campbell, Azuma, Ambery, Stevens, Smith, Morris, Murphy and Murphy2010), visuospatial processing deficits have consistently been reported in individuals with 22q11DS (Everaert et al., Reference Everaert, Boerma, Selten, Vorstman and Wijnen2021). However, visuospatial processing appears less impaired on tasks requiring less complex spatial processing (Attout, Noël, Vossius, & Rousselle, Reference Attout, Noël, Vossius and Rousselle2017), while simple visual memory is generally better preserved than verbal memory (Fiksinski et al., Reference Fiksinski, Breetvelt, Lee, Boot, Butcher, Palmer, Chow, Kahn, Vorstman and Bassett2018a). These observations align with our findings of relatively higher scores on PS and WM and may reflect a shared reliance on simple and unidirectional processing (speed or memory; Wechsler, Reference Wechsler2003), rather than the more complex integrative skills required for multiplex and manipulative processing tasks (Attout, Noël, Vossius, & Rousselle, Reference Attout, Noël, Vossius and Rousselle2017).
Overall, our results are consistent with a gradual decline over development in all IQ domains in individuals with 22q11DS, as previously reported for VIQ and PIQ (Duijff et al., Reference Duijff, Klaassen, de Veye, Beemer, Sinnema and Vorstman2012b; Fiksinski et al., Reference Fiksinski, Bearden, Bassett, Kahn, Zinkstok, Hooper, Tempelaar, McDonald-McGinn, Swillen, Emanuel, Morrow, Gur, Chow, van den Bree, Vermeesch, Warren, Owen, van Amelsvoort, Eliez and Breetvelt2021a; Vorstman et al., Reference Vorstman, Breetvelt, Duijff, Eliez, Schneider, Jalbrzikowski, Armando, Vicari, Shashi, Hooper, Chow, Fung, Butcher, Young, McDonald-McGinn, Vogels, van Amelsvoort, Gothelf and Weinberger2015). About a decade ago, it was suggested that despite a negative association between cognitive function and age in 22q11DS, not all cognitive domains may be equally affected (Antshel et al., Reference Antshel, Shprintzen, Fremont, Higgins, Faraone and Kates2010). Indeed, our findings suggest that while scores on all four core IQ domains decline with age, the timing of these changes is domain-specific: VIQ and PIQ scores are lower in adolescents versus children; a similar picture is observed for PS, but with a further decrease in adults; while WM is similar in children and adolescents, but substantially lower in adults. The latter raises the possibility that WM-related difficulties may not only reflect differential developmental pathways but may also become more prominent in adulthood, warranting longitudinal monitoring given their relevance for adaptive functioning and psychiatric vulnerability (Bassett et al., Reference Bassett, McDonald-McGinn, Devriendt, Digilio, Goldenberg, Habel, Marino, Oskarsdottir, Philip, Sullivan, Swillen and Vorstman2018; Gur et al., Reference Gur, McDonald-McGinn, Moore, Gallagher, McClellan, White, Ruparel, Hillman, Crowley, McGinn, Zackai, Emanuel, Calkins, Roalf and Gur2023).
Cognitive developmental trajectories in 22q11DS reported by Morrison et al. (Reference Morrison, Chawner, van Amelsvoort, Swillen, Vingerhoets, Vergaelen, Linden, Linden, Owen and van den Bree2020) largely align with our findings, demonstrating higher VIQ and PIQ in children than adults (but not adolescents), as well as higher childhood PS and WM scores, with WM declining from adolescence to adulthood. However, unlike our findings, PS scores did not differ between childhood and adolescence or between adolescence and adulthood. These discrepancies may reflect methodological differences, including the smaller sample size (22q11DS, N = 236), use of different instruments, broader age range, and exclusively cross-sectional data (Morrison et al., Reference Morrison, Chawner, van Amelsvoort, Swillen, Vingerhoets, Vergaelen, Linden, Linden, Owen and van den Bree2020). Further studies integrating such complementary approaches are needed to further elucidate the cognitive circuits and genetic architecture (Van Rheenen et al., Reference Van Rheenen, Cropley, Zalesky, Bousman, Wells, Bruggemann, Sundram, Weinberg, Lenroot, Pereira, Weickert, Weickert and Pantelis2018) that may be differentially affected in individuals with 22q11DS and contribute to domain-specific developmental differences.
Findings that the IQ profile was similarly distributed across SSD status suggest an association with the primary impact of 22q11DS and/or genetic liability for schizophrenia, rather than secondary to SSD expression. This is consistent with work on executive performance, where no distinct impairment pattern has been linked to SSDs (Dickinson, Ragland, Gold, & Gur, Reference Dickinson, Ragland, Gold and Gur2008; Fiksinski et al., Reference Fiksinski, Breetvelt, Lee, Boot, Butcher, Palmer, Chow, Kahn, Vorstman and Bassett2018a; Ruiz, Raugh, Bartolomeo, & Strauss, Reference Ruiz, Raugh, Bartolomeo and Strauss2020; Snitz, Macdonald, & Carter, Reference Snitz, Macdonald and Carter2006). The greater overall IQ decrements in individuals with SSDs compared to those with no or subthreshold psychosis align with prior findings in 22q11DS (Butcher et al., Reference Butcher, Chow, Costain, Karas, Ho and Bassett2012; Fiksinski et al., Reference Fiksinski, Heung, Corral, Breetvelt, Costain, Marshall, Kahn, Vorstman and Bassett2022; Weinberger et al., Reference Weinberger, Yi, Calkins, Guri, McDonald-McGinn, Emanuel, Zackai, Ruparel, Carmel, Michaelovsky, Weizman, Gur, Gur and Gothelf2016) and in idiopathic schizophrenia and clinical high-risk populations (Dickinson, Reference Dickinson2008; Mollon et al., Reference Mollon, David, Zammit, Lewis and Reichenberg2018).
Moreover, VIQ differences between childhood and adolescence appeared more pronounced in the SSD group than in the other groups. This corroborates previous findings for a largely overlapping 22q11DS cohort, showing that VIQ decline is most strongly associated with later schizophrenia onset (Fiksinski et al., Reference Fiksinski, Bearden, Bassett, Kahn, Zinkstok, Hooper, Tempelaar, McDonald-McGinn, Swillen, Emanuel, Morrow, Gur, Chow, van den Bree, Vermeesch, Warren, Owen, van Amelsvoort, Eliez and Breetvelt2021a, Vorstman et al., Reference Vorstman, Breetvelt, Duijff, Eliez, Schneider, Jalbrzikowski, Armando, Vicari, Shashi, Hooper, Chow, Fung, Butcher, Young, McDonald-McGinn, Vogels, van Amelsvoort, Gothelf and Weinberger2015) and with genetic overlap between VIQ decline and schizophrenia risk (Davies et al., Reference Davies, Fiksinski, Breetvelt, Williams, Hooper, Monfeuga, Bassett, Owen, Gur, Morrow, McDonald-McGinn, Swillen, Chow, van den Bree, Emanuel, Vermeesch, van Amelsvoort, Arango and Armando2020, as well as increased schizophrenia risk in the general population (Agnew-Blais & Seidman, Reference Agnew-Blais and Seidman2013; Velthorst et al., Reference Velthorst, Mollon, Murray, de Haan, Germeys, Glahn, Arango, van der Ven, di Forti, Bernardo, Guloksuz, Delespaul, Mezquida, Amoretti, Bobes, Saiz, García-Portilla, Santos, Jiménez-López and Reichenberg2021).
Potential implications
At the individual level, statistically significant between-domain differences observed at the group level are not necessarily clinically meaningful and should rather be interpreted in light of base-rate discrepancy norms provided in test manuals. These norms guide the interpretation of IQ differences by indicating how commonly such discrepancies occur in the population and thereby supporting judgments about their potential relevance for day-to-day functioning, as well as their utility for informing assessment, diagnosis, or intervention (e.g. when exceeding established thresholds for meaningful index discrepancies and/or impacting functional outcomes) (Gorlyn et al., Reference Gorlyn, Keilp, Oquendo, Burke, Sackeim and Mann2006; Gyurke, Prifitera, & Sharp, Reference Gyurke, Prifitera and Sharp1991; Iverson, Reference Iverson2001; Matarazzo & Herman, Reference Matarazzo and Herman1984; Wechsler, Reference Wechsler1997). Although our findings may be consistent with a tendency toward increased intra-individual variability across IQ domains in individuals with 22q11DS, evidence for such differences relative to the general population remains limited. Importantly, intra-individual IQ-domain variability is common and not, in itself, indicative of atypical cognitive functioning or clinical comorbidity (Binder & Binder, Reference Binder and Binder2011; Lichtenberger & Kaufman, Reference Lichtenberger and Kaufman2013). Accordingly, both clinical and everyday practice must account for substantial interindividual variability, as has been described across neurodevelopmental phenotypes associated with high-impact genetic variants (Chawner et al., Reference Chawner, Doherty, Anney, Antshel, Bearden, Bernier, Chung, Clements, Curran, Cuturilo, Fiksinski, Gallagher, Goin-Kochel, Gur, Hanson, Jacquemont, Kates, Kushan, Maillard and van den Bree2021; Farmer et al., Reference Farmer, Klein-Tasman, Chun, Giserman-Kiss, Joseph, Chlebowski, Kozel and Thurm2025; Sanders et al., Reference Sanders, Sahin, Hostyk, Thurm, Jacquemont, Avillach, Douard, Martin, Modi, Moreno-de-Luca, Raznahan, Anticevic, Dolmetsch, Feng, Geschwind, Glahn, Goldstein, Ledbetter, Mulle and Bearden2019).
A key challenge, therefore, is to obtain a sufficiently detailed understanding of an individual’s cognitive profile in order to align environmental demands with abilities, thereby preventing mismatches while also identifying opportunities to support and strengthen individual capacities. Our findings highlight that cognitive assessments in individuals with 22q11DS ought to be comprehensive; that is, providing insight into the full profile rather than merely FSIQ, and repeated throughout development, given the changes in IQ (domains) with age observed in 22q11DS (Boot et al., Reference Boot, Oskarsdottir, Loo, Crowley, Orchanian-Cheff, Andrade, Arganbright, Castelein, Cserti-Gazdewich, de Reuver, Fiksinski, Klingberg, Lang, Mascarenhas, Moss, Nowakowska, Oechslin, Palmer, Repetto and Bassett2023; Oskarsdottir et al., Reference Oskarsdottir, Boot, Crowley, Loo, Arganbright, Armando, Baylis, Breetvelt, Castelein, Chadehumbe, Cielo, de Reuver, Eliez, Fiksinski, Forbes, Gallagher, Hopkins, Jackson, Levitz-Katz and Schindewolf2023).
One implication of our findings, consistent with clinical observations worldwide (Butcher et al., Reference Butcher, Chow, Costain, Karas, Ho and Bassett2012; Fiksinski et al., Reference Fiksinski, Schneider, Murphy, Armando, Vicari, Canyelles, Gothelf, Eliez, Breetvelt, Arango and Vorstman2018b; Swillen, Moss, & Duijff, Reference Swillen, Moss and Duijff2018), is that the IQ-profile characteristics of 22q11DS carry the risk of overestimating individuals with 22q11DS and, consequently, imposing expectations that exceed abilities. Relatively higher PS, WM, and VIQ compared to more impaired PIQ may result in an appearance of adequate cognitive functioning, given preserved performance on simple, time-limited tasks and repetition of straightforward information. However, this may mask underlying difficulties in problem-solving and deeper comprehension. Such profile discrepancies often constitute ‘hidden disabilities’ that become apparent only in more complex tasks. The resulting mismatch between external expectations and internal capacities may contribute to feelings of being overwhelmed or isolated, and in some cases, emotional dysregulation or outbursts (Fiksinski et al., Reference Fiksinski, Schneider, Zinkstok, Baribeau, Chawner and Vorstman2021c).
Ensuring an optimal match between environmental demands and an individual’s profile of strengths and weaknesses is relevant not only for cognitive and academic development, but also for reducing or preventing undue stress – an important consideration in a multisystem condition such as 22q11DS. Minimizing chronic stress exposure may be particularly relevant in this population (Armando et al., Reference Armando, Sandini, Chambaz, Schaer, Schneider and Eliez2018; Gothelf et al., Reference Gothelf, Schneider, Green, Debbane, Frisch, Glaser, Zilkha, Schaer, Weizman and Eliez2013; Sommer et al., Reference Sommer, Bearden, van Dellen, Breetvelt, Duijff, Maijer, van Amelsvoort, de Haan, Gur, Arango, Díaz-Caneja, Vinkers and Vorstman2016; van Duin et al., Reference van Duin, Vaessen, Kasanova, Viechtbauer, Reininghaus, Saalbrink, Vingerhoets, Hernaus, Booij, Swillen, Vorstman, van Amelsvoort and Myin-Germeys2019; Yui et al., Reference Yui, Goto, Ikemoto, Ishiguro, Angrist, Duncan, Sheitman, Lieberman, Bracha and Ali1999), although further research is needed to clarify dysregulation of neurobiological stress systems and its relationship to psychopathology (Cullen et al., Reference Cullen, Labad, Oliver, Al-Diwani, Minichino and Fusar-Poli2024).
Likewise, as pathogenic genetic variants associated with neurodevelopmental conditions are increasingly identified, alongside growing insight into their differential effects on cognition (Davies et al., Reference Davies, Fiksinski, Breetvelt, Williams, Hooper, Monfeuga, Bassett, Owen, Gur, Morrow, McDonald-McGinn, Swillen, Chow, van den Bree, Emanuel, Vermeesch, van Amelsvoort, Arango and Armando2020; Huguet et al., Reference Huguet, Schramm, Douard, Jiang, Labbe, Tihy, Mathonnet, Nizard, Lemyre, Mathieu, Poline, Loth, Toro, Schumann, Conrod, Pausova, Greenwood, Paus and Bourgeron2018; Moreno-De-Luca et al., Reference Moreno-De-Luca, Evans, Boomer, Hanson, Bernier, Goin-Kochel, Myers, Challman, Moreno-De-Luca, Slane, Hare, Chung, Spiro, Faucett, Martin and Ledbetter2015), studies such as ours may help advance understanding of the mechanisms underlying cognitive phenotypes and potentially related, treatable psychopathology. Although neuropsychiatric pleiotropy and variable expressivity are the rule rather than the exception for high-impact variants such as the 22q11.2 microdeletion (Fiksinski et al., Reference Fiksinski, Schneider, Zinkstok, Baribeau, Chawner and Vorstman2021c; Sanders et al., Reference Sanders, Sahin, Hostyk, Thurm, Jacquemont, Avillach, Douard, Martin, Modi, Moreno-de-Luca, Raznahan, Anticevic, Dolmetsch, Feng, Geschwind, Glahn, Goldstein, Ledbetter, Mulle and Bearden2019), these conditions nevertheless offer unique opportunities for early identification and intervention (Fiksinski et al., Reference Fiksinski, Schneider, Zinkstok, Baribeau, Chawner and Vorstman2021c; Insel, Reference Insel2010; Lord & Veenstra-VanderWeele, Reference Lord and Veenstra-VanderWeele2016; Moreno-De-Luca, Reference Moreno-De-Luca2016).
Strengths and limitations
This study provides a comprehensive overview of IQ characteristics, with a developmental perspective, for individuals with 22q11DS. There have been studies assessing other domains of neurocognitive functioning, including various operationalizations of constructs related to PS and WM. However, novel to our study is the inclusion of all four core domains of IQ (i.e. VIQ, PIQ, PS, and WM) as assessed by the same family of IQ instruments (Wechsler), allowing investigation of the complete IQ profile in this population. The availability of the largest sample to date, with a wide age range, including longitudinal IQ data for about one-third of the sample, allowed for nuanced characterization of developmental differences between IQ domains.
Although the use of Wechsler-based assessments enhances overall comparability relative to mixing fundamentally different intelligence or cognitive capacities tests, it does not entirely eliminate variability in how specific cognitive domains are operationalized between different versions over time and tailored to age groups. This may be especially relevant for PS and WM, which were not consistently operationalized as distinct indices in earlier Wechsler versions and whose subtest composition has varied across editions.
IQ data were not uniformly available for all IQ domains in all individuals, resulting in smaller sample sizes for some between-component analyses and for subgroups based on SSD status and age group, thereby hindering sufficiently powered analyses. As the pattern of missing data was not entirely random (i.e. varying with respect to variables, including FSIQ, age, and SSD status), potential bias in interpretation of the observed group differences and developmental comparisons cannot be excluded. However, the data presented may help shape further hypotheses and future studies.
In line with previous work from the IBBC, we employed the upper age limit of 39 years for inclusion of IQ data, as available data points above this threshold were too limited and likely more subject to ascertainment bias (Fiksinski et al., Reference Fiksinski, Bearden, Bassett, Kahn, Zinkstok, Hooper, Tempelaar, McDonald-McGinn, Swillen, Emanuel, Morrow, Gur, Chow, van den Bree, Vermeesch, Warren, Owen, van Amelsvoort, Eliez and Breetvelt2021a). Characterization of IQ profile and IQ development in older adults with 22q11DS, as well as consideration of the potential impact of other factors, such as parental cognitive functioning (Fiksinski et al., Reference Fiksinski, Heung, Corral, Breetvelt, Costain, Marshall, Kahn, Vorstman and Bassett2022), mode of inheritance (de novo vs. familial [McGinn et al., Reference McGinn, Crowley, Heung, Tran, Moss, Zackai, Emanuel, Chow, Morrow, Swillen, Bassett and McDonald-McGinn2022]), or (socio-)environmental factors (McKinney, Williford, Abbeduto, & Schmitt, Reference McKinney, Williford, Abbeduto and Schmitt2024) remain important research objectives to be addressed in future studies. Other clinical comorbidities and medication status were not included in the present analyses due to incomplete and nonuniform availability across participants and study sites. Although previous work in 22q11DS has generally not found clear associations between IQ and most psychiatric comorbidities other than SSDs, suggesting that these factors are unlikely to fully account for the observed cognitive differences, the potential influence of comorbid conditions and medication use (e.g. Latrèche et al., Reference Latrèche, Mancini, Dvojakovska, Kushan, Mchangama, Tair, Cohen, Spapens, Reijn, Díaz-Caneja, Acheampong, Troch, Vergaelen, Vogels, Swillen, Vingerhoets, Boot, Arango, Velders and Eliez2025) on cognitive outcomes cannot be excluded and warrants further investigation in even more comprehensively characterized cohorts.
In addition, the incorporation of polygenic risk scores (PRS) may provide important insight into the genetic underpinnings of IQ profiles and psychosis risk in 22q11DS, and represents a promising direction for future research aiming to integrate common-variant genetic liability with the high-impact 22q11.2 deletion. Finally, the present study focused exclusively on individuals with 22q11DS. Comparative studies across other pathogenic genetic variants will be important to determine which findings are syndrome-specific versus shared, including through consortium-based efforts (Jacquemont et al., Reference Jacquemont, Huguet, Klein, Chawner, Donald, van den Bree, Sebat, Ledbetter, Constantino, Earl, McDonald-McGinn, van Amelsvoort, Swillen, O’Donnell-Luria, Glahn, Almasy, Eichler, Scherer and Robinson2022).
Conclusion
Our analyses of comprehensive IQ data from over 1,300 individuals with 22q11DS revealed a tendency toward a discrepant and characteristic IQ profile, despite substantial interindividual variability, and regardless of psychosis status. In addition, examination of IQ domains across different age groups revealed domain-specific differences in timing of IQ differences. The within-individual discrepancy in IQ profiles may impart the risk for overestimating cognitive abilities, and thus functional expectations, in individuals with 22q11DS. Collectively, the results provide impetus for including repeated comprehensive cognitive assessments into the routine clinical care of individuals with 22q11DS, particularly at key transition points (preschool-primary; primary-secondary school, and transition to work/adulthood). In addition, results may pave the way for further investigations of genetic and nongenetic mechanisms underlying IQ characteristics and associations with psychotic illness in 22q11DS, with implications that may extend to other high-impact genetic variants and to the general population.
Supplementary material
To view supplementary material for this article, please visit http://doi.org/10.1017/S0033291726105224.
Acknowledgments
The authors would like to thank all of the individuals with 22q11DS and their families for their participation in this study, colleagues for referring patients, and research assistants and students who assisted in the collection of data.
Author contribution
Study concept and design: A.M.F., J.A.S.V. and T.v.A.; acquisition of data: All authors; analysis and interpretation of data: A.M.F., J.A.S.V. and T.v.A.; critical revision of the manuscript for important intellectual content: All authors. A.M.F., J.A.S.V. and T.v.A. had full access to all the data in the study and take responsibility for the integrity of the data and the accuracy of the data analysis.
Funding statement
Authors were partially financially supported for this work as follows: A.M.F.: Grant from patient support group ‘Stichting Steun 22Q11’ (PI: M.L. Houben). M.B.M.v.d.B. and M.J.O.: the Medical Research Council (MRC MR/T033045/1 (IMAGINE-2 study); and MR/N022572/1 and MR/L011166/1)(IMAGINE-ID study) (MvdB), the Baily Thomas Charitable Trust (2315/1 and TRUST/VC/AC/SG/5196-8188) (MvdB), the Waterloo Foundation (918-1234) (MvdB), a Wellcome Trust ISSF grant (MvdB), and the National Institute for Mental Health (NIMH U01MH119738 and 5UO1MH101724)(MvdB). R.E.G.: NIH U01 MH119738. A.S.B.: Canadian Institutes of Health Research (MOP #97800, MOP #111238), NIMH U01MH0101723, McLaughlin Centre Accelerator grant, and Dalglish Chair in 22q11.2 Deletion Syndrome. C.E.B.: NIMH R01MH085953, U01MH119736, and R21MH116473. W.R.K.: NIMH R01064824. J.A.S.V.: NIMH U01MH119741-01 and the SickKids Psychiatry Associates Chair in Developmental Psychopathology. T.v.A.: NIMH U01MH119740. A.S.: NIMH 5U01MH101722, 1U01MH119759. V.S. and S.R.H.: NIH R01 MH078015. C.A. and C.M.D.-C.: Supported by the Spanish Ministry of Science and Innovation, Instituto de Salud Carlos III (ISCIII), cofinanced by the European Union, ERDF Funds from the European Commission, ‘A way of making Europe’, financed by the European Union – NextGenerationEU (PMP21/00051), PI19/01024. CIBERSAM, Madrid Regional Government (B2017/BMD-3740 AGES-CM-2), European Union Structural Funds, European Union Seventh Framework Program, European Union H2020 Program under the Innovative Medicines Initiative 2 Joint Undertaking: Project PRISM-2 (Grant agreement No.101034377), Project AIMS-2-TRIALS (Grant agreement No 777394), Horizon Europe, the National Institute of Mental Health of the National Institutes of Health under Award Number 1U01MH124639-01 (Project ProNET) and Award Number 5P50MH115846-03 (project FEP-CAUSAL), Fundación Familia Alonso, and Fundación Alicia Koplowitz. D.M.D.-M.G., R.E.G., D.G.: Binational Science Foundation grant number 2023318. G.M.R.: Fondecyt ANID Chile grant #1171014. J.R.V.: Funded by Fonds Wetenschappelijk Onderzoek grant numbers G0E1117N and G0A2622N. Open access funding provided by University Medical Center Utrecht.
Competing interests
All authors report no financial disclosures with commercial interests. J.A.S.V. serves as a consultant for NoBias Therapeutics Inc. for the design of a clinical trial in children with the 22q11.2 deletion. This relationship did not influence content of this manuscript.
Copyright transfer
All authors agree to the submission of this manuscript.


 Open access

