I. INTRODUCTION
Power amplification of narrowband signals using a radiofrequency (RF) choke bias network and lookup-table (LUT) linearization offers excellent results, especially when the signal exhibits low peak-to-average (power) ratio (PAR) values. However, wide signal bandwidths with high PAR values present unique power amplification challenges. Wireless data links need maximum average transmitted signal power to maximize link capacity, and maximum amplifier power-added efficiency (PAE) is needed to minimize battery/supply power drain. How can we satisfy these goals for broadband signals? “Ideal amplification” (IA) achieves both objectives simultaneously, for all amplifier transfer characteristics and all signal waveforms.
IA requires optimal solution of three problems: (1) peak reduction (PR) shaping of the probability density function (pdf) of the signal magnitude; (2) predistortion (PD) of the signal waveform to effectively linearize the nonlinear amplifier transfer characteristic; and (3) effectively integrating those solutions with an envelope-tracking (ET) power amplifier (PA).
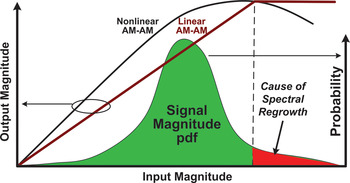
This requires: (1) precluding the signal magnitude pdf tail (“cause of spectral regrowth” in Fig. 1) from exceeding the amplifier's linear range and (2) altering the amplifier transfer characteristic to be piecewise-linear, as depicted in Fig. 1 [Reference McCallister1]. IA requires that these goals be simultaneously achieved and that amplifier PAE be maximized by ideal integration with an ET PA. Each goal is addressed in subsequent parts of this paper.
Spectral regrowth: mechanism and cure.

II. SIGNAL PR
Hundreds of published papers have addressed various PAR reduction approaches over recent decades. The most common [Reference May and Rohling2, Reference Shearer and Sills3] approach uses iterative removal of a scaled fixed-shape pulse, gradually reducing peaks while meeting out-of-band (OOB) spectral energy constraints. However, superior performance is achievable with far less DSP complexity using the concept of the signal “excursion” waveform. The excursion waveform, x(t), associated with any signal waveform, s(t), and magnitude bound, B, is simply defined as,
 $$x\left(t \right)\equiv \left\{\matrix{ & 0\comma & \left\vert s\left(t \right) \right\vert \leq B\comma \cr & s\left(t \right)- B{\displaystyle{s\lpar t\rpar \over {\left\vert {s\lpar t\rpar } \right\vert }}}\comma & \left\vert s\left(t \right) \right\vert \gt B. } \right.\eqno\lpar 1\rpar$$
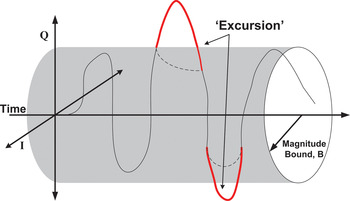
Figure 2 depicts the excursion waveform as a complex function of time.
“Excursion” associated with a complex signal over time.

Subtracting the filtered, scaled, and time-aligned excursion waveform from the signal to accomplish PAR reduction was first described by Armstrong [Reference Armstrong4], who scaled the filtered excursion to restore peak magnitude. McCallister [Reference McCallister5] first applied channel-specific scaling to match excursion energy in each signal channel to that channel's error vector magnitude (EVM) constraint, a necessary condition for minimum PAR. Optimal PR demands that both forms of scaling be simultaneously applied, posing a “chicken-and-egg” challenge.
Dynamic modulation and coding imply dynamic channel EVM values, demanding dynamic scaling of the excursion energy corresponding to each signal channel. Frequency-dependent channel scaling filters the excursion waveform, demanding corresponding time-domain scaling. Finally, dynamic scaling of the excursion waveform alters the excursion energy in each channel. McCallister [Reference McCallister and Brombaugh6] used automatic-gain-control (AGC) of the excursion energy corresponding to each signal channel to resolve this dilemma, constantly adapting channel scaling to “nudge” excursion channel energy toward its EVM constraint. The channel gain-versus-frequency profile defines a linear filter, from which the required time-domain peak scaling may be readily computed.
A) Optimal PR processing architecture
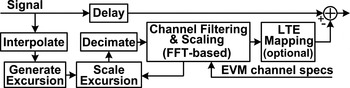
Figure 3 depicts the optimal PR functional architecture, applicable to all multi-channel signals: non-Orthogonal Frequency division multiplexed (OFDM) (e.g. EV-DO, Rev. C) and OFDM-based (e.g. WiMAX and LTE). Non-OFDM signals use an FFT-based transmultiplexer for channel filtering and scaling; OFDM signals use direct FFT-based processing. Feedback from the channel-specific scaling operation to the time-domain excursion scaling operation is critical to achieve optimal PAR reduction.
Optimal PAR reduction functional architecture.

Optimal PR processing for OFDM waveforms is simple: real scaling is applied to each excursion FFT according to each channel's EVM constraint, and the time-domain scaling is a simple function of the relative numbers of each EVM value (modulation and code type).
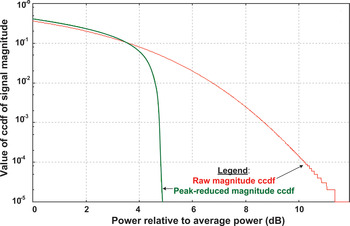
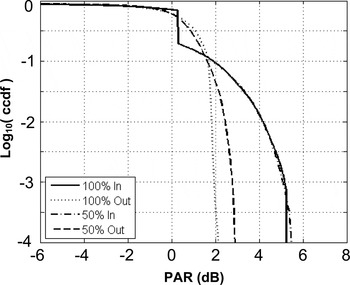
Figure 4 depicts performance obtained using optimal PR processing executed using Field-programmable gate array (FPGA) hardware with a 20 MHz 15-channel QPSK EV-DO Rev. C signal. A 4.75 dB PAR is achieved while satisfying all OOB and EVM constraints, and with DSP complexity that is about 25% of prior PAR reduction art [7].
Multi-channel PR results using FPGA hardware.

PR processing yields ~6 dB PAR for typical OFDM (e.g. WiMAX, 802.11ac) signals, achieving low PAR without the orthogonality loss penalty imposed by LTE's precoding transform [Reference Ciochina and Sari8], which can exceed 2 dB. While optimally peak-reduced WiMAX has lower PAR than conventional LTE, our PR processing significantly reduces the PAR of conventional LTE.
B) PAR reduction: nonaggregated LTE
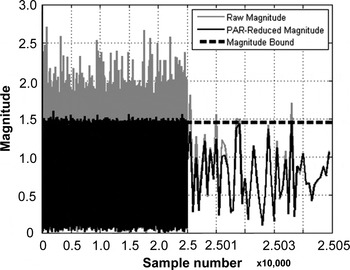
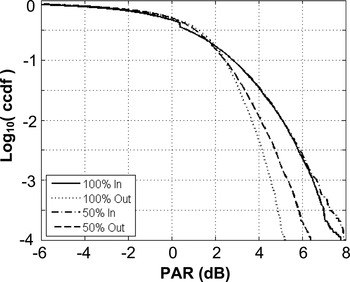
Following verification that MATLAB simulation results matched FPGA PR processing results for 20 MHz 15-channel Rev C EVDO, the PR simulation was used to simply and accurately characterize LTE PR performance. LTE signals were generated based on Myung's published MATLAB LTE simulation code [9]. For single-band LTE transmissions satisfying regulatory spectral mask constraints (α = 0.25 root-Nyquist filter), PAR value can be reduced by 3.5 dB for 100% (2.4 dB for 50%) LTE uplinks; Figs 5 and 6 depict LTE magnitude-versus-time and PAR characterizations, respectively.
Single-channel LTE PR using MATLAB simulation.

Single-channel PAR reduction: ccdf curves.

C) PAR reduction: aggregated-band LTE
For aggregated-band LTE transmission, LTE's 7.6 dB PAR value (α = 0.25 root-Nyquist spectrum shaping) is easily reduced by 3 dB for 100% (1.5 dB for 50%) usage. Optimal PAR reduction provides a 70% increase in PA output power for precisely those high-rate uplinks where PA power is most needed. Figure 7 depicts PAR results for LTE signals in three separate 5 MHz bands spread over a 20 MHz transmission band using ×2 oversampling.
Multi-channel PAR reduction MATLAB results.

III. PD LINEARIZATION
The second critical technical challenge, PD linearization, has also generated hundreds of technical papers and patents, starting nearly 40 years ago [Reference Weber III10] with Weber's PD of the modulation constellation. Least-mean-square (LMS)-based adaptive PD quickly followed [Reference Davis and Boyd11], then simplification [Reference Cavers12] to a magnitude-addressed LUT.
Most recent advances use generalized memory polynomial (GMP) processing [Reference Morgan13] to achieve high linearity in Class A operation. While GMP greatly improves linearity, GMP's DSP implementation demands unacceptably high power consumption for cell phone and portable wireless applications to execute GMP's complex DSP operations. GMP's success proved that PA nonlinear energy is deterministic, indicating compensation should be achievable. The very high condition numbers associated with the GMP matrices clearly indicated that this method uses an inefficient model; this suggested that a physics-based PA model might yield comparable results while requiring far simpler DSP.
A) Physical amplification model
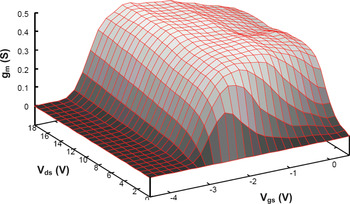
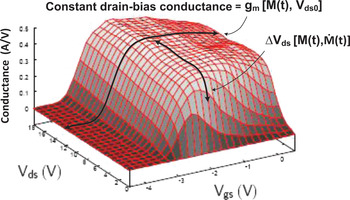
The simplest physical single-transistor PA model assumes the existence of a nonlinear conductance manifold, where the conductance is a nonlinear function of both the control (gate) voltage and the voltage across the PA. Figure 8 depicts a conductance manifold [14] for a GaN PA device.
GaN conductance manifold.

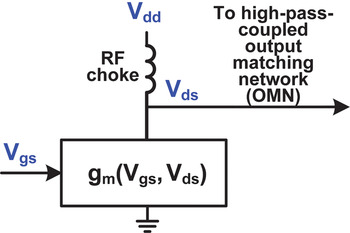
Assuming a simple RF choke feed in the output bias network, the PA circuit model is depicted in Fig. 9. Supply voltage, V dd, supplies charge to the circuit, and in response to variations in input RF voltage, V gs, the dynamic conductance routes RF current to the resistive load through the output matching network (OMN). If the choke impedance is much smaller than the inverse of the PA conductance, we may accurately approximate the current as the product of the supply voltage and the PA conductivity – the basis for the pedagogical tool of a (non-existent) nonlinear PA “current source”. The PA generates an effective “current manifold”, which is a nonlinear function of both gate and drain voltages.
Simple physical model of PA circuit.

Gate voltage, v gs(t), may be represented as a sinusoid modulated by arbitrary magnitude, M(t), and phase, Θ(t)
 $$v_{gs} \left(t \right)\equiv M\left(t \right)\cos \left[{\omega _c t+\theta \left(t \right)} \right].\eqno\lpar 2\rpar$$
Model the amplifier current as having power-series dependence on gate voltage, with the series coefficients, a n, reflecting the current manifold's dependence on V ds.
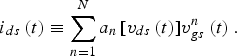 $$i_{ds} \left(t \right)\equiv \sum\limits_{n=1}^N {a_n \left[{v_{ds} \left(t \right)} \right]} v_{gs}^n \left(t \right).\eqno\lpar 3\rpar$$
Exploiting the binomial theorem yields,
 $$\eqalign{& v_{gs}^n \left(t \right)=\left({\displaystyle{{M^n \left(t \right)} \over {2^n }}} \right) {\mathop{\rm Re}\nolimits} \left\{{\sum\limits_{k=0}^n {\left({\matrix{ n \cr k \cr } } \right)} \left[{{\rm e}^{j\Theta \left(t \right)} } \right]^k \left[{{\rm e}^{ - j\Theta \left(t \right)} } \right]^{n - k} {\rm e}^{j\omega _c \left({2k - n} \right)t} } \right\}}. \eqno\lpar 4\rpar$$
The video component of i ds(t) is then seen to be
 $$i_{ds\comma\, video} \left(t \right)=\left[{\sum\limits_{even\_n}^N {\displaystyle{{a_n \left[{v_{ds} \left(t \right)} \right]} \over {2^n }}\left({\matrix{ n \cr\cr {\displaystyle{{n - 1} \over 2}} } } \right)} } \right]M^n \left(t \right).\eqno\lpar 5\rpar$$
Similar analysis describes RF current at all harmonics. These components modulate voltage across the amplifier, generating spurious nonlinear RF energy, and must be eliminated or compensated to achieve linear amplification.
Saleh [Reference Saleh and Wazowicz15] prescribed minimizing the impedance at video and all RF harmonics to minimize the distortion induced by these spurious currents. The logic is compelling: eliminate the impedances and the voltage-induced gain variations disappear. Eliminating the impedance at RF harmonics is readily accomplished using simple LC traps. Assuming resistive matching (i.e. negligibly dispersive RF passband impedance), a simple LUT linearizer [Reference Cavers12] readily compensates for AM–AM and AM–PM associated with the nonlinear passband current, leaving only the problematic video impedance.
B) Video impedance coping strategies
For the past two decades, designers have tried to minimize impact of RF “choke” inductance, whose linearly increasing video impedance induces intractable PA gain nonlinearity for broadband signals. The challenge is to minimize video band bias impedance, while assuring RF passband (bias) impedance greatly exceeds RF passband OMN impedance – lest wasted RF power decrease PAE. To this end, resonance [Reference Wisherd16], multi-pole high-pass networks and arrays of spaced-resonance shunt capacitors [Reference Khanifar17] have been used. These strategies induce resonant voltages precluding operation beyond 1 dB compression points, and impose severe constraints on tuning and manufacturing processes.
Our alternate strategy adaptively compensates for the nonlinear PA gain variation caused by gate and drain “choke” inductances. Amplifier gain is a nonlinear function of both v gs(t) and v ds(t).
 $$g_m \left(t \right)=f\left({v_{gs} \left(t \right)\comma \; v_{ds} \left(t \right)} \right).\eqno\lpar 6\rpar$$
But from Fig. 9, we see that v ds(t) is a nonlinear function of both signal magnitude and its time derivative.
 $$V_{ds} \left(t \right)=V_{dd} - L_b \dot M\left(t \right)\displaystyle{{{\rm d}i_{ds\comma video} \lsqb M\lpar t\rpar \rsqb } \over {{\rm d}t}}.\eqno\lpar 7\rpar$$
Combining (2), (6), and (7) leads to the key conclusion that amplifier gain must be a nonlinear function of both signal magnitude and its time derivative. Although the memoryless nonlinearity is unknown, we can simply exploit the powerful LMS algorithm to drive the contents of a suitable LUT to optimal gain compensation – easily done when the LUT address space spans both signal magnitude and its time derivative.
Conventional magnitude-based LMS linearizers cannot correct Ṁ-induced gain nonlinearities, since magnitude and its derivative are uncorrelated for all band-limited signals.
 $$\left\langle {M\left(t \right)\dot M\left(t \right)} \right\rangle=\Big\langle {M\left(t \right)\mathop {\lim }\limits_{\tau \to 0} \left\{{\displaystyle{{M\lpar t+\tau \rpar - M\lpar t\rpar } \over \tau }} \right\}} \Big\rangle .\eqno\lpar 8\rpar$$
Interchanging the expectation, 〈 〉, and limit operators, we find this correlation equals the derivative of the magnitude autocorrelation function evaluated at zero.
 $$\eqalign{& \left\langle {M\left(t \right)\dot M\left(t \right)} \right\rangle = {\mathop {Lim}\limits_{\tau \to 0} \left\{{\displaystyle{{R_M \lpar t+\tau \rpar - R_M \lpar t\rpar } \over \tau }} \right\}} =\dot R_M \left(0 \right)\approx 0.}\eqno\lpar 9\rpar$$
Therefore, Ṁ-induced gain errors cannot generate adaptive correction in conventional M-only-based LMS linearizers.
Our new amplification model describes movement over the conductivity/current manifold as no longer along only iso-V ds contours, but now including a dynamic component of movement transverse to those iso-V ds contours. Composite movement, and amplifier gain, is a function of both magnitude and its derivative, as depicted in Fig. 10.
Conductance manifold dynamic gain components.

C) Proposed “memory” nonlinearity compensation
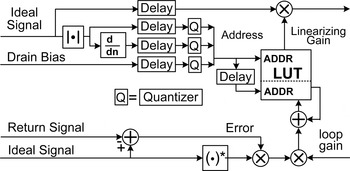
Video current is a function of magnitude, so the voltage generated by resistive and inductive video impedance must be a nonlinear function of magnitude and its derivative; resulting PA gain variation must then be a function of both parameters. Although nominal nonlinear gain is a function of only magnitude, composite PA gain must be a memoryless function of magnitude, M, and its derivative, Ṁ. We simply augment the LUT address, appending to the magnitude bits those bits representing the (scaled) derivative of the magnitude as depicted in Fig. 11.
LUT-based PA linearizer architecture.

This linearizer compensates for video inductance, and can also accommodate dynamic variation of drain (and gate) bias, as shown. Its simplicity is attributable to our viewing amplification as resulting from signal-driven movement over a nonlinear conductance/current manifold.
IV. EXPERIMENTAL RESULTS
A) Hardware system description and experimental results
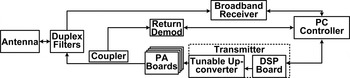
The demonstration system depicted in Fig. 12 was used to evaluate the validity of the PR and PD concepts and architectures previously described. This system has been used to evaluate performance using a variety of PA technologies, including LDMOS, GaN, and pHEMT.
RF Transceiver used to evaluate ideal linearization.

The return demodulator depicted in Fig. 12 uses a simple bandpass filter centered on the RF passband and wide enough to pass ~6× the signal bandwidth, then coherent sub-sampling [Reference Ibáñez-Díaz18] using a SiGe sample-and-hold to extract a precise replica of the transmitted signal.
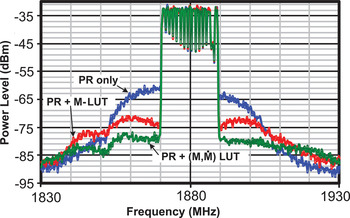
An Avago pHEMT PA (ATF-501P8 transistor) was used to perform the experiment described below. A 20 MHz RF signal centered at 1.885 GHz and consisting of 15 parallel EV-DO CDMA signals (random data bits) was generated by a DSP Board FPGA. Figure 13 depicts the comparative output spectra when using PR but no linearization (blue top trace), conventional M-based LUT linearization (red middle trace), and finally, LUT linearization based on both M and Ṁ (green bottom trace). Compensating for nonlinear gain induced by the derivative of magnitude significantly enhances linearization.
Comparative linearized PA output spectra.

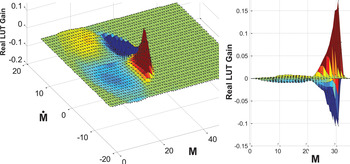
Further validation for our PA model is provided by examination of the gain values in the LUT after the LMS algorithm has converged to stable values. To speed convergence and emphasize the differences we used two parallel LUTs, one conventional and the other (M, Ṁ). Figure 14 depicts two views of the real part of (M, Ṁ) LUT gain versus both M and Ṁ; clearly, optimal gain compensation is strongly a function of both M and Ṁ. For comparison, conventional M-based LUT gain magnitudes are less than unity. These results prove that the “RF choke” gain nonlinearity mechanism is significant and that the solution in Fig. 11 is viable and effective.
LUT optimal (M, Ṁ) gain compensation.

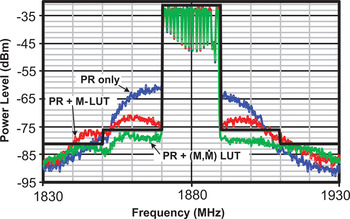
PA output power is constrained by a regulatory spectral mask constraining OOB signal power as depicted in Fig. 15; operating outside the PA linear region generates OOB power violating this mask and requiring increased PA backoff. The average transmit power increases achievable while satisfying the spectral mask are a direct measure of the value of PR and PD processing. (Note: channel scaling automatically adjusts, as depicted in Fig. 3, to ensure that EVM specifications remain satisfied.)
Signal power versus typical regulatory spectral mask.

Compared with operation with neither PR nor linearization, experimental results in Table 1 demonstrate that the enhanced PR and PD algorithms described in this paper substantially increase average PA transmit power.
Measured increase in average transmit power (dB).

Our results show that the PD in Fig. 12 significantly improves pHEMT PA linearization and validate both the hypothesized nonlinearity mechanism and the efficacy of our solution. Combined, these simple DSP techniques increased average transmit power six-fold (7.8 dB). Enhanced PR and PD DSP algorithms clearly offer substantial cost and power savings benefits for products using broadband wireless transmitters, such as those supporting video telephony and cloud computing applications.
B) Interpretation of experimental results
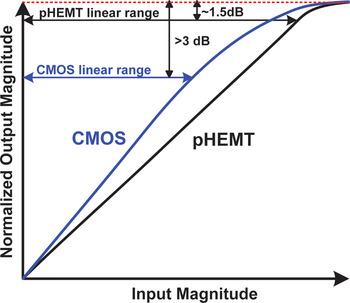
We may reasonably speculate on the benefits this new PD might offer for CMOS and LDMOS PAs. Figure 16 depicts normalized magnitude transfer characteristics for both pHEMT and CMOS PA devices. pHEMT PAs exhibit linearity to near-saturation; CMOS PAs exhibits more gradual nonlinearity, with several dB between the 1 dB compression point and saturation. Since the (M, Ṁ) LUT demonstrated ability to more completely linearize the pHEMT device, increasing linear power by 1.3 dB, we speculate that the (M, Ṁ) LUT may increase the average linear power from a CMOS PA by several dB.
Normalized magnitude PA transfer characteristics.

Such an increase could make it possible to transmit 4G broadband signals using CMOS PAs, making it practical to develop fully integrated multi-band RF transmitters for cellular band applications, offering similar manufacturing and cost efficiencies as current multi-band WiFi products. Future research will explore this possibility by evaluating these improved PR and PD techniques with CMOS PAs.
V. IMPLEMENTATION COMPLEXITY ASSESSMENT
The PAR reduction technique is predominantly FFT-based, so the methodology used to design a reconfigurable FFT chip [Reference Chia-Hsiang19] permits accurate estimation of its implementation complexity. This methodology yields an estimated PAR reduction complexity of ~0.77 mm2 and ~16 mW power for a 20 MHz band with a 22 nm CMOS process. Implementation complexity estimation for linearization based on the (M, Ṁ) LUT is currently in progress.
VI. SYNERGIES WITH ET
Significant progress has been made since 1995 [Reference Buoli, Abbiati and Riccardi20] enhancing PA power efficiency by adaptively varying bias (V DS) voltage. If V DS is adjusted so that all signal peaks remain within the PA's linear range, no nonlinear energy is generated; minimum power drain (V DS) over time maximizes PA efficiency. Modern ET PAs demonstrate [Reference Kwak21] excellent PAE. The primary driver of ET implementation complexity is the supply voltage tracking bandwidth, B T [Reference Sahu22]; fortunately most efficiency gain is achievable [Reference Larson23] using small (~1%) ratios of B T to signal bandwidth, B S.
ET PAs can be improved using a V DS waveform directly responsive to signal peaks, rather than scaling rms signal power. For any B T value, there is a unique “peak-riding” V DS waveform which just exceeds all signal peaks while minimizing the waveform's rms energy; define that V DS waveform as a bandwidth-optimized peak-riding (BOPR) waveform. Peak-tracking (PT) PAs vary V DS to be BOPR proportional; they enhance efficiency for larger B T values.
A) Enhanced PR synergy with ET
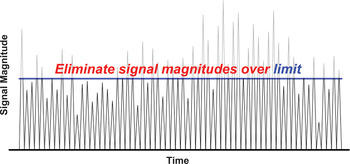
Figure 17 depicts an example of a PR operation using a constant magnitude limit (threshold). A constrained-B T ET PA offers little efficiency improvement; V DS cannot vary quickly enough to track the rapid residual signal changes.
PR using constant magnitude threshold.

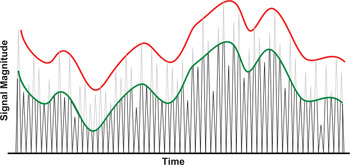
Optimal synergy between PR and ET requires that the PR magnitude threshold be proportional to the BOPR waveform; PR then generates far less noise coping with the largest peaks, while residual signal peaks are B T-trackable. BOPR scaling is adaptively reduced until the average noise generated by clipping signal peaks exactly equals the EVM noise budget. ET can track post-PR signal peaks, since the bandwidth of the scaled BOPR waveform still equals B T. Average noise generated clipping signal peaks equals the EVM budget in both cases, but using a scaled version of the BOPR as PR magnitude threshold, as in Fig. 18, significantly enhances PA efficiency.
PR using scaled BOPR for magnitude threshold.

B) Enhanced PD synergy with ET
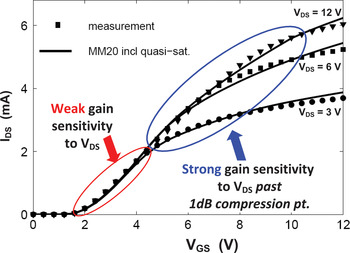
Conductivity and gain manifolds associated with MESFET and CMOS PAs [Reference Angelov24, slide 10] exhibit significant V DS sensitivity near their 1 dB compression point; Fig. 19 confirms this holds for LDMOS PAs as well [Reference Aarts25]. Compensation for gain variation induced by V DS variation is needed to apply ET to such devices whenever effective PD significantly extends their linear range. The LUT-based PD architecture in Fig. 12 compensates for all-gain nonlinearity induced by an arbitrary drain bias (V DS) variation, thus permitting CMOS ET PA use well beyond the 1 dB compression point with negligible gain nonlinearity induced by V DS variation.
Gain sensitivity to V DS beyond 1 dB compression point.

C) Optimal integrated system: PR + PD + ET
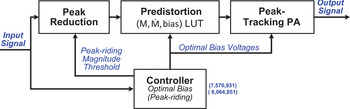
Figure 20 depicts the fully integrated version of an IA system. The controller generates the BOPR waveform using known techniques [Reference McCallister and Brombaugh26] and then supplies it to a processing cascade of PR, PD, and ET PA. This architecture simultaneously maximizes PA output average power and PAE for all signals and all amplifier types. It promises to more than quadruple the average output power from CMOS PAs, so that they may be fully integrated into CMOS transmitter ICs. Such integrated CMOS devices promise multi-band cellular transmitters similar to those currently available for unlicensed band WiFi transmission.
Integrated IA system architecture.

VII. CONCLUSION
Optimal methods for accomplishing both PR and PD for arbitrary broadband signals and amplifiers and a new system architecture that optimally integrates PR, PD and ET PAs have been described. Hardware results validate the proposed broadband PR and PD techniques. Future work will evaluate performance with CMOS PAs, and will incorporate RF traps to eliminate harmonic-induced nonlinearities. Combining optimal PR, PD, and ET processing enables designers of mobile wireless platforms to achieve ideal broadband signal power amplification with minimal implementation complexity; implementation of the solutions described is sufficiently simple and low-power as to be viable for even cell phone market application.
ACKNOWLEDGEMENT
The author gratefully acknowledges contributions by Dr David Hedberg, Dr John Liebetreu, Dr Bruce Cochran, Mr Dan Shearer, Mr Randy Syring, and most significantly, Mr Eric Brombaugh, during the decade-long course of this research.
 Ron McCallister received a degree in Engineering Science from Dartmouth College in 1971, an M.S.E.E from the University of Southern California in 1975, and a Ph.D. degree in communication engineering from Arizona State University in 1981. He co-founded CrestCom, a wireless research firm in 2003, and is its President and CEO. His main research interests are in wireless communication system design and optimization of cellular networks.