INTRODUCTION
The past decade has seen an increased number of pronunciation instruction (PI) empirical studies with promising findings and review articles recognizing a paradigm shift, indicating that explicit PI can help second-language (L2) learners achieve comprehensible pronunciation (e.g., Derwing et al., Reference Derwing, Munro, Foote, Waugh and Fleming2014; Lee et al., Reference Lee, Jang and Plonsky2015; Saito, Reference Saito2011; Thomson & Derwing, Reference Thomson and Derwing2015; Trofimovich et al., Reference Trofimovich, Kennedy and Blanchet2017). However, most review articles have noted that the results of existing empirical studies are far from conclusive, as they contradict one another on a set of crucial issues related to designing interventions for improving L2 pronunciation: the focus of instruction, treatment context, and outcome measures (e.g., Lee et al., Reference Lee, Jang and Plonsky2015; Thomson & Derwing, Reference Thomson and Derwing2015).
Many studies discuss the relative effectiveness of PI for either segmental elements (isolated vowels and consonants, i.e., phonemes) or suprasegmental features (e.g., stress, rhythm, and intonation). Levis (Reference Levis2005) and Saito (Reference Saito2014) indicated that segmental phonemes may be easier for teachers to teach and learners to learn; in other studies, suprasegmentals have been found to play a very important role in comprehensibility (e.g., Hahn, Reference Hahn2004; Isaacs & Trofimovich, Reference Isaacs and Trofimovich2012; Kang et al., Reference Kang, Rubin and Pickering2010; Saito & Saito, Reference Saito and Saito2017). However, few empirical studies have investigated the relative effectiveness of PI on both feature types. Derwing et al. (Reference Derwing, Munro M and Wiebe1998) separated segmental from suprasegmental features in training (Sereno et al., Reference Sereno, Lammers and Jongman2016), examining the effects of two types of PI (segmental- and suprasegmental-based) compared with no PI and finding that explicit PI on suprasegmentals is more effective than that on segmentals when it comes to comprehensibility. Yet to what extent suprasegmental instruction is superior to segmental instruction remains unclear. Gordon and Darcy (Reference Gordon and Darcy2012) more clearly established that the effect of explicit PI on suprasegmentals is almost twice that of the effect on segmentals; however, as this paper was presented at the American Association for Applied Linguistics, it is difficult to clearly trace the procedure and data. Therefore, to what extent one type of explicit PI is superior to the other requires further empirical investigation.
The treatment context is another crucial feature that can greatly influence the impact of a pedagogical intervention (e.g., Plonsky & Oswald, Reference Plonsky and Oswald2014). Empirical studies centering on the effects of explicit PI on L2 pronunciation development have shown a general improvement in learners’ pronunciation after explicit instruction in both laboratory settings (e.g., Elliott, Reference Elliott1997; MacDonald et al., Reference MacDonald, Yule and Powers1994; Missaglia, Reference Missaglia, Ohala, Hasegawa, Ohala, Granville and Bailey1999; Neri et al., Reference Neri, Mich, Gerosa and Giuliani2008; Saito, Reference Saito2011) and classroom settings (e.g., Couper, Reference Couper2006; Derwing & Munro, Reference Derwing and Munro1997, Reference Derwing and Munro2005; Derwing et al., Reference Derwing, Munro M and Wiebe1998; Derwing et al., Reference Derwing, Munro, Foote, Waugh and Fleming2014; Kennedy & Trofimovich, Reference Kennedy and Trofimovich2010; Lee & Lyster, Reference Lee and Lyster2015; Munro et al., Reference Munro, Derwing and Thomson2015; Perlmutter, Reference Perlmutter1989; Saito & Saito, Reference Saito and Saito2017; Saito et al., Reference Saito, Suzukida and Sun2018). Nevertheless, laboratory-based studies have shown larger effects than classroom-based ones, possibly due to fewer distractions, easier variable control, and/or a higher quality of treatment in the laboratory (Li, Reference Li2010). However, as the results of laboratory-based PI may not be reproducible in classroom teaching, they may lack in practical value. If strong evidence of improved comprehensibility were found in classroom-based studies as a result of explicit PI, more instructors would be willing to teach pronunciation systematically (Foote et al., Reference Foote, Holtby and Derwing2011; Thomson & Derwing, Reference Thomson and Derwing2015). Hence, more empirical studies should be carried out in intact classes to ensure the ecological validity of the method.
Furthermore, the use of controlled constructed tasks (i.e., those requiring a fixed response from all participants) or free constructed tasks (i.e., where measures are open-ended, allowing for a variety of different responses) as outcome measures of PI efficacy may greatly impact the results of the PI (Lee et al., Reference Lee, Jang and Plonsky2015; Saito, Reference Saito2012). Most researchers have preferred to use exclusively controlled tasks to evaluate L2 learners’ pronunciation, mostly because they are easy to administer and can ensure that the participants produce the target elements. Lee et al. (Reference Lee, Jang and Plonsky2015) found in their meta-analysis that controlled tasks may allow learners to focus more on their pronunciation, leading to larger observed effects. However, for the same reasons, the results of controlled tasks may not be generalizable to spontaneous speech and may thus lack in informative value where real communication is concerned. Tasks involving contextualized use of language, such as picture narratives, monologues, or conversations, are considered to have larger practical value and may translate into more meaningful pronunciation gains in the real world (Thomson & Derwing, Reference Thomson and Derwing2015). Saito and Plonsky (Reference Saito and Plonsky2019) suggested that the effectiveness of instruction should be assessed not only using controlled knowledge but also spontaneous knowledge. Derwing et al. (Reference Derwing, Munro M and Wiebe1998) is one of the few empirical studies that focused on the efficacy of PI under both conditions, finding that both treatment groups showed improvement in comprehensibility at the controlled level. However, only one of the treatment groups (i.e., the suprasegmental group) demonstrated improved comprehensibility in spontaneous speech, but whether the suprasegmental group maintained these gains in the long run is unknown because the study did not include a delayed posttest. Accordingly, the efficacy of instruction remains relatively unclear, especially at the spontaneous level, which calls for more carefully designed empirical studies involving both controlled and spontaneous tasks.
As evident from the review, there is a dearth of empirical studies that take all the crucial issues of PI into account when conducting research, with Derwing et al. (Reference Derwing, Munro M and Wiebe1998) being a notable exception. However, their study was conducted in an English as a second language context; stronger and more recent empirical evidence drawn from a range of contexts is required. Moreover, their study indicated other crucial issues worth investigating, namely, whether the suprasegmental gains at the spontaneous level are maintained and to what extent one type of explicit PI is superior to the other. Inspired by these issues and seeking to build upon Derwing et al. (Reference Derwing, Munro M and Wiebe1998), our study investigates whether learners’ pronunciation, as measured by comprehensibility, improves after 18 weeks of explicit PI in an English as a foreign language (EFL) context in which all participants share the same language background (Mandarin Chinese). The following two research questions were adopted:
1. To what extent does the pronunciation development of learners receiving explicit PI differ from that of learners who receive no specific pronunciation (NSP) instruction?
2. To what extent do learners differ in pronunciation improvement as measured by comprehensibility depending on the focus of their explicit PI (i.e., segmental vs. suprasegmental)?
METHOD
PARTICIPANTS AND CONTEXT
Ninety students (52 female and 38 male) at a key universityFootnote 1 in China, with Mandarin Chinese as their L1, took part in this study. We originally recruited 100 students; two of them did not finish the background questionnaire, three did not finish the posttest, and five did not finish the delayed posttest, leading to a final sample of 90 participants in the age range of 18–20 years old. All respondents were non-English majors from three intact English classes in the first half of their second year. For convenience and due to the impossibility of randomly assigning participants to different groups, we decided to use intact classes for this study. At this university, all non-English majors must attend English courses during their first two years; all participants took a placement test at the beginning of their first year and were assigned to English classes accordingly. The three classes that we chose for our study were at approximately the same level of proficiency (intermediate; International English Language Testing System [IELTS] level 4–4.5). They were required to attend skills-based (i.e., reading, writing, listening, and speaking) English classes twice a week for a total of 3 hours and 20 minutes per week. They usually had English classes each Tuesday and Friday. The same English teacher, originally from the northern region of China, whose L1 was Mandarin Chinese, taught all three classes.
A background questionnaire was administered, asking among other things about the students’ English learning experience (in years), whether they thought English was vital and why, whether they were motivated to learn it, and whether they had previously received English PI. Most students (86%) had never taken an English course with a non-Chinese teacher. The majority (97%) said that no teacher had taught them about pronunciation in detail. The average age of the students was 19 years old (range = 18–20), and most thought English was vital in their life (80%). Some wrote that they were going to take the IELTS, the Test of English as a Foreign Language, or the Graduate Record Examination later on because they planned to study abroad (20%). Some thought they would use English in their future careers (40%), while others affirmed that they needed it to read academic papers in English (20%). Reflecting these various needs, students were strongly motivated to learn English as their L2.
We categorized the three intact classes as the segmental (N = 30), suprasegmental (N = 31), and control (N = 29) groups. All students were exposed to exactly the same instruction and curriculum, except that the segmental and suprasegmental groups’ program included a pronunciation component. Their English teacher was the first author of this article; linguistics courses were part of her MA and PhD, and she has been teaching English majors a course called “English Pronunciation and Intonation” for five years.
MATERIALS AND INSTRUCTION
The participants in our study had English classes two days per week. The segmental group received 35 minutes of segmental instruction in each of their English classes over an 18-week period, with the instructor emphasizing individual vowels and consonants. Similar to K. Saito (Reference Saito2011), the instructor targeted several specific phonemes (International Phonetic Alphabet, IPA): /ɪ, æ, əʊ, aʊ, f, v, s, z, θ, ð, n, ŋ/. These sounds were considered to be problematic for Chinese EFL learners based on previous research (Saito, Reference Saito2011), the researchers’ observations, several surveys that we had previously administered to English majors concerning which sounds troubled them most, and commonly used textbooks on PI. Moreover, as instructors have to limit PI content due to the 18-week time constraint, they usually focus only on those aspects that are problematic for learners rather than spending little time on every sound in an effort to cover all English phonemes. This focus may also foster greater qualitative language awareness in relation to these sounds, which may lead to greater comprehensibility (Kennedy & Trofimovich, Reference Kennedy and Trofimovich2010). Research indicates that explicit learning conditions and classroom-based tasks designed to focus learners’ attention on specific forms may be more effective for foreign language classrooms (Ellis, Reference Ellis2003). Some other pronunciation studies point out that nontarget segmental realizations can seriously reduce comprehensibility (e.g., Zielinski, Reference Zielinski2008). The instructor utilized the textbook English Pronunciation & Intonation for Communication (Wang, Reference Wang2005) as well as videos on “Pronunciation Tips” from the online program BBC Learning English. The explicit PI for the segmental group was designed to employ the presentation–practice–production (PPP) sequence, which includes explicit information on how to pronounce the sounds, practice, and production, focusing on one pair of sounds (e.g., /ɪ/ and /æ/) for three weeks (Derwing et al., Reference Derwing, Munro M and Wiebe1998). For example, during the first class, the participants were asked to read a description in the textbook of how to pronounce each sound (around 10 minutes). The instructor then spent about 25 minutes playing the BBC videos, explaining how to pronounce the target sounds and providing some examples. In the subsequent classes, the participants received a number of words containing the sounds to be practiced, followed by other exercises chosen from the textbook, covering listening-checking, sound discrimination, listening and speaking, and sounds for information (i.e., dialogue reading). The instructor made no attempt to focus on suprasegmental elements.
Similarly, the suprasegmental group received 35 minutes of suprasegmental instruction in each of their English classes over an 18-week period. The instructor focused on features including word stress, sentence stress, strong and weak forms, liaison (i.e., linking), rhythm, and intonation, all of which were discussed in the textbook. A different suprasegmental feature was introduced every 3 weeks. The instruction included an explanation of the feature, followed by exercises from the same textbook used for the segmental group. Movie-dubbing activities based on the analysis of suprasegmental features in the script were implemented. For example, for rhythm practice, during the first class, the participants were asked to read explicit information in the textbook concerning the definition of rhythm and rhythmic pattern in English (around 10–15 minutes); then, the instructor explained English rhythmic patterns in detail by providing some examples (around 15–20 minutes), and the participants did a number of exercises in the subsequent classes, such as listening-checking, speaking-imitation, and speaking–rhythmic pattern, to practice the different rhythmic patterns of English. Finally, they participated in a movie-dubbing activity after analyzing how the targeted suprasegmental features would be realized in the script. The instructor made no attempt to focus on specific individual consonants and vowels.
The control group received NSP instruction. All participants in the control group had normal English listening, speaking, reading, and writing classes each week.
DATA COLLECTION
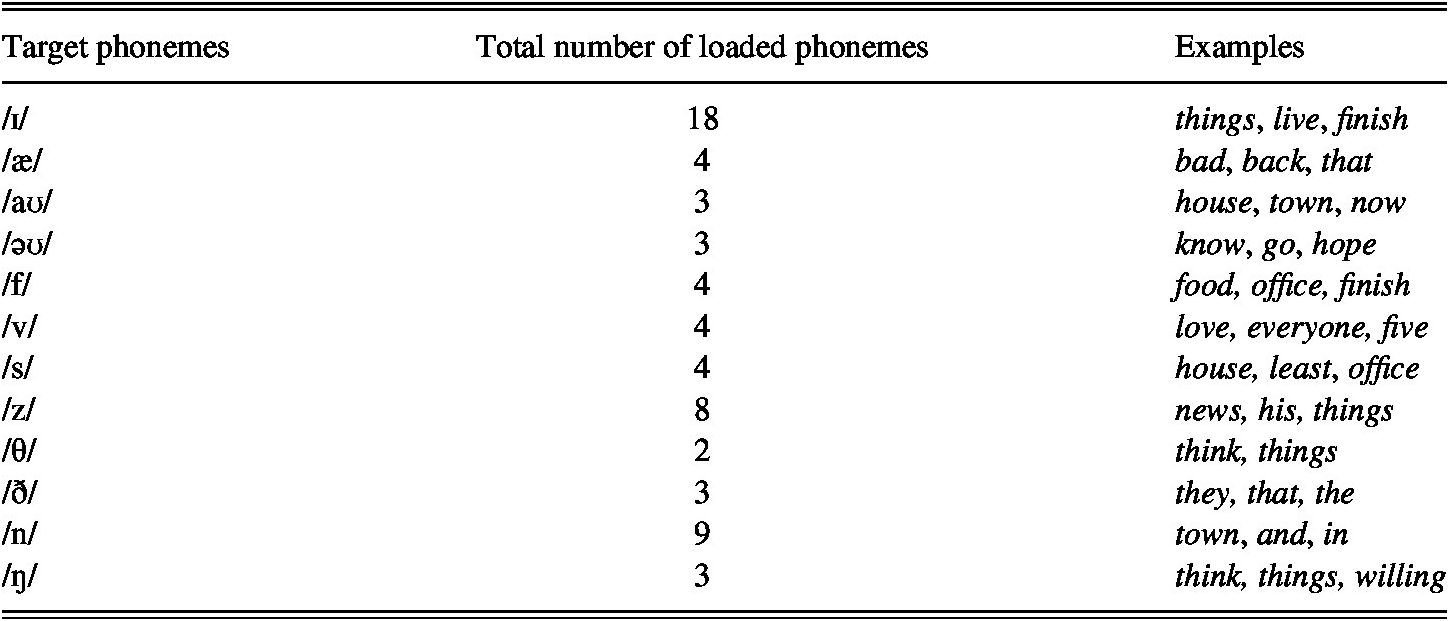
The course lasted 18 weeks. We collected speech samples from all participants at the beginning of the course (pretest), at the end of the course (posttest), and 20 days after the course ended (delayed posttest). The students recorded their utterances in language laboratories. A sentence reading task was used to measure their performance in the controlled condition, and a picture description task was employed to gauge their performance in a spontaneous context (e.g., Derwing & Munro, Reference Derwing and Munro1997; Derwing et al., Reference Derwing, Munro M and Wiebe1998; Munro et al., Reference Munro, Derwing and Morton2006). We deliberately chose four loaded sentences from the textbook and designed them to assess participants’ performance on each of the phonemes (see Appendix I). In total, the four sentences had 36 loaded words that included one or more of the targeted phonemes (see Table 1). These four sentences were randomly presented to participants to read, together with four nonloaded sentences as distractors; these included a few problematic sounds to avoid drawing attention to what was being tested.
Content of loaded sentences, with 36 loaded words out of 49

The picture description task, designed to assess participants’ spontaneous speech (see Appendix II), comprised six pictures relaying a funny visual story. We found the pictures in an English textbook for college students (College English—New Idea Oral English for College Students; Zhang & Mu, Reference Zhang and Mu2005). The participants were asked to describe the story as if they were talking to someone who had never seen the pictures before. Forty-five seconds of their speech were selected from the beginning, and the listening stimuli were extracted from that excerpt. The order of the tasks was fixed for all participants. First, they were given the sentence reading task. They read four loaded sentences along with four nonloaded sentences as distractors. Next, the participants performed the picture description task. To familiarize them with the task, each respondent first practiced using a separate set of six pictures, then immediately afterward moved on to a second set of pictures, which were used for the real test. They were allowed sufficient time to think about what to say and to ask the instructor questions about vocabulary and expressions they intended to use, but they were not allowed to write anything down while preparing.
The same test procedure was conducted for the pretests, posttests, and delayed posttests. Computer software recorded all speech stimuli and saved them in MP3 format. We used 540 recorded samples in total (90 participants × 3 pre-/post-/delayed posttests = 270 recordings; 1 picture description × 90 participants × 3 pre-/post-/delayed posttests = 270 descriptions). We excluded all practice descriptions and distractor sentences.
As noted earlier, the English pronunciation tests comprised a pretest, an immediate posttest, and a delayed posttest. The pretest was conducted in a classroom setting (in this case, a language lab) over a period of three days. Participants were dispersed across four language labs, with only five to six people in each, to ensure that they would not disturb each other and to prevent their recordings from interfering with one another. We explained the testing process to the students and answered their questions. Next, we recorded their responses. The immediate posttest and delayed posttest were conducted in the same way.
DATA ANALYSIS
Listener-Raters
To measure improvements in learners’ pronunciation through increased comprehensibility, we adopted a human rating method, similar to other studies (e.g., Derwing et al., Reference Derwing, Munro M and Wiebe1998; Saito, Reference Saito2011). Six native English speakers, American teachers of English ranging in age from 30 to 40 years old, judged the students’ speech. One worked at the university the participants attended, and five worked at another university nearby, in Beijing. None of the six raters had any contact with the participants, and all reported normal hearing (Derwing et al., Reference Derwing, Munro M and Wiebe1998). We categorized them as “trained NE [native English] listeners” because they were English teachers who reported having regular contact with a wide variety of EFL learners and familiarity with L2 speech.
To reduce the likelihood of fatigue, which could influence the reliability of the scores (Saito, Reference Saito2011), the listeners completed the rating task over three separate days. The raters gathered in a lab, where they heard the stimuli through headphones and rated the data for comprehensibility on a 9-point scale. To ensure intrarater and interrater reliability, raters were presented with warm-up items, including both sentences and picture descriptions, at the beginning of the listening task (recordings were from four randomly selected tested students). They were advised to discuss their scores for sentences and picture descriptions, allowing them to become familiar with one another’s rating rationales. Their rating process was self-paced. For each sentence stimulus they decided how difficult the utterance was to understand and circled a comprehensibility rating ranging from 1 (very easy to understand) to 9 (impossible to understand). Immediately afterward, they judged the same student’s comprehensibility on the picture description task. We advised them to rate students employing the entire scale. Comprehensibility ratings for the sentence reading and picture description tasks were calculated separately to obtain final comprehensibility scores for each participant. Each speaker’s stimuli were presented randomly by test state (i.e., pretest, posttest, delayed posttest).
Statistical Tests Used for Analysis
The data were analyzed using SPSS 24.0. The intraclass correlation coefficients (ICCs) were analyzed first, with ICC = .79 for the comprehensibility scores on the sentence reading task and ICC = .80 for those on the picture description task. The interclass correlation coefficients of the six raters were r = .80 for the comprehensibility scores on the sentence reading task and r = .75 for those on the picture description task. All coefficients indicated adequate reliability.
Next, we carried out a series of statistical analyses including descriptive statistics, t-tests, and analyses of variance (ANOVAs).
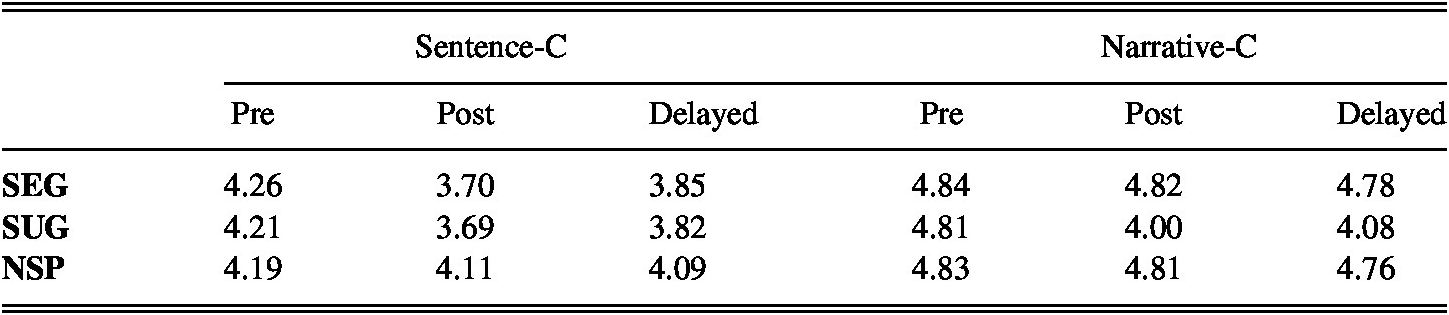
All three groups’ comprehensibility scores on the sentence reading and picture description tasks were submitted to descriptive analysis. Table 2 summarizes the mean scores of the three groups on the pre-, post-, and delayed posttests.
Descriptive statistics for the three groups’ mean scores on comprehensibility (1 = very easy to understand; 9 = impossible to understand)

Notes: SEG = segmental instruction group; SUG = suprasegmental instruction group; NSP = no specific pronunciation instruction (i.e., control) group; Sentence-C = comprehensibility score on sentence reading task; Narrative-C = comprehensibility score on picture description task.
To ensure the participants’ homogeneity and make the three groups’ performance on the posttests comparable, all three groups’ comprehensibility scores on the pretest were submitted to a one-way ANOVA, with teaching condition (segmental, suprasegmental, or control) as the factor. A significance cutoff of p = .05 applies to all the analyses reported in the following text. No statistically significant differences in comprehensibility were found at pretest on the sentence reading task [F(2,87) = 1.514, p = .231 > .05] or the picture description task [F(2,87) = 0.266, p = .767 > .05]; in other words, according to the results, the three groups appeared to have similar performance on pronunciation as measured by comprehensibility. The effect sizes were then calculated because the lack of a statistically significant difference on the pretest is not sufficient evidence of the participants’ comparability, especially given the relatively small sample sizes. All d values were ≦ .25. Plonsky and Oswald (Reference Plonsky and Oswald2014) suggest that L2 researchers adopt “the new field-specific benchmarks of small (d = 0.40), medium (d = .70) and large (d = 1.00) to interpret the practical significance of L2 research effects more precisely” (p. 889). Accordingly, the statistics yielded here indicate that the three groups had similar performance on pronunciation as measured through comprehensibility at this stage, which speaks to the participants’ homogeneity.
A repeated-measures ANOVA and several paired-samples t-tests were then employed to answer the two research questions. The data were verified to meet the assumptions for an ANOVA, with normality of variance tested by the Shapiro–Wilk test, ranging from .146 to .971, and equality of variance tested by Levene’s test, ranging from .201 to .772 (all p-values > .05).
RESULTS
To answer the first research question, on the extent to which the pronunciation development of L2 English learners receiving explicit PI differs from that of a control group receiving no explicit PI, we used a repeated-measures ANOVA to compare the effects of test time and focus of instruction as well as their interactions. The within-subject factor was test time (pretest, posttest), and the between-subjects factor was focus of instruction (segmental PI, suprasegmental PI, no PI). Both the segmental [F(2,87) = 143.68, p < .05] and suprasegmental group [F(2,87) = 121.19, p < .05] were found to differ significantly from the control group in sentence reading comprehensibility, but only the suprasegmental group was found to have significantly improved in picture description comprehensibility [F(2,87) = 199.66, p < .05].
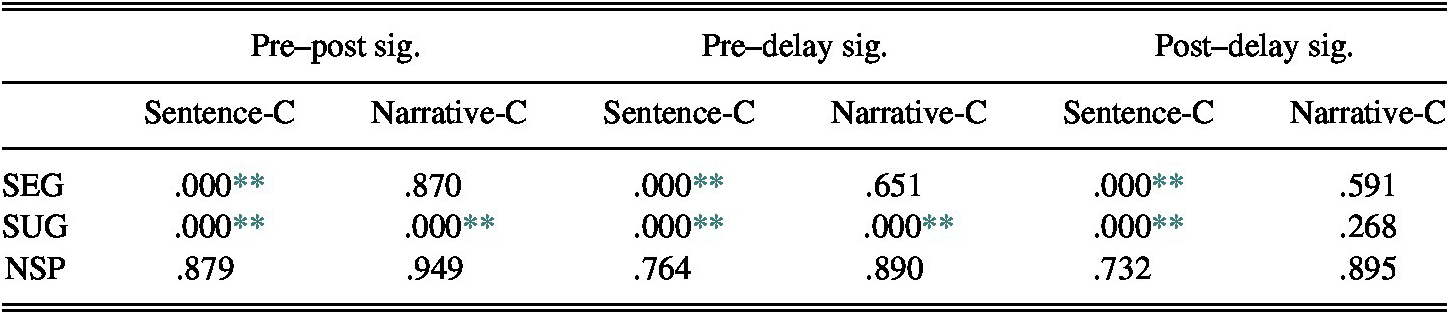
To answer the second research question, concerning to what extent learners receiving explicit PI with different foci differ in pronunciation improvement as measured by comprehensibility, several paired-samples t-tests were conducted. The results are presented in Table 3.
Significance of comprehensibility scores on pretest vs. posttest vs. delayed posttest (1 = very easy to understand; 9 = impossible to understand)

** p < .01
Notes: SEG = segmental instruction group; SUG = suprasegmental instruction group; NSP = no specific pronunciation instruction (i.e., control) group; Sentence-C = comprehensibility score on sentence reading task; Narrative-C = comprehensibility score on picture description task.
Both experimental groups significantly improved their comprehensibility on the sentence reading task after 18 weeks of explicit PI. Effect sizes were calculated to further investigate, showing that the effect size of segmental instruction (d = 1.38) was slightly larger than that of suprasegmental instruction (d = 1.05) on the sentence reading task. However, according to the benchmarks proposed by Plonsky and Oswald (Reference Plonsky and Oswald2014), both of these effects were large, indicating that explicit instruction on either segmental or suprasegmental features had an impact on the development of L2 pronunciation as measured by comprehensibility at the controlled level.
In contrast, in the spontaneous condition, only the suprasegmental group significantly improved their picture description comprehensibility, as shown in Table 3. Effect sizes were then calculated. Compared with the segmental group (d = 0.20), suprasegmental instruction had a much larger effect on the participants’ comprehensibility performance (d = 1.51) at the spontaneous level.
Next, to determine whether these gains were sustained over time, the delayed posttest mean scores of the groups were compared, and the results are presented in Table 3. Both experimental groups maintained their gains in the sentence reading task at the delayed posttest, but only the suprasegmental group did so at the spontaneous level, that is, in the picture description task. Furthermore, although comprehensibility scores decreased for the suprasegmental group at the delayed posttest (M = 3.82, 4.08) compared to the immediate posttest (M = 3.69, 4.00), there remained a distinct improvement when compared to their pretest performance. This result was also supported by the respective effect sizes (d = 0.83, 1.42). Hence, the suprasegmental group was the only one to maintain its gains on the delayed posttest.
Table 4 portrays the effects of instruction on the three groups’ pronunciation development, as measured by comprehensibility.
Effects of instruction on performance in the three groups

Notes: SEG = segmental instruction group; SUG = suprasegmental instruction group; NSP = no specific pronunciation instruction (i.e., control) group.
The control group did not show any statistically significant progress on either the posttest or the delayed posttest, at either the controlled level or the spontaneous level.
DISCUSSION AND IMPLICATIONS
Our study primarily investigated whether EFL learners in China could improve their L2 English pronunciation (as judged by comprehensibility) after undergoing 18 weeks of explicit PI and to what extent learners differ in pronunciation improvement depending on the focus of their explicit PI (segmental vs. suprasegmental). In the following sections, we summarize and discuss the major findings of the study in terms of possible reasons and pedagogical implications.
There are three major findings of the study. First, both the segmental and the suprasegmental group advanced significantly in terms of the comprehensibility of their pronunciation on the sentence reading task (controlled production). In contrast, the NSP (control) group’s scores did not meaningfully improve at the immediate posttest. Second, only the suprasegmental group showed improved comprehensibility in the picture description task (the spontaneous condition), and this effect was maintained in the delayed posttest. Finally, the effect sizes indicated that the two pronunciation-focused groups had similar improvements in comprehensibility at the controlled level, in contrast to the NSP group. At the spontaneous level, however, the effect of explicit PI on suprasegmentals was found to be almost eight times that on segmentals. This indicates that the results of Derwing et al. (Reference Derwing, Munro M and Wiebe1998) have been partially replicated in an EFL classroom setting, providing clearer and stronger empirical support for the superior effect of explicit PI on suprasegmentals in spontaneous speech. One possible reason for this finding is that spontaneous tasks (e.g., the picture description task in our study) are relatively complex and difficult, with their primary focus lying in using spontaneous or procedural knowledge (Saito & Plonsky, Reference Saito and Plonsky2019). In these tasks, L2 learners’ attention is divided, as the tasks “necessitate that attention be divided amongst lexical access, syntactic well-formedness, phonological accuracy, discourse organization, and so forth” (Derwing et al., Reference Derwing, Munro M and Wiebe1998, p. 406), incurring a heavier and more widely distributed cognitive burden for L2 learners. Compared with the segmental elements, therefore, the suprasegmental features comprise “a range of more global prosodic phenomena” and “larger chunks of speech” (Gordon & Darcy, Reference Gordon and Darcy2016, p. 82), which are more helpful for L2 learners when applying their knowledge to such spontaneous tasks. This finding may indicate that explicit PI on suprasegmentals would be more helpful than on segmentals in real communication (Thomson & Derwing, Reference Thomson and Derwing2015).
Our findings also suggest that explicit PI following the PPP sequence can be beneficial for learners. The PPP approach may effectively direct learners’ attention because “people learn about the things that they attend to and do not learn much about the things they do not attend to” (Schmidt, Reference Schmidt and Robinson2001, p. 30). Couper (Reference Couper2011) points out that “the focus of successful pronunciation teaching is on ensuring that learners understand not just that there is a problem with their pronunciation but also precisely where the problem lies” (p. 176). In other words, learners should both notice the gap and know how the gap is generated, allowing them, “with the right kind of practice and feedback, … to overcome their pronunciation difficulties” (Couper, Reference Couper2011, p. 176).
Nonetheless, such findings do not necessarily support abandoning a segmental focus in pronunciation teaching because this too had a beneficial impact on learners’ comprehensibility at the controlled level. Learners are usually encouraged to develop metalinguistic awareness of a rule when they receive explicit instruction (Ellis, Reference Ellis, Ellis, Loewen, Elder, Reinders, Erlam and Philp2009). For this reason, Derwing and Munro (Reference Derwing and Munro2005) and Venkatagiri and Levis (Reference Venkatagiri and Levis2007) maintain that explicit PI, no matter whether on segmentals or suprasegmentals, can help improve students’ phonological awareness (i.e., conscious knowledge of segmentals or suprasegmentals), which may play a key role in their L2 comprehensibility. Derwing et al. (Reference Derwing, Munro M and Wiebe1998) point out that segmental errors that cause communication breakdowns can potentially be repaired if L2 learners are aware of relevant differences, while Gordon and Darcy (Reference Gordon and Darcy2016) believe that a segmental group’s comprehensibility could be improved if learners have been “trained on the entire segmental inventory of English, including both consonants and vowels, or on different segmentals that are perhaps more crucial to comprehensibility” (p. 82).
In conclusion, our findings point to the positive effect of explicit instruction—especially that focusing on suprasegmentals—on EFL learners’ pronunciation development in an EFL context. However, the study also has a number of limitations. First, given that it takes time to improve pronunciation skills, a delayed posttest only 20 days after the initial posttest may not be sufficient to detect the full extent of changes; therefore, a longer time interval between the posttest and delayed posttest should be allowed in future studies. In addition, we focused only on the type of instruction, rather than different activities or corrective feedback that may help students improve their pronunciation. Future studies could focus on the effects of different activities or explicit PI with implicit/explicit corrective feedback. Moreover, learners’ individual differences should be taken into consideration, and the use of a diagnostic test of English pronunciation should be encouraged; such a test or individualized discussions with the learners about the problems should be administered before explicit PI to help the teacher identify students’ individual difficulties. In any case, the findings of this study provide evidence of actual benefits of pedagogical intervention in speech production and extend our knowledge of the respective effects of segmental and suprasegmental instruction. We hope that the findings reported here will contribute to the development of a set of generalizable principles in this realm.
APPENDIX I SENTENCE READING TASK
1. Chinese know and love good food. (5 out of 6 words are loaded)
/tʃaɪni:z nəʊ ənd lʌv gʊd fu:d/
2. Do you think they are willing to live in that house? (7 out of 11 words are loaded)
/du ju θɪŋk ðeɪ ɑ:(r) wɪlɪŋ tə lɪv ɪn ðæt haʊs/
3. He read the bad news aloud just now because he hoped everyone could hear it. (12 out of 15 words are loaded)
/hɪ red ðə bæd nju:z əˈlaud dʒʌst naʊ bɪkɒz hɪ həʊpt evrɪwʌn kʊd hɪə (r) ɪt /
4. He needs to go back to his office because he has at least five things to finish. (12 out of 17 words are loaded)
/hɪ ni:dz tə gəu bæk tə hɪz ɒfɪs bɪkɒz hɪ hæz ət li:st faɪv θɪŋz tə fɪnɪʃ/
APPENDIX II PICTURE DESCRIPTION TASK
Task instruction: In this task, there is a series of pictures. Some information is given to help you better understand the plots. You need to tell a funny story based on the pictures. There is no time limit.
Students were shown six pictures from College English—New Idea Oral English for College Students (2005), showing a man visiting a doctor. In a speech bubble, the man tells the doctor he hurts all over. The doctor asks him where, and the man starts to point to different parts of his body, saying “Ouch,” “I hurt here,” etc.