Introduction
Maize (Zea mays L.) is a native crop of Mexico, and its greatest genetic diversity is found in Mexico. Maize is cultivated in and adapted to diverse environmental variations in soil, temperature and cultural practices. Therefore, specific locally adapted (land race) populations have been developed with attributes that differentiate them from each other, conditions that recognizes Mexico as the centre of origin and diversification for maize (Kato et al., Reference Kato, Mapes, Mera, Serratos and Bye2009). In addition to adaptation to diverse environmental conditions, the diversity is driven by traditional seed exchange by farmers, which is followed by genetic recombination. Together, these factors account for the actual genetic diversity, which has been documented and recognized as comprising 59 races of maize in Mexico (Mera, Reference Mera, Kato, Mapes, Mera, Serratos and Bye2009). Maize diversity has been described by the racial classification approach, based on morphological data (Wellhausen et al., Reference Wellhausen, Roberts, Hernández and Mangelsdorf1951). In the state of Coahuila, Mexico, maize diversity has been documented by representative race populations such as Tuxpeño (Wellhausen et al., Reference Wellhausen, Roberts, Hernández and Mangelsdorf1951), Raton and Tuxpeño Norteño (Ortega, Reference Ortega1985), Celaya, Conico Norteño, Elotes Conicos and Olotillo (Rincόn et al., Reference Rincón, Hernández, Zamora, Hernández, Rincón, Castillo and Ruiz2010b).
In the state of Coahuila, 24.9 thousand ha of maize was sown for kernel production in 2016. Of this maize, 84.7% was planted in the southeast region, mainly with local adapted populations (land race populations), and 94.8% was planted under rain-fed conditions (SIAP, 2016). Based on the environmental conditions, this region is considered critical, as it has an average annual precipitation ranging from 350 to 450 mm; an average temperature of 16.8°C; and drought and frost seasons within the year.
Maize diversity is based on the number of native populations identified; however, each population requires a representativeness, which is determined by a sample of the number of individuals during the collecting procedure (usually between 30 to 50 ears). Passport data (Engels et al., Reference Engels, Arora, Guarino, Guarino, Rao and Reid1995; FAO-Bioversity, 2012), which represent the population identity recorded during the collecting process, may be useful to describe the adaptiveness of the genetic material. In addition to passport data, maize diversity is achieved through qualitative and quantitative traits of the plant and ear (IBPGR, 1991). Several authors have emphasized that the reproductive organ traits, such as the ear traits, are the most useful traits for race classification in maize (Goodman and Paterniani, Reference Goodman and Paterniani1969; Sanchez et al., Reference Sanchez, Goodman and Rawlings1993).
The knowledge of maize diversity on a regional basis makes it possible to define strategies for genetic conservation and potential use by plant breeding programmes. The relationships between the racial complexes formed by local adapted populations within the region can be used to determine a representative subset that concentrates maize diversity.
For this paper, collected samples and recorded data were analysed to describe the maize genetic diversity in the southeast region of Coahuila State in Mexico. The objectives of the study were to describe the maize diversity and to use quantitative ear traits to develop a representative subset of populations that concentrate the diversity in the southeast of Coahuila.
Materials and methods
The area of study is located in the southeast of the state of Coahuila in Mexico. Coahuila is situated in the north-central part of Mexico, with a territorial area of 151,571 km2. The climate is dry to very dry, and it is semi warm, with an average temperature ranging from 18 to 20°C and an annual average precipitation of 316 mm.
Seventy-seven maize populations were collected in the southeast of Coahuila State in Mexico, with a sample size that varied from 20 to 50 ears, at altitudes ranging from 774 to 2557 masl. Fifty-one populations were collected in 2008 (Rincόn et al., Reference Rincón, Hernández, Zamora, Hernández, Rincón, Castillo and Ruiz2010b), and 26 were collected in 2010 (unpublished data). These samples represent the maize diversity in the region of study. For each of the maize populations, the sample size collected from the site determines the actual phenotypic expression of the population, which also represents the particular maize population based on the environmental conditions of that sample.
The native maize populations were initially explored, and they were assigned a racial classification as suggested by Wellhausen et al. (Reference Wellhausen, Roberts, Hernández and Mangelsdorf1951), with a subsequent description given based on selected quantitative ear and kernel characters (IBPGR, 1991). Additionally, maize populations were grouped according to their altitudinal adaptation. The following altitude groups were recognized: lowland (<1000 m), intermediate (1001–1800 m), transition (1801–2000 m) and highland (above 2000 m).
Using a sample size of 10 representative ears from the collected sample, 15 quantitative ear and kernel traits were used to analyse the maize diversity. Seven ear traits were used: ear and cob diameter (EAR_DIAM, COB_DIAM) (cm), ear length (EAR_LENG) (cm), ear rows (EAR_ROWS), shelling per cent (SHELL_PCT), and two index traits: cob/ear diameter (COB/EAR_DIAM) (cm), ear diameter/length (EAR_DIAM/LENG) (cm). Eight kernel traits were used: kernel length (KER_LENG), width (KER_WIDTH) and thickness (KER_THICK) (mm), kernel per row (KER_PER_ROW), weight of 100 dry kernel (WT_100_KER) (g), and three kernel index traits: kernel thickness/length (KER_THICK/LENG) (mm), kernel thickness/width (KER_THICK/WIDTH) (mm) and kernel width/length (KER_WID/LENG) (mm). The ear and kernel traits, and the relationships between them (computed index traits) are described elsewhere (Goodman and Paterniani, Reference Goodman and Paterniani1969; IBPGR, 1991; Sanchez et al., Reference Sanchez, Goodman and Rawlings1993).
The data were first examined by analysis of variance to test for differences between adaptation groups and racial complexes. In both cases, populations within groups and populations within races were analysed using the PROC GLM procedure of SAS (SAS Institute, 2004). Maize diversity was explored by principal component analysis (Yan and Kang, Reference Yan and Kang2003; Yan, Reference Yan2012) and cluster analysis (Rohlf, Reference Rohlf2012). Data were standardized by subtracting the mean of each trait and dividing by its standard deviation (Z-score) before associations between populations were computed.
The standardized values of 15 traits were used to compute a distance (dissimilarity) coefficient defined by the complement of the Pearson product-moment correlation among pairs of populations (d ij = 1 − r). A phenogram was generated by NTSYS-pc (Rohlf, Reference Rohlf2012), through the unweighted pair-group method using arithmetic averages (Sneath and Sokal, Reference Sneath and Sokal1973). Based on the phenogram, a representative subset of the total number of native maize populations was defined by a modified stratified and directional sampling within groups to discriminate populations, using the lowest distance values among pairs of populations within retained populations (Rincon et al., Reference Rincon, Johnson, Crossa and Taba1996). A new phenogram was generated to discriminate populations within the previous retained entries. This process continued until the desired number of populations was obtained, yielding the final subset. The directional sample means that, at a decision point (low distance values from the phenogram), the sampling populations were supported by an image of five representative ears taken from the collecting sample. Thus, the final subset would keep all different maize types within each racial complex.
Results
Maize diversity in the region of study
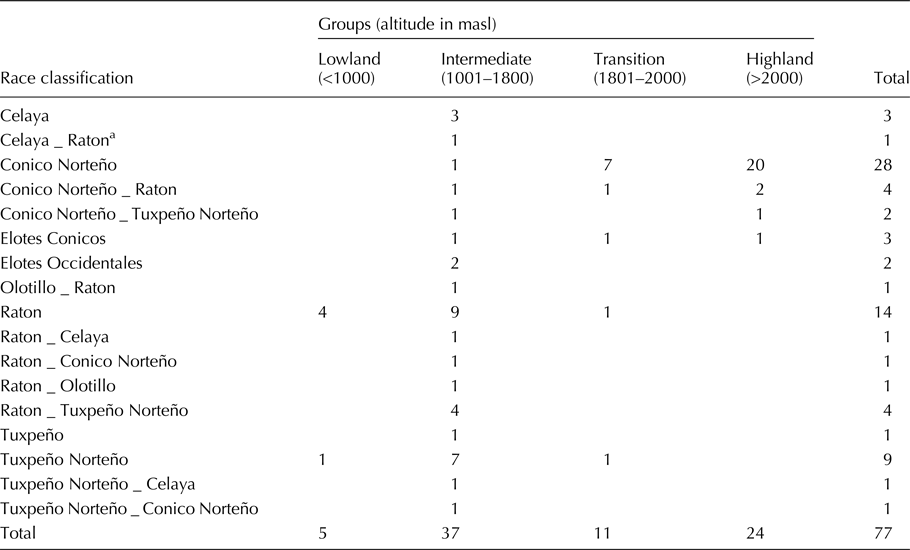
All 77 native maize populations collected in the Southeast of Coahuila State were first explored and assigned a race name classification. These populations were then described based on 15 quantitative ear and kernel traits, which allowed us to identify eight racial complexes (Celaya, Conico Norteño, Elotes Conicos, Elotes Occidentales, Olotillo, Raton, Tuxpeño and Tuxpeño Norteño) and 10 racial combinations that jointly describe the maize diversity in the region of study. Based on the altitudinal strata, all populations were also assigned to an adaptation group (lowland, intermediate, transition and highland) to analyse the capacity for adaptation in the genetic diversity (Table 1).
Racial complexes found in the local populations from Southeast of Coahuila State in Mexico

a Symbol ’_’ between racial complexes indicates some degree of combination or intermediate form between races.
Although populations were collected throughout a wide adaptation range (774–2557 m), almost half of those sampled (48.0%) came from the intermediate altitude. The other 45.5% came from a region of transition to high altitudes, and only five (6.5%) came from altitudes below 1000 m. The adaptation of native populations to a wide range of micro-ecological environments was represented, and there was evidence that populations have inter-crossed, as indicated by the presence of 10 race combinations (Table 1).
Analysis of variance showed significant differences (P ≤ 0.01) between the eight racial complexes and between the four adaptation groups for most traits. There were differences between race types and the corresponding local adaptation groups of the maize populations in the regions. In both cases, population differences within racial complexes and population differences within adaptation groups were significant (P ≤ 0.01). Those differences are sustained by the race groups, the combinations of populations with different racial complexes (Table 1), and the specific adaptation to different ecological environments within the region.
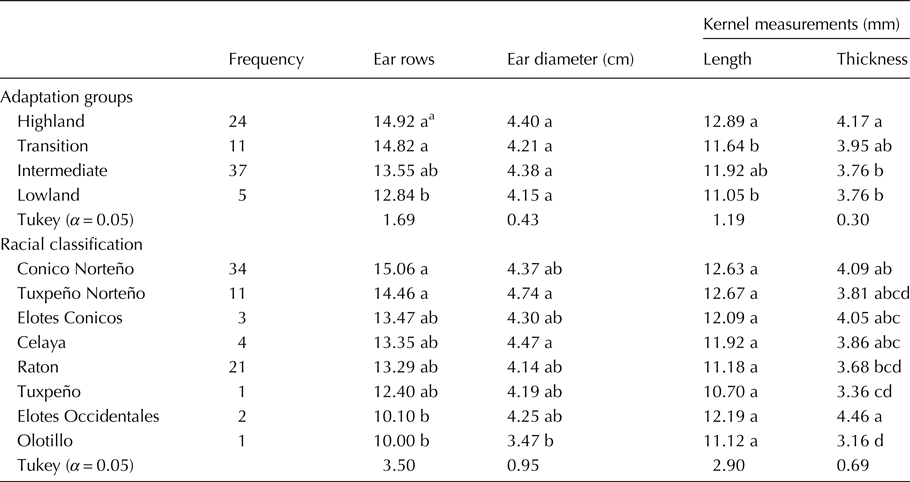
Table 2 presents the mean values of selected ear and kernel traits for the 77 native maize populations, organized by adaptation groups and racial classification.
Means of adaptation groups and racial classification of selected traits of local populations included in the study

a Values with the same letter in the column are not statistically different.
Table 2 shows the differences between adaptation groups and racial complexes for selected traits, even though the number of populations varies in both cases. In addition to frequency, populations within adaptation groups and populations within racial complexes were highly significant (P ≤ 0.01). Furthermore, the presence of racial combinations (Table 1) explains the phenotypic expression and the associated pattern found for the two types of comparisons for the traits included in Table 2. It seems that there is an association of ear rows and kernel thickness with the adaptation area, which can be explained by the low values found for these traits at low altitudes and vice versa. The opposite pattern was shown for ear diameter and kernel length in discriminating the four adaptation groups and the eight primary race classifications. This trait shows a form of interaction with those traits when grouping the native populations into adaptation groups and the corresponding race classifications; moreover, the different race combinations are expressed by genetic combinations among the native populations within the region of study. With the exception of kernel length, differences between racial complexes are evident in the selected traits, even though the number of populations varies in both cases.
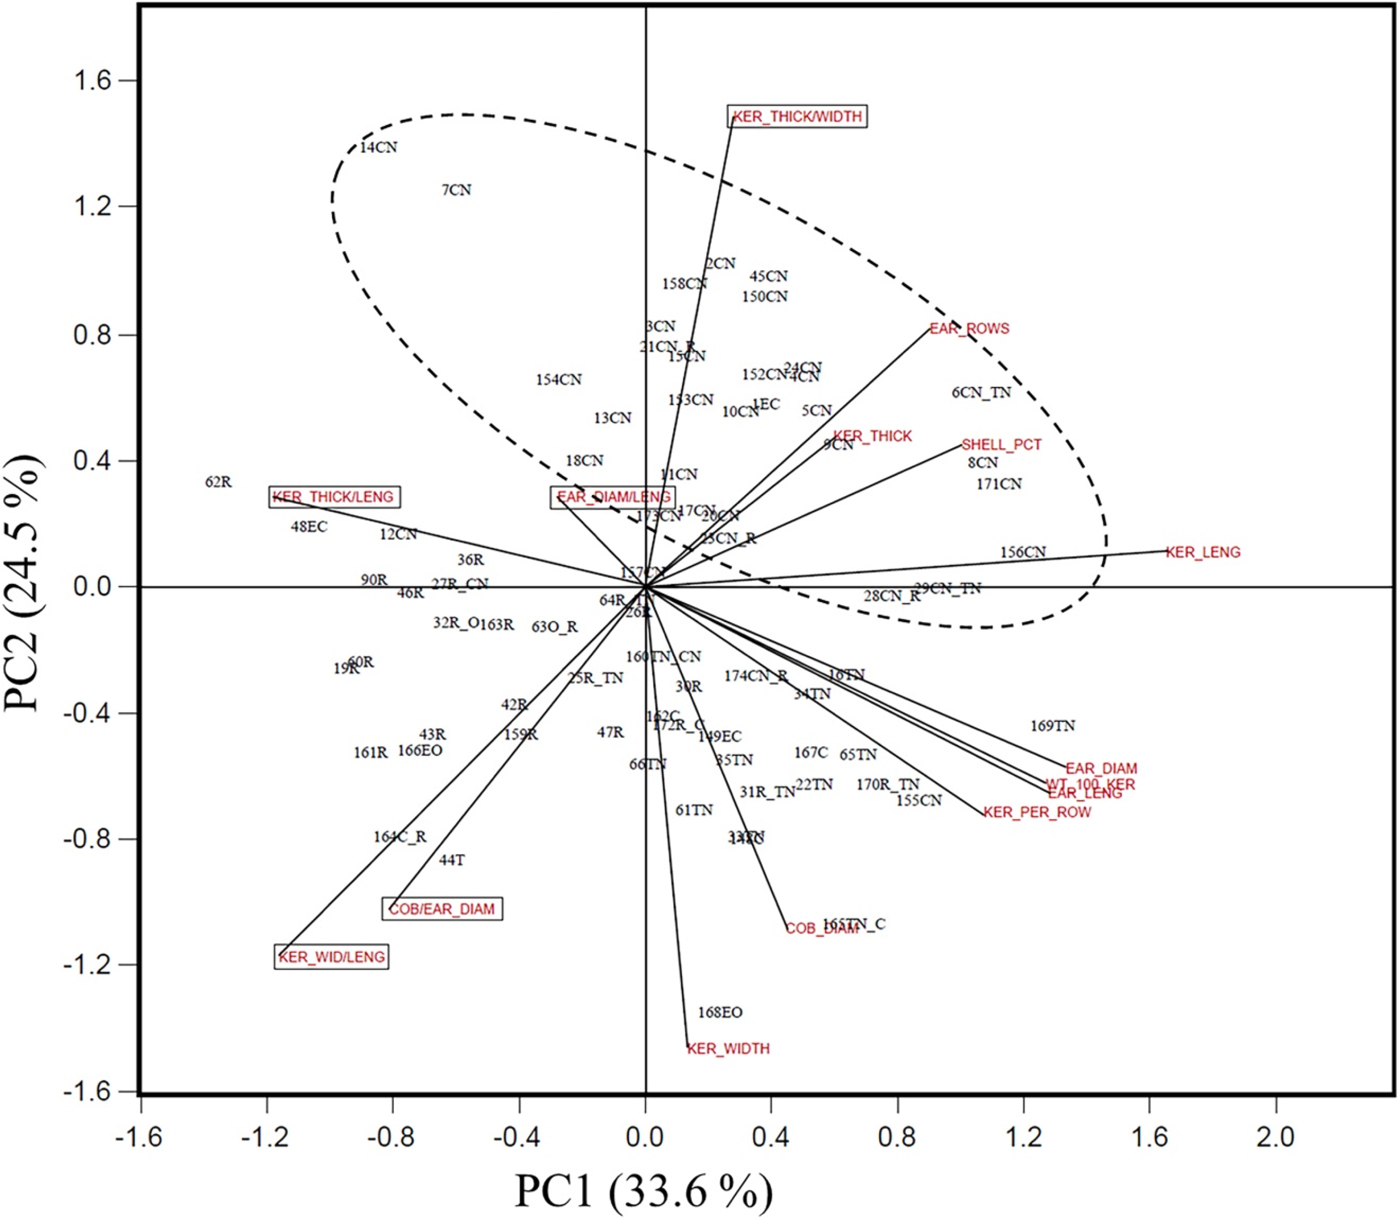
The scatter plot of the interactions among the 77 maize populations for the 15 quantitative traits (10 original and five computed index traits) is presented in Fig. 1.
Scatter plot of the first two principal component scores showing the dispersion of the 77 maize populations and relationship among traits. Populations are identified by population number and combinations of words that indicate the race classification: C, Celaya; CN, Conico Norteño; EC, Elotes Conicos; EO, Elotes Occidentales; O, Olotillo; R, Raton; T, Tuxpeño; TN, Tuxpeño Norteño. Index traits are indicated by a rectangle.

Figure 1 was computed based on the two first principal component scores, which together explain 58.1% of the total variation in all the original traits. When the traits are treated as a vector, the angle between the vector and the origin indicates the association between traits. Therefore, ear diameter (EAR_DIAM), the weight of 100 kernels (WT_100_KER), ear length (EAR_LENG) and kernels per row (KER_PER_ROW) are highly correlated traits (angles less to 45); and the relationships of these traits with cob/ear diameter (COB/EAR_DIAM) and kernel width/length (KER_WID/LENG) show independent performance (angles close to 90). The magnitude of the vector from the origin determines the relative variation that the trait explains; therefore, it defines the usefulness of the trait in discriminating between native maize populations. The five index traits computed using the relationships of the original traits are indicated by a close rectangle (Fig. 1). In addition to the original correlated traits, most of the computed index traits show different relationships among traits and large variances, as indicated by the length of the vector. Thus, they contribute to a complementary relationship to the original traits, and, consequently, they may provide a better explanation for local population differences.
The maize populations and the traits studied are all distributed along the four quadrants in Fig. 1, where individual points (maize population or traits) describe a vector from the origin that indicates the joint association and draws distinctions between maize populations and their relationships with the associated traits. For instance, the group of populations indicated by the dashed oval corresponds mostly to the Conico Norteño and Elotes Conicos, two races adapted to highland altitude that are characterized by a conical ear type. With the exception of a few observations, populations outside the oval show the cylindrical ear type, represented mainly by the races Raton and Tuxpeño Norteño (Table 1).
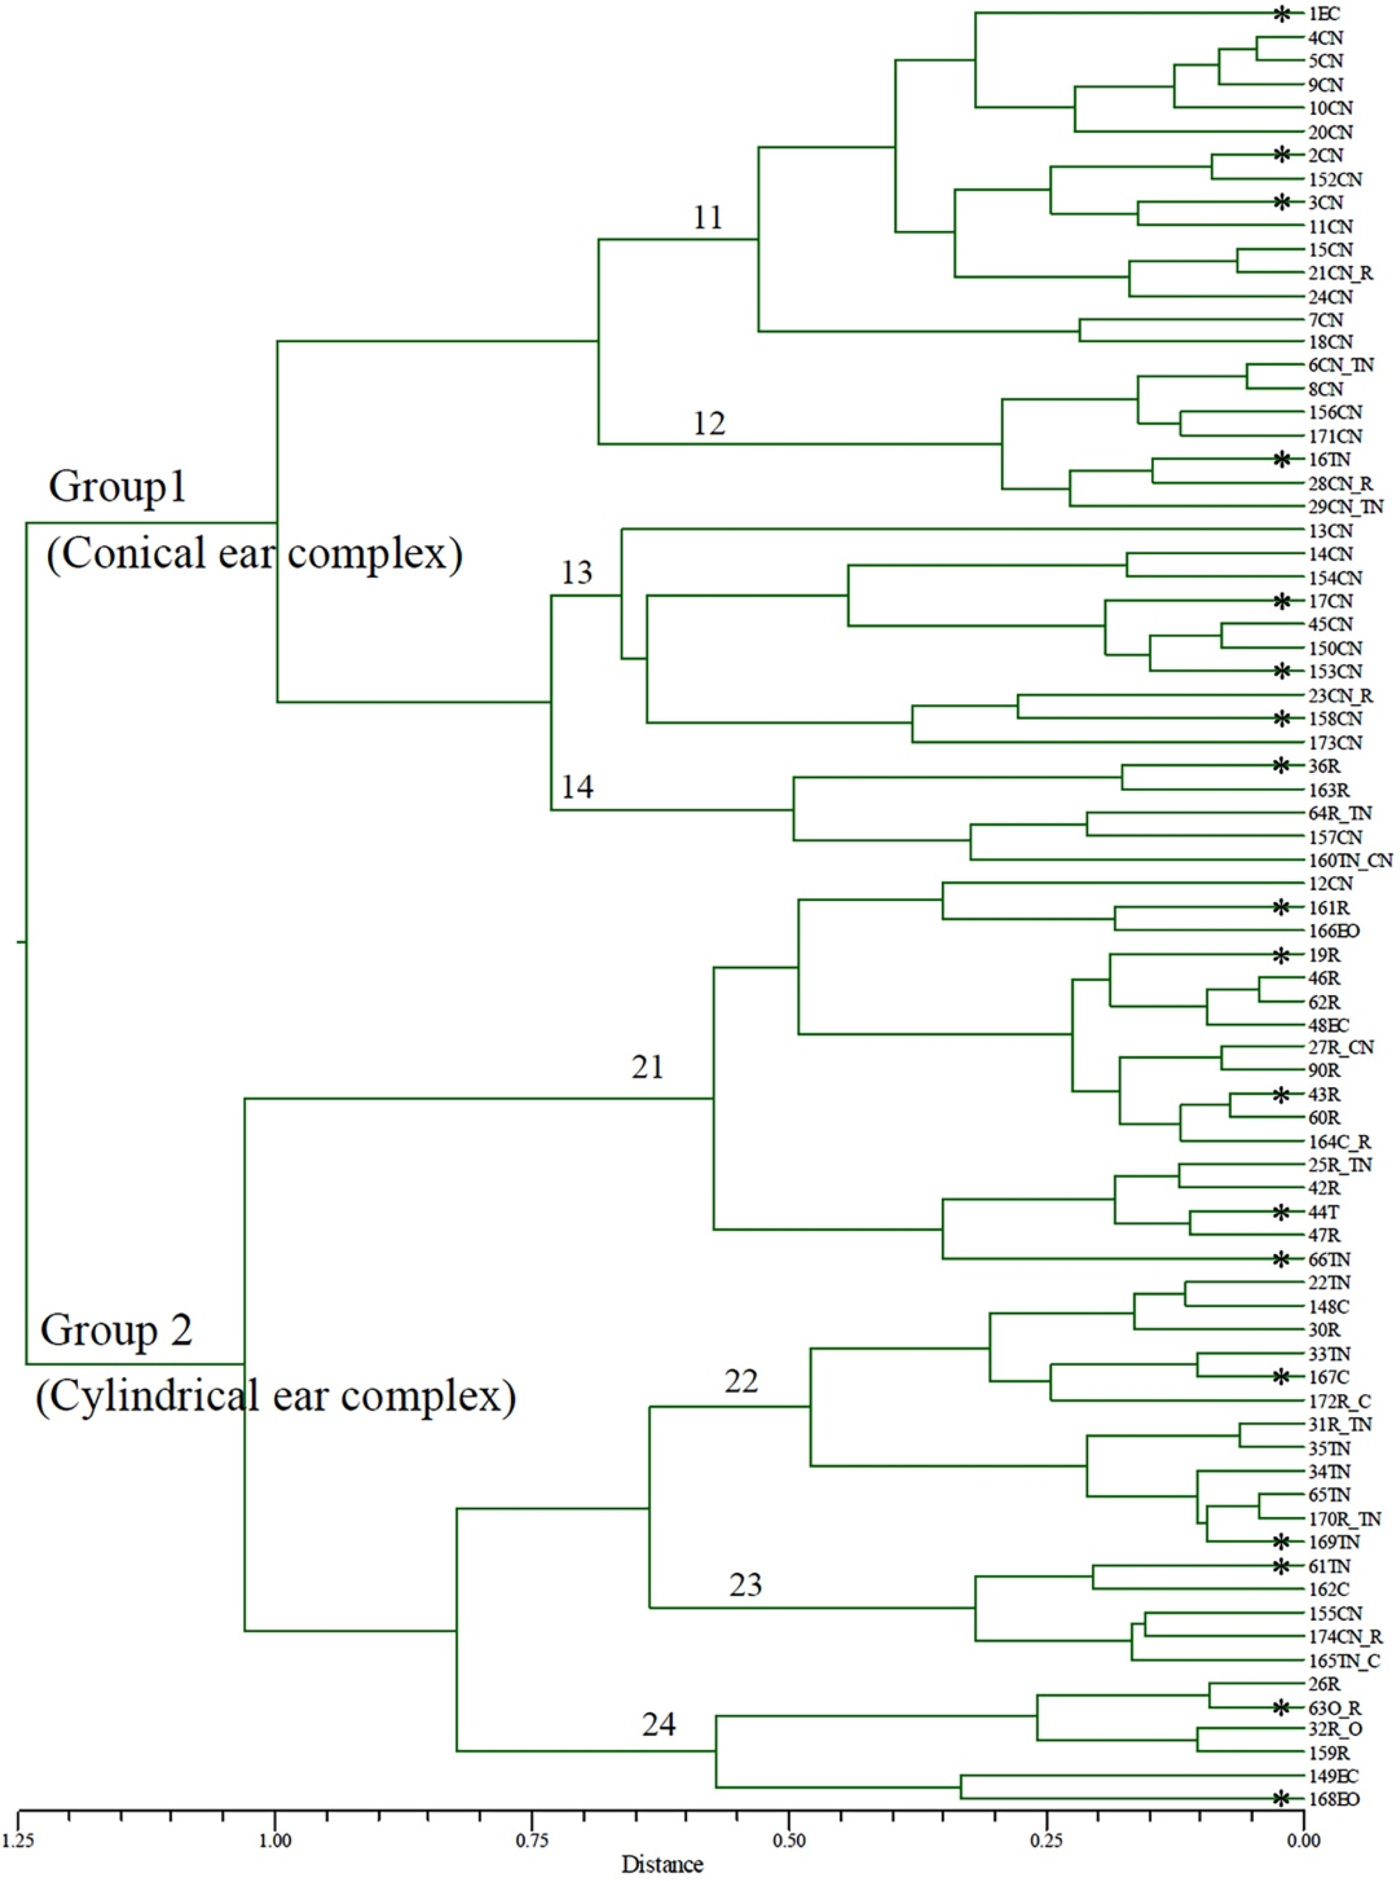
By exploring the dispersion of these population × race complexes in Fig. 1, it is possible to detect a continuous pattern among the races Raton and Tuxpeño Norteño. The distinctions between maize populations from high altitude (conical type) and those from intermediate altitude (cylindrical type), and the relationships within these two main groups, indicate the usefulness of the ear and kernel traits to describe maize diversity. Therefore, cluster analysis, as a classification technique was computed to explore the relationships among the maize populations studied. Figure 2 shows a phenogram of the relationships among the 77 maize populations included in the study.
Phenogram of relationships between 77 maize populations from the southeast of Coahuila state in Mexico. *Assigned populations to final subset.

The phenogram was computed using the 15 ear and kernel traits. At a distance value of 1.05, two main groups were identified. Group 1 was represented by 37 populations, 95% of which were classified as the race Conico Norteño. This group is referred to as the conical ear-type complex. The second group (40 populations), called the cylindrical ear complex, is represented mainly by the races Raton and Tuxpeño Norteño, with 21 and 11 native populations, respectively, in combination with other races identified in the region of study.
In general, Fig. 2 agrees with the race classifications assigned to the maize populations collected in the area of study. With a distance value of 0.68, the two main groups (conical and cylindrical complexes) were split into four subgroups each. In the first case, group 1 was split into four subgroups, three of which (subgroups 11, 12 and 13) had populations that correspond basically to the conical ear type. Five populations from subgroup 14 were the only ones that had race classifications different from the conical type. Although these populations were grouped into the main group 1 (conical type), they are clearly separated and located out of the conical type in Fig. 1. This may be due to some racial combination among the native maize populations.
In the cylindrical ear complex (group 2), each subgroup is represented by several races that are related through a continuous pattern, as shown in Fig. 1, from the race Raton (R) to Tuxpeño Norteño (TN). The presence of several races within a subgroup depends on phenotypic expression based on the ear traits considered, but it may be a consequence of genetic combination among the native maize populations, and, in particular, it may be due to adaptation to the local environments. It is important to realize that Fig. 1 explains only 58.1% of the total variation in the two first principal components, whereas Fig. 2 accounts for the total variation represented by the 15 ear and kernel traits studied.
Development of a representative subset
The phenotypic discrimination among native maize populations (Fig. 1) and the relationships between all populations (Fig. 2) indicate that the set of traits was useful to characterize all populations into two main groups and four subgroups within each group. In general, this classification agrees with the assigned race classifications.
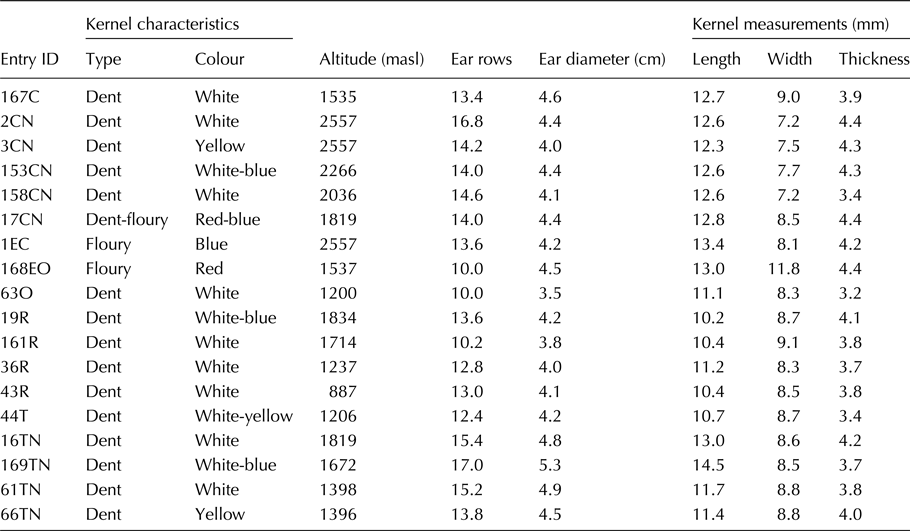
The race classification relationships between the populations shown in the phenogram (Fig. 2) were used to analyse the maize diversity within the region of study, and they were used to initiate a sampling of the maize diversity to define a subset of populations that represent maize diversity in the area of study. The process was initiated using Fig. 2 by considering the lowest distance (dissimilarity) values among pairs of populations, supported by an image of the representative ear type of the original collected sample. After the first round of sampling, a new phenogram was computed to repeat the sampling process, and this was repeated until the final subset was defined. This subset was taken into consideration to retain the most diverse maize types to be represented in the subset. Thus, a final subset of 18 populations was defined, which represents a sample of the maize diversity in the region of study based on the quantitative ear and kernel traits. The populations assigned to the final subset were identified in Fig. 2, and the mean values of selected traits and kernel characteristics are presented in Table 3.
Means of selected traits and kernel characteristics of the final maize subset for the Southeast of the Coahuila state in Mexico

C, Celaya; CN, Conico Norteño; EC, Elotes Conicos; EO, Elotes Occidentales; O, Olotillo; R, Raton; T, Tuxpeño; TN, Tuxpeño Norteño.
The kernel types of the populations representing the subset are mostly the dent type, but the presence of floury-type kernels in the three populations from the races Elotes Conicos, Elotes Occidentales and Conico Norteño indicates that there is a variation of this trait in the region of study. Kernel colour is another characteristic that farmers often consider as a selection criterion, and it also determines the use and adaptation of the populations. Both traits were taken into consideration during the sampling process and were represented in the final subset (Table 3). The purpose of developing a subset with this approach was to represent most of the maize types in the region, and it was also sought to represent the different types within race complexes. Thirteen populations represent the most frequently observed races in the region, such as Conico Norteño, Raton and Tuxpeño Norteño, and five populations represented at least one population from the less frequent races (Table 1). As shown in Table 3, aside from kernel characteristics, variation among populations can be explored by examining the mean values of selected traits and the altitude, which refers to microenvironment adaptation. The final subset is represented by 18 out of the 77 maize populations (23.4%); it accounts for the variation between and within the different race complexes, and it also keeps at least one population from the less represented races in the region.
Discussion
The genetic diversity in a traditional agricultural system is determined by natural processes associated with crop evolution, natural and artificial selection, and adaptation to variation in climate, soil conditions and agricultural practices (Hernandez, Reference Hernandez1985; Eyzaguirre and Iwanaga, Reference Eyzaguirre, Iwanaga, Eyzaguirre and Iwanaga1996). Conceptually, two types of genetic materials are commonly developed, those obtained from preferences (colour, flavours, crop type, maturity, etc.) and those selected for adaptability to biotic or abiotic microenvironments.
Understanding the genetic diversity of crops and the relationships within the gene pool of a species has been a concern for several studies, who have sought to outline the genetic data and interpret it using morphological and molecular marker data (Mohammadi and Prasanna, Reference Mohammadi and Prasanna2003; Govindaraj et al., Reference Govindaraj, Vetriventhan and Srinivasan2015). In the case of molecular markers, the relationship between any pair of individuals in a population represents a genotypic relationship. Thus, it is a sample at the DNA sequence level, whereas morphological data, which have an association that is accounted for the genotype, the environment influence and, usually, any form of interaction. Several authors have indicated the likelihood of using molecular markers in genetic diversity studies in maize, and they have noted weak but significant relationships between the morphological and molecular similarity data (Beyene et al., Reference Beyene, Botha and Myburg2005; Babic et al., Reference Babic, Nikolic, Andjelkovic, Kovacevic, Filipovic, Vasic and Mladenovic-Drinic2016). However, Ristic et al. (Reference Ristic, Babic, Andelkovic, Vancetovic, Mladenovic and Ignjatovic2013) reported low and non-significant correlations between morphological traits, Random amplified polymorphic DNA (RAPD) and simple sequence repeats (SSR) dissimilarity matrices. Although different marker types produced adequate genotype arrangements, Babic et al. (Reference Babic, Nikolic, Andjelkovic, Kovacevic, Filipovic, Vasic and Mladenovic-Drinic2016) also found that there were many inconsistencies between the field data and laboratory results. Thus, besides the descriptors for phenotypic characterization, the use of acceptable statistical methods may increase the accuracy of germplasm characterization. In studying maize diversity, several authors have reported that morphological traits are useful to describe maize diversity and to define representative subsets (Ortiz et al., Reference Ortiz, Crossa, Franco, Sevilla and Burguenño2008; Pinheiro de Carvalho et al., Reference Pinheiro de Carvalho, Teixeira, Abreu, Sousa, Marques dos Santos, Clemente and Motto2008).
Maize diversity is usually described by the racial concept approach using morphological traits such as the characteristics of plants, tassel and ears (Wellhausen et al., Reference Wellhausen, Roberts, Hernández and Mangelsdorf1951). The relationships between populations within racial complexes are also considered, and a descriptor list of qualitative and quantitative characters are used (IBPGR, 1991). According to the descriptors for maize (IBPGR, 1991), the characterization consists of recording characters that are highly heritable, easy measurable and are expressed in all environments. The characters used for maize classification should be those that are less affected by the environment. Goodman and Paterniani (Reference Goodman and Paterniani1969) analysed 111 characters (vegetative traits, tassels, ears and kernel characters) from 55 races sown for several years, and concluded that those characters that were least affected by environmental influences and interactions were reproductive characters, particularly the ear and kernel characters.
In the region of study, 77 maize populations were collected over a wide range of altitudes (774–2557 masl). Passport data (FAO-Bioversity, 2012) recorded during the collecting process (site location, climate conditions, altitude, etc.) were used to describe the genetic material adaptiveness. Based on ear phenotypes (Wellhausen et al., Reference Wellhausen, Roberts, Hernández and Mangelsdorf1951), all populations were initially assigned to a race name classification, and they were grouped into eight racial complexes (Table 1).
The groups of population assigned based on altitude indicated a wide-ranging micro-ecological environment in the region. These groups are also associated with racial classification as a consequence of environmental adaptation. The races Conico Norteño and Elotes Conicos (ear conical type) are adapted to the ‘transition to highland’ areas, at altitudes above 1700 m. The Raton and Tuxpeño Norteño races are adapted to a large area: Raton (84–1300 m) and Tuxpeño Norteño (1400–1701) (Ruiz et al., Reference Ruiz, Durán, Sánchez, Ron, González, Holland and Medina2008).
Based on the primary race classification, the most abundant races are Conico Norteño, Raton and Tuxpeño Norteño, representing 44.2, 27.3 and 14.3%, respectively. These three racial complexes are the most important races for describing maize diversity in Coahuila State (Rincόn et al., Reference Rincón, Hernández, Zamora, Hernández, Rincón, Castillo and Ruiz2010b). The race combinations identified (Table 1) indicate that populations have inter-crossed, possibly due to seed exchange within and between different communities, which is a common practice among farmers in the region of study (Rincόn et al., Reference Rincón, Hernández, Zamora, Hernández, Rincón, Castillo and Ruiz2010b; Aguirre et al., Reference Aguirre, Rincón, Ramírez, Colón and Razo2011).
The analysis of genetic diversity involves using sampling strategies to outline representativeness. Accurate data recording and appropriate statistical methods are used to identify relationships between populations or individuals within populations (Mohammadi and Prasanna, Reference Mohammadi and Prasanna2003). In the area of study, maize diversity was first explored by principal component analysis to analyse the maize populations by their trait interactions (Yan and Tinker, Reference Yan and Tinker2006). This helped to understand the relationships between and within the eight racial complexes.
The distinction between the maize populations from high altitude (conical type), indicated by the dashed oval (Fig. 1), and intermediate altitude populations (cylindrical type) outside the oval, as well as the relationships between populations within these two main complex groups in the region of study, indicate the utility of the ear and kernel traits studied to describe the maize diversity, as noted by Goodman and Paterniani (Reference Goodman and Paterniani1969) and Sanchez et al. (Reference Sanchez, Goodman and Rawlings1993). By exploring the dispersion of populations by racial complexes in Fig. 1, it is possible to detect a continuous pattern among the races Raton and Tuxpeño Norteño. A similar genetic variation pattern was found among racial groups by analysing the land races in the state of Coahuila, which are associated with altitudinal and ecological regions (Rincόn et al., Reference Rincón, Castillo, Ruiz, Illescas, Ramón, Rincón, Castillo and Ruiz2010a). Even though most populations were placed within the two main groups (conical and cylindrical), few of them are located outside. This may be due to genetic combination (Table 1), which resulted from a high degree of interaction between the two main racial complexes and was partially caused by seed exchange among farmers within and between communities. Seed exchange also generates high variation, particularly in small regions such as the study region considered here.
Exploring and understanding maize genetic diversity in a region may help to guide further research for genetic conservation and to identify selection strategies to develop novel germplasm resources.
The interaction of the native maize populations with the quantitative ear traits studied (Fig. 1) describes the association between the racial complexes and the relationships between populations within the two main groups identified: the conical ear complex, associated with populations adapted to transition and highland altitudes, and the cylindrical ear complex, which includes populations adapted to lowland to intermediate altitudes. A comprehensive association between these two main groups and the relationships between the maize populations within each group are represented in a phenogram (Fig. 2), which was used to sample the maize variation with a modified version of the procedure used by Rincon et al. (Reference Rincon, Johnson, Crossa and Taba1996).
Based on a theoretical model, Yonezawa et al. (Reference Yonezawa, Nomura, Morishima, Hodgkin, Brown, VanHintum and Morales1995) analysed four stratified sampling strategies and one random strategy, and they concluded that a proportional strategy should be used in defining subsets, particularly if the genetic diversity within groups is unknown, as is the case for many germplasm collections. Using the phenogram (Fig. 2), a representative subset of populations was obtained after applying seven rounds of sampling within the subgroup relationships in the phenogram. The final subset considered the subgroups and the numbers of individuals within the groups, and at the decision point (low dissimilarity values), the ranges of diversity between pairs of populations were considered. This approach is different from the stratified random sampling used in previous studies, where the genotypic or phenotypic expression and race classification are unknown (Rincon et al., Reference Rincon, Johnson, Crossa and Taba1996; Franco et al., Reference Franco, Crossa, Warburton and Taba2006).
The concept behind the core subset is that it should be effective in retaining a good sample of the genetic diversity in the collection. It was first recommended to define a sample of 10.0%, up to approximately 3000 entries, to determine a representative subset (Brown, Reference Brown, Brown, Frankel, Marshall and Williams1989). However, sample size could vary according to the entries and the range of diversity in the collection. Rincon et al. (Reference Rincon, Johnson, Crossa and Taba1996) used a stratified sampling process to define a subset of 23% of the total number of accessions in the collection based on agronomic data. Using molecular data, Franco et al. (Reference Franco, Crossa, Warburton and Taba2006) compared 24 stratified sampling strategies applied to different data sets with an intensity of 20% of the collection for managing genetic resources. The subset defined in this study accounts for 18 of the 77 native maize populations (23.4%), and it was considered the variation between and within the two main groups (conical and cylindrical ear type). The sampling process allowed to represent the maize diversity using a phenogram, and it was able to keep at least one population from those races that were less represented in the area of study.
The subset of populations representing the genetic diversity can be used to establish strategies for conservation and use, such as a participatory conservation and management platform. The subset can also be used for breeding populations to develop improved land race populations. The results of this study indicate that morphological traits such as those of the ear and kernel are useful for assessing maize diversity. It was also found that phenotypic dissimilarities can be used for sampling maize variation to define a set of native maize populations that represent the racial groups and to keep all different maize types in the region of study.
Acknowledgements
Collecting maize populations was partially supported by the project ‘Conocimiento de la diversidad y distribución actual del maíz nativo y sus parientes silvestres en México’, coordinated by the Instituto Nacional de Investigaciones Forestales, Agrícolas y Pecuarias (INIFAP), Comisión Nacional para el Conocimiento y Uso de la biodiversidad (CONABIO) and the Universidad Autónoma Agraria Antonio Narro (UAAAN).