In 2008, Barack Obama did not obtain a landslide victory, despite numerous signs that he should have. At the time, the country faced political and economic difficulties without recent precedent. By various autumn preelection indicators, the expectation of an overwhelming Democratic win was not unreasonable; for example, the popularity of President Bush sank to 25% (Gallup), economic growth was actually negative, and job losses were approaching 1945 levels. (In particular, see Campbell's (Reference Campbell2008) discussion of this expectation.) Instead, President Obama won with only a 52.9 percentage point share of the total popular vote, thus registering opposition from nearly half the voters. Before the 2008 contest, we forecast that Obama would lose votes because of racial prejudice (Lewis-Beck and Tien Reference Lewis-Beck and Tien2008). We contended that he fell short of a landslide victory because of race intolerance (Lewis-Beck and Tien Reference Lewis-Beck and Tien2009). To demonstrate this contention, we analyzed individual-level 2008 presidential election survey data. In a highly controlled logistic regression equation, we showed that respondents who felt Obama “favored blacks” were less likely to declare a vote for him, even when facing severe economic decline. Overall, we calculated that this racially motivated group cost Obama about five percentage points of the total popular vote (Lewis-Beck, Tien, and Nadeau Reference Lewis-Beck, Tien and Nadeau2010).
Assume that the accuracy of that estimate accounts for why Obama did not achieve a 2008 landslide. Now the question arises, as we head into the 2012 contest, does a racial cost still exist? Perhaps it does not, with President Obama bringing postracial politics to the White House. Perhaps it does, but at a lower level as voters struggle to accept racial equality for the presidency. Perhaps it has increased, as racial resentment sometimes can. Fortunately, we can explore these possibilities with an election survey instrument almost identical to the one used in 2008. Using that survey, we estimate what the racial cost, if any, will be in 2012. First, we briefly review the 2008 evidence for racially intolerant voting. Then, we indicate how we carried out our estimation of 2008 racial cost. Next, we describe our 2012 survey. Lastly, we make a racial cost calculation for 2012. Our conclusions suggest that Obama again may have to pay a racial cost for his presidential candidacy.
RACIALLY INTOLERANT VOTING: THE 2008 EVIDENCE
The aggregate results from the 2008 contest are suggestive. The notion that Obama “should” have garnered a landslide, rather than a modest win, receives reinforcement when we consider the Democratic landslide that took place in the House. That is, a 257–178 Democratic seat majority, with the largest popular vote margin (national vote = 53.8%) since 1988.Footnote 1 Ceasar and DiSalvo (Reference Ceasar and DiSalvo2008, 1), comparing the presidential and congressional results back to 1896, also note these discrepancies and observe that the Obama win was “far from being massive, or even unusual” while the Democratic congressional triumph was in the “upper range of congressional victories in a presidential year.” One possible cause of these presidential-congressional differences is racial defection from the Democratic presidential candidate. To determine if there is a racial cost, we look at individual, rather than aggregate, data.
Public opinion surveys provide valuable, if sometimes confusing, information. Partly because of the social desirability problem, respondents can fail to give their “true” feelings about people of different races. To overcome this problem, some survey researchers have used the list experiment. For the 2008 election, however, the list experiment yielded contradictory results (Heerwig and McCabe Reference Heerwig and McCabe2007; Martinez Reference Martinez2009). Therefore, we turn to other public opinion results. In a post-2008 national election survey (Internet), Sniderman and Stiglitz (Reference Sniderman and Stiglitz2008) carefully examine racial prejudice and vote choice. They construct a Prejudice Index and an Esteem Index. Among Democrats, of those in the bottom third on the Prejudice Index, 95% voted for Obama, while for those in the top third only 62% voted for Obama. This difference is partly cancelled out by voters who hold blacks in “esteem.” For those in the bottom third on this Esteem Index, 77% voted for Obama, while for those in the top third it was 96%. [Craemer et al. (Reference Craemer, Shaw, Edwards and Jefferson2009), in a relevant study, finds white voters can have a psychological closeness to Obama that allows them to support him.] Because the “prejudice” cost appears greater than the “esteem” benefit, there is an implied net vote loss for Obama; however these scholars refrain from such a leap.
In a related investigation, Aistrup, Kisangani, and Piri (Reference Aistrup, Kisangani and Piri2009) make an inference in a preelection convention survey in the southern states. Using vote intention as their dependent variable (McCain or Obama), they find racial resentment has a strong effect even after imposing strong controls within the model. Persily, Ansolabehere, and Stewart (Reference Persily, Ansolabehere and Stewart2009) also studied southern states. Using exit pool data they show Obama did the same or worse, when compared to Kerry in 2004 among white voters in Alabama, Arizona, Arkansas, Georgia, Louisiana, Mississippi, Missouri, New Mexico, Tennessee, and West Virginia. In states with historical racial prejudice (states covered under Section 5 of the Voting Rights Act) Obama “appeared to make no gains among white respondents in the covered jurisdictions” (Persily, Ansolabehere, and Stewart Reference Persily, Ansolabehere and Stewart2009, 7). Unfortunately, neither of these studies, which emphasize conditions in the South, yields an overall estimate of a racial cost of the 2008 vote.
An exception here comes from Klarner (Reference Klarner2008). He finds “the influence of racial prejudice on voting patterns was evident and substantial in the election.” Theoretically, his work is motivated by the racial threat hypothesis (Key Reference Key1949). His dependent variable is the percentage of whites surveyed in the state who declared a vote for Obama. In a regression analysis, he concludes that the state's black population significantly depresses the Obama white vote, even after applying strong control variables. His regression coefficient provides an estimate of the votes Obama lost state-by-state due to race (Klarner Reference Klarner2008, table 1, model 4). This number varies widely by state, from virtually nothing in a state such as Vermont to five percentage points in a state such as Mississippi. These state-by-state results are weighted to provide a national level loss of 2.1% of the two-party vote. Although this is a useful effort, it rests on inferences at the aggregate level. To discover individual-level national effects, we must directly look at individuals in a 2008 national survey as we do next.
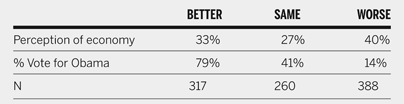
Economic Perceptions and Voting Intentions for Obama in 2012

Questions: Who would you vote for at the next presidential election? Would you say over the past year the nation's economy has gotten much better, gotten better, stayed about the same, gotten worse, or gotten much worse?
Source: YouGov Poll.
THE RACIAL COST IN THE 2008 VOTE: A SURVEY-BASED MODEL
In October 2008, we participated in the Cooperative Campaign Analysis Project (CCAP), gathering a national Internet survey. With these data, we first estimated a classic political behavior single-equation model, with presidential vote intention (V) a function of sociodemographics (S), party identification (P), ideology (I), and retrospective sociotropic economic evaluation (E) (Lewis-Beck et al. Reference Lewis-Beck, Jacoby, Norpoth and Weisberg2008). We were especially interested in how economic evaluations influenced choice.
 $$
V = S + P + I + E.
$$
These variables are measured in the usual way, as shown.
To this standard framework we added a racial intolerance variable (F), and the interaction term, (E × F). Because no “usual way” to measure racial intolerance exists, it is important to spell it out. Respondents were asked “which of the following groups in society do you think will be favored if Barack Obama is elected president?” Among all, 56% said “yes,” Obama would favor blacks; 46% said “no” he would not. (This variable appears to measure strongly racial prejudice in the vote: among the “yes” only 32% said they would support Obama, in contrast to 80% among the “no.” This “favor blacks” variable we label F.) Thus, the stylized model specification becomes as follows,
 $$
V = S + P + I + E + F + (E \times F).
$$
With the inclusion of these additive and nonadditive components of racial attitudes, we estimated racial costs in the voting in the context of the economic vote. In brief, the idea is to consider the extreme scenario where there is no racial intolerance (F = 0) versus the actual scenario, where racial intolerance is not zero (F > 0). To the extent racial intolerance exists, the expectation is it will blunt the impact of the poor economy on the Obama vote. The difference between the two scenarios, ceteris paribus, indicates the racial cost to the vote. The mechanics of this estimation procedure are explicated below, in the 2012 application. For the 2008 estimation, we estimated racial cost to Democratic candidate Obama was 5.04 percentage points of the total popular vote. Since our initial estimate, several other scholars have confirmed our finding of significant racial bias in the 2008 presidential vote (Block Reference Block2011; Donovan Reference Donovan2010; Highton Reference Highton2011; Knuckey Reference Knuckey2011; Piston Reference Piston2010).
THE 2012 PRESIDENTIAL VOTE SURVEY
Fortunately, we were able to use 2008 items in a 2012 national survey conducted in March by YouGov.Footnote 2 Of particular interest are the survey questions that measure, first, racial intolerance (F) and, second, sociotropic retrospective economic evaluation (E):
-
1. Which of the following groups in society have been favored during Barack Obama's time as president? men; women; blacks; the working class; the middle class; the rich; Muslims; immigrants; corporations and lobbyists.
-
2. Would you say that over the past year the nation's economy has … gotten much better, gotten better, stayed about the same, gotten worse, or gotten much worse.
For question 1, the percentages for the group “blacks” are very favored = 31%; somewhat favored = 26%; not favored = 25%; not sure = 17%). Thus, 57% of respondents believe that blacks were either very or somewhat favored by Obama during his first term. This is almost exactly the percent of respondents in 2008 who believed that blacks would be favored by an Obama administration (Lewis-Beck, Tien, and Nadeau Reference Lewis-Beck, Tien and Nadeau2010).
Our theoretical analysis is framed by sociotropic retrospective economic voting, in which voters typically punish incumbents for bad economic conditions and reward them for good economic conditions (Lewis-Beck and Stegmaier Reference Lewis-Beck, Stegmaier, Dalton and Klingemann2007). Current perceptions of the economic situation are not very good, according to these data. Only 33% of respondents believe the economy is “much better” or “better” than one year ago, 27% believe it is “about the same,” and 40% answered “worse” (see table 1, row 1). We continue to see evidence of economic voting for the 2012 election. As perceptions of the economy worsen, vote intention for Obama drops off dramatically (see table 1, row 2). Among those who believe that the economy is better, 79% plan on voting for Obama. Among those who perceive the economy as worse, however, only 14% plan on voting for Obama.
We found that in the 2008 election, racial voting prevented Obama from winning in a landslide by muting economic voting. Here, we show that racial intolerance will continue to affect economic voting for Obama in 2012. Prima facie evidence suggests that it is still the case. Those who believe that blacks are “very favored” by Obama, for instance, would punish him severely for bad economic conditions (his level of support in this group falls to 4%) and hardly reward him for positive economic outlooks (level of support of 58%; the same figures for those who think that the incumbent president has “not favored” blacks are 22% and 88%, respectively; see Tien, Nadeau, and Lewis-Beck Reference Tien, Nadeau and Lewis-Beck2012 for detailed results).
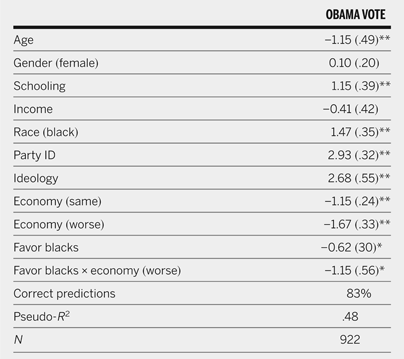
A satisfying test for the presence of a racial cost needs to be performed with the appropriate controls. Observe the multivariate logistic regression in table 2. The dependent variable is vote intention for Obama, the key independent variables are favor blacks (1 = very favored, 0.5 = somewhat favored, 0 = not sure, not favored), and an interaction variable between favor blacks and economy worse (1 = worse, 0 = otherwise). Measures on the control variables are described at the bottom of table 2. The results show that those who believed Obama favored blacks are less likely to vote for him (negative coefficient on favor blacks) and that perceptions of a bad economy make it even less likely among racially prejudiced voters that they will vote for Obama (negative coefficient on the interaction term, favor blacks × economy worse).
Multivariate Logistic Regression Model of the Obama Vote

** p < .01;
* p < .05 (one-tailed tests).
Dependent variable equals 1 if voting intention for Obama, 0 otherwise. Party ID equals 0 for Republicans, .5 for Independents, and 0 for Democrats. Economy (same) equals 1 for about the same, 0 otherwise. Economy (worse) equals 1 for worse and much worse, 0 otherwise. Favor blacks equals 0 if respondents think Obama has not favored blacks or are not sure, .5 if they think he has somewhat favored blacks and 1 if they think that he has very favored blacks. Control variables are rescaled from 0 to 1: Age (in year), Gender (female), Education (six categories), Income (in dollars; imputed values for missing cases were calculated from a model including age, age squared, gender (female), schooling and race (blacks)), Race (black), Ideology (scale ranging from 0 [very conservative] to 1 [very liberal]; not sure = .5). The Pseudo R2 is McFadden.
In 2008, racial prejudices served as a protective shield for the incumbent Republican party, preserving them from an electoral disaster and denying the Democratic challenger, Obama, the landslide he could have expected given the prevailing circumstances. The same type of racial cost will be at play in 2012. Contrary to what happened four years ago, however, racial prejudices will not dampen, but rather exacerbate, the impact of negative economic perceptions, which makes Obama's reelection more problematic: the negative impact of bad economic perceptions is still more pronounced among those who are racially prejudiced.
ESTIMATION OF THE RACIAL COST IN THE 2012 PRESIDENTIAL VOTE
As a starting point, a voter has a 50% probability of supporting Obama. If this voter acquires a negative perception of the economy (ECN: worse), then from this logistic calculation that vote probability drops to 19%, for a 31 percentage point decrease. This case corresponds to voters who do not believe (or are not sure) that Obama favors blacks (main effect = −1.67 + 0 (−1.15) = −1.67), yielding the 31 percentage point decrease in the probability of supporting Obama. Among those who hold negative views of the economy and believe that Obama somewhat favors blacks, we get (main effect + interactive effect = −1.67 + (.5) (−1.15) = −2.25), yielding a 40 percentage point decrease in the probability of supporting Obama. Finally, among those who have both negative economic perceptions and believe that Obama very much favors blacks, we get (total effect = −1.67 + (1) −1.15 = −2.82), yielding a 44 percentage point drop in the probability of supporting Obama.
Using the steps taken in our earlier work (Lewis-Beck, Tien, Nadeau Reference Lewis-Beck, Tien and Nadeau2010), we estimate the 2012 racial cost. The component aggregate impact depends on the size of the racially less-tolerant group, times its effect, as follows: group size × differences in the impact of negative perception = component aggregate impact.
The size of the first group “Obama somewhat favors blacks and economy has gotten worse” is a .09 proportion of the sample. Its difference in impact (from the baseline “Obama does not favor blacks and the economy has gotten worse”) is 40 − 31 = 9 points. Therefore, its component aggregate impact = (.09 × 9) = .81. The size of the second group “Obama favors blacks and the economy has gotten worse” is a .19 proportion of the sample. Its difference in impact (from the baseline “Obama does not favor blacks”) is 44 − 31 = 13 points. Therefore, its component aggregate impact = (.19 × 13) = 2.47. Adding together the two aggregate components (.81 + 2.47) amounts to 3.28 percentage points of the vote that Obama can expect to lose from these racially intolerant views. In other words, if Obama's race were not a factor, these racially sensitive voters would be expected to vote for him on economic grounds. Thus, we see that in 2012, a racial cost still appears in the presidential vote, although it has been reduced by about one-third (3.3/5.0 = 66%).
CONCLUSION
In 2008 we forecast that presidential candidate Barack Obama would be penalized for his nonwhite race. Carrying out calculations from a carefully specified logistic regression model, estimated on an individual-level national preelection survey (October 2008), we concluded that racial intolerance on the part of a subset of American voters cost him about 5 percentage points of the popular vote. Now, we raise the question whether this racial cost will be paid again in 2012. Carrying out a similar calculation, on an individual-level national preelection survey (March 2012), we conclude that racial tolerance will cost Obama a little more than 3 percentage points in 2012. In fact, the difference between the two estimates, of less than two points, would probably fail to register statistical significance. Further, we might reasonably suppose that racial attitudes would take a bigger bite from the vote measured closer to the election itself, instead of seven months away, as is our survey. But that is speculation. With respect to the motivating questions posed at the beginning of our article, we now have some answers. On one hand, the Obama presidency has not ushered in the postracial White House. On the other hand, racially motivated voting is certainly no worse after 2008. Indeed, there is a hint that racially intolerant voting in presidential elections is on the decline. In 2008, this racial cost denied Obama a landslide victory. In the context of a closer election in 2012, this persistent racial cost, even smaller in size, could perhaps cost him his reelection.