Implications
Grazing livestock has an important economic significance for rural development in many marginal and less-favoured areas. Knowledge of the impact of livestock on different plant communities requires understanding diet selection of herbivore species for the development of sustainable animal production systems for each specific situation. This research represents the first study of the potential of long-chain alcohols as faecal markers for large herbivore species grazing heathland areas and indicates their usefulness for studying diet selection of horses and cattle on these vegetation communities.
Introduction
Large areas of the Atlantic mountains are occupied by nutritionally poor heathland communities, widespread, in many cases, as a consequence of rural exodus and abandonment of livestock managements and agricultural practices, and by frequent forest fires (Rosa-García et al., Reference Rosa-García, Fraser, Celaya, Ferreira, García and Osoro2013). Different animal species exploit these areas and are viewed as vegetation management tools for landscape conservation and biodiversity benefits, besides having an important economic significance for rural development (Rook et al., Reference Rook, Dumont, Isselstein, Osoro, Wallis de Vries, Parente and Mills2004). In these areas, cattle and horses are currently increasing in number and taking the place of small ruminants, generally reared in completely wild conditions with minimal management. In general, there is a lack of technical and scientific knowledge on how these herds behave (i.e. grazing paths, foraging behaviour, etc.) and their influence on the dynamics of the vegetation community. Thus, knowledge on the grazing behaviour of these animal species in these marginal areas, especially diet selection, is required to develop appropriate grazing systems.
In recent studies, grazing behaviour (diet selectivity and feed intake) of cattle and horses has been assessed by the use of long-chain saturated hydrocarbons (n-alkanes) as faecal markers (Ferreira et al., Reference Ferreira, García, Rodrigues, Celaya, Dias-da-SIlva and Osoro2007 and Reference Ferreira, García, Celaya, Rodrigues and Osoro2009a; Oliván et al., Reference Oliván, Ferreira, Celaya and Osoro2007a). As reviewed by Dove and Mayes (Reference Dove and Mayes2006), this is a non-invasive approach offering several potential advantages over traditional methods. Nevertheless, the limited number of plant species that can be discriminated and the low alkane concentrations in some plant species have been pointed out as the main limitations for application of these markers. In fact, some plant species that can be found on heathland vegetation communities with associated improved pastures (Lolium perenne, Trifolium repens, Pseudarrhenatherum longifolium, Agrostis capillaris and Ulex gallii) present very low alkane concentrations (Ferreira et al., Reference Ferreira, García, Celaya, Rodrigues and Osoro2009a and Reference Ferreira, Celaya, Santos, Falco, Guedes, Rodrigues and Osoro2011), making them more prone to measurement errors (Dove and Mayes, Reference Dove and Mayes2006). Thus, their application may result in less accurate estimations of both diet selection and feed intake (Ferreira et al., Reference Ferreira, García, Rodrigues, Celaya, Dias-da-SIlva and Osoro2007). To overcome these limitations, other epicuticular wax components such as long-chain fatty acids (LCFA) (Ali et al., Reference Ali, Mayes, Hector, Verma and Ørskov2005; Ferreira et al., Reference Ferreira, Carvalho, Falco, Celaya, García, Santos, Rodrigues and Osoro2009b; Lin et al., Reference Lin, Luo, Zhang, Wang, Shu and Hong2009), and long-chain fatty alcohols (LCOH) (Ali et al., Reference Ali, Mayes, Lamb, Hector, Verma and Ørskov2004; Ferreira et al., Reference Ferreira, Celaya, Santos, Guedes, Rodrigues, Mayes and Osoro2012 and Reference Ferreira, Celaya, Santos, Mayes, Rodrigues and Osoro2015) have been suggested as additional markers to estimate diet composition of small ruminants. In fact, their utilization may increase the accuracy of estimates by providing additional discriminatory information to that supplied by alkanes. However, there is no information about the application of LCOH markers to estimate diet selection of large herbivores.
The objective of the present work was to assess the utilization of LCOH alone or in combination with other markers (i.e. alkanes, LCFA and LCFA+alkanes) to estimate diet composition of horses and cattle fed on browse and herbaceous feeds at the end of the grazing season.
Material and methods
Experimental site and design
All procedures used in this experiment were described in detail in previous publications (Ferreira et al., Reference Ferreira, García, Rodrigues, Celaya, Dias-da-SIlva and Osoro2007 and Reference Ferreira, Celaya, Santos, Falco, Guedes, Rodrigues and Osoro2010) but for the sake of clarity are also summarized here. The experiment was conducted at the end (November and December) of the grazing and vegetation growth season at the Carbayal Research Station, situated at 900 to 1000 m above sea level, at San Isidro's Mountain, Asturias, Spain (longitude –6°53′, latitude 43°20′). The vegetation was dominated by a mosaic of short heaths (Erica umbellata, Erica cinerea and Calluna vulgaris), sparse tall heathlands (Erica australis and Erica arborea) and gorse (U. gallii). Natural vegetation can appear interspersed with areas of improved pasture, usually sown with perennial ryegrass (L. perenne) and white clover (T. repens), to try to achieve the sustainability of the systems (Osoro et al., Reference Osoro, Ferreira, García and Celaya2011).
The experiment lasted for 11 days and included a 7-day period for adaptation of animals to the diets and experimental conditions, followed by 4 days of collection of representative samples of each diet component and animal faeces. Animals were housed indoors in individual metabolic crates to allow total faecal collection that was recorded individually. Daily representative samples of each diet component were collected before the morning meal. A sample of total faeces and diet components were collected from each animal every day before the morning meal for dry matter (DM) determination using a forced-air oven (Venticell, Munchen, Germany) at 60°C for 72 h. Another sample was immediately frozen at –20°C and then freeze-dried.
Animals and diets
Twelve mature crossbreed mares (385±47 kg BW) and six adult non-lactating cows (499±36 kg BW) of Asturiana de los Valles breed were used. Groups of three animals were assigned at random to one of four (H1, H2, H3 and H4 for horses) or two (C1 and C2 for cattle) diets. Diets H1 and C1 were constituted only by ryegrass, H2 and C2 included ryegrass (0.70) and heather (0.30), H3 consisted of ryegrass (0.70) and gorse (0.30), and H4 was composed of ryegrass (0.40), gorse (0.30) and heather (0.30). The composition of the diets aimed to reflect the selection of these animal species on these vegetation communities at the end of the grazing season (Ferreira et al., Reference Ferreira, Celaya, Benavides, Jáuregui, García, Santos, Rosa-García, Rodrigues and Osoro2013). The diet component called heather represented the proportions of E. umbellata, E. cinerea and C. vulgaris found in these vegetation communities at that time. Freshly cut vegetation (ryegrass foliage and green shoots of the woody species) was harvested daily from random sites within the experimental field and were offered twice daily in individual mangers a total daily amount of 1.0 kg DM/100 kg BW. A low feeding level was used to prevent the existence of refusals as the botanical separation of the diet components in the refusals would be difficult to accomplish.
Chemical analysis
After freeze-drying, all samples of each diet component and of faeces were milled through a 1-mm screen and their alkane content was determined according to the methods previously described by Ferreira et al. (Reference Ferreira, García, Rodrigues, Celaya, Dias-da-SIlva and Osoro2007). After the alkane analysis, all samples were stored in plastic containers under vacuum. The LCFA and LCOH contents of faeces and dietary plant species were analysed in duplicate according to the methods of Dove and Mayes (Reference Dove and Mayes2006). Analysis of LCOH (C20-C30) was carried out by gas chromatography, using a Carlo Erba Mega Series 5160 (Carlo-Erba, Milan, Italy) fitted with flame ionization detector. The target analytes were separated using a SGE Solgel 1 column (SGE Analytical Science, Victoria, Australia), 30 m×0.25 mm with 0.25 μm film thickness. Injection volume was 1 µl (splitless mode) and the injector temperature was 300°C. The column was maintained at 180°C for 3 min, ramped at 30°C/min up to 220°C, ramped at 5°C/min to 325°C and it was held at 325°C for 8 min. Helium was used as the carrier gas (inlet pressure 105 kPa). All chromatographic analyses were carried out in duplicate for each extract, and a mixed standard was run regularly to enable corrections for variation in detector response. Long-chain alcohol (LCOH) concentrations were quantified relative to known amounts of the internal standard C27, added at the beginning of the extraction procedure.
Calculations
The LCOH faecal recoveries (FR) were calculated for each animal as the proportion of marker consumed in the diet that was recovered in the faeces. Estimates of diet composition were obtained for each animal using an optimization procedure that minimizes the sum of squared discrepancies between the actual LCOH proportions in faeces and the estimated proportions, according to Salt et al. (Reference Salt, Mayes, Colgrove and Lamb1994), using the Solver routine in Microsoft Excel. Additionally, LCOH (C20-OH to C30-OH) data were combined with alkanes (C25-C31 and C33, Ferreira et al., Reference Ferreira, García, Rodrigues, Celaya, Dias-da-SIlva and Osoro2007) and LCFA (C22-FA to C28-FA, C30-FA, C32-FA and C34-FA, Ferreira et al., Reference Ferreira, Celaya, Santos, Falco, Guedes, Rodrigues and Osoro2010) data to assess if their combination resulted in an improvement of the accuracy of diet composition estimates. For calculations, different FR corrections were applied to the marker faecal concentrations, being: (1) without any correction for incomplete faecal recovery (FR0); and (2) using mean recovery rate across all experimental diets within species (FR1).
Statistical analysis
Statistical analyses were performed using GenStat (2015). Differences between plant species in marker profiles were explored using principal components analysis (PCA). To assess if the discriminatory information provided by the LCOH markers was additional to that provided by alkanes and LCFA, PC scores obtained with the three different classes of marker were compared by orthogonal Procrustes rotation (OPR) as suggested by Dove and Charmley (Reference Dove and Charmley2008).
Effects of animal species, diet composition and carbon-chain length (CCL) and their interactions on FR of each LCOH were examined by ANOVA. Orthogonal contrasts were applied to determine linear and quadratic effects of CCL and its interaction with diet composition effect.
Accuracy of diet composition estimates as a whole was assessed by the Kulczynski similarity index (KSI; Krebs, Reference Krebs1989), that is, overlap in diet composition between known values and those estimated using different sets of FR correction, as
 $${\rm KSI}={{\mathop{\sum}{2c_{i} } } \over {\mathop{\sum}{(a_{i} {\plus}b_{i} )} }}$$
where c i is the lesser proportion of i component in the two diets (known v. estimated) and (a i +b i ) the sum of proportions of each plant component in both diets (known and estimated). Effects of animal species, diet composition, FR correction, marker and their interactions on the KSI values were examined by ANOVA. For multiple comparisons among means Tukey’s test was used and differences with a P-value of <0.05 were considered significant.
Results
LCOH profiles of diet components
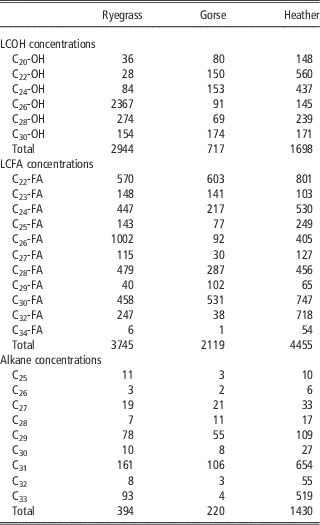
The LCOH, LCFA and alkane content of dietary plant species offered to the animals in the experimental period are presented in Table 1. For all diet components, total LCOH concentrations were higher than the alkanes, but lower than LCFA. Total LCOH concentrations were between 1.2 (heather) and 7.5 (ryegrass) times greater than alkane concentrations. Ryegrass showed the highest total LCOH concentration (2944 mg/kg DM) and gorse the lowest one (717 mg/kg DM). Mean LCOH concentrations varied from a minimum of 28 mg/kg DM (ryegrass, C22-OH) to a maximum of 2367 mg/kg DM (ryegrass, C26-OH). Heather also showed mean individual concentrations above 140 mg/kg DM for all the LCOH markers. For heather and gorse, shorter LCOH (C20-OH to C24-OH) predominated over the longer ones, accounting for 0.67 and 0.53 of total LCOH concentrations, respectively, while for ryegrass longer LCOH clearly predominated (0.95) over the shorter ones, due to its high concentration on C26-OH, representing 0.8 of the total LCOH concentrations.
Mean (±standard deviation) of chemical composition (g/kg DM), long-chain alcohols (LCOH), long-chain fatty acids (LCFA) and alkane content (mg/kg DM) of the plant species used in the diets of horses and cattle

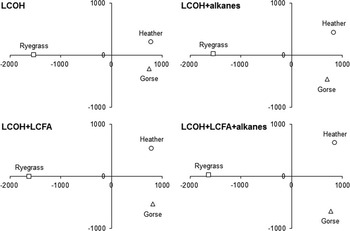
The PCA results (Figure 1) showed that the first two principal components explained 0.9 of the variance among plant species when using LCOH data, and 1.0 when using either LCOH data combined with alkanes or LCFA, or when marker classes were pooled. All plant species were clearly discriminated when using LCOH individually or combined with the other marker classes.
Two-dimensional plots from principal component scores based on long-chain alcohol (LCOH), LCOH+alkanes, LCOH+long-chain fatty acid (LCFA), and LCOH+LCFA+alkanes concentrations of plant species offered to the experimental groups of horses and cattle.

The OPR results indicated that LCOH offered additional discriminatory information to that provided by alkanes, LCFA and LCFA+alkanes. In fact, when their PCA scores were compared, the residual variance that remained after rotation was 0.320, 0.408 and 0.799 for LCOH+LCFA, LCOH+LCFA+alkanes and LCOH+alkanes, respectively.
LCOH FR
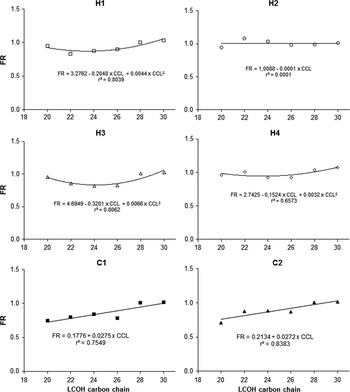
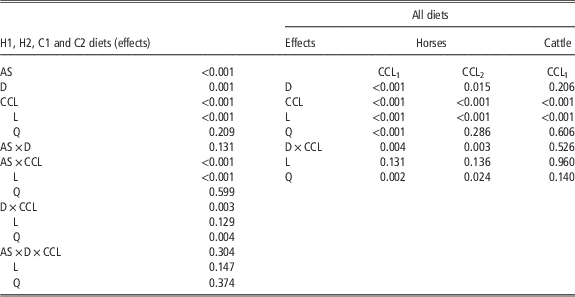
In general, LCOH markers were incompletely recovered in the faeces of both animal species, although in some particular LCOH, a FR higher than 1.0 was observed (Figure 2). Diet composition influenced (P=0.001) the FR of LCOH markers (Table 2). Animals fed with diets partially composed by woody species tended to present higher LCOH FR values. The FR variability within diets was quite low, with a mean coefficient of variation (CV) of 5.7% for horses and 6.4% for cattle, whereas the variability of FR between diets was similar for horses (5.9%) and lower for cattle (3.4%) and varied with CCL. Variability ranged from a minimum of 0.8% (C20-OH) for horses and 0.1% (C30-OH) for cattle to a maximum of 12.9% (C22-OH) for horses and 7.8% (C26-OH) for cattle.
Relationship between carbon-chain length (CCL) and the faecal recovery (FR) of long-chain alcohol (LCOH) in horses (H) and cattle (C) fed with H1 (Lolium perenne), H2 (0.70 L. perenne and 0.30 heather), H3 (0.70 L. perenne and 0.30 Ulex gallii), H4 (0.40 L. perenne, 0.30 U. gallii and 0.30 heather), C1 (L. perenne) and C2 (0.70 L. perenne and 0.30 heather).

Effect of animal species, diet composition, LCOH carbon-chain length and their interaction on LCOH faecal recovery

LCOH=long-chain alcohols; AS=animal species; D=diet; CCL=carbon-chain length (CCL1: C20-C22-C24-C26-C28-C30; CCL2: C20-C22-C28-C30); L=linear; Q=quadratic.
The results indicated that LCOH FR differed (P<0.001) between animal species, although this effect depended on CCL. In fact, differences between animal species were mainly on the shorter LCOH (C20- to C26-OH), whereas the longer LCOH (C28- and C30-OH) had similar FR in both horses and cattle. Data indicated that the effect of CCL on FR differed between animal species. In cattle, the FR of these markers tended to increase with CCL in a linear manner in both diets (P<0.001, FR=0.195+0.027×CCL, r 2=0.831), varying between a minimum of 0.70 (C20-OH) and a maximum of 1.00 (C30-OH). By contrast, in horses overall data showed a curvilinear relationship between CCL and FR, with a significant quadratic term (P<0.001). Nevertheless, this association was not consistent across diets. In fact, for H2 diet no association (P=0.978) between CCL and FR was observed, with mean FR values of ∼1.0 throughout all the CCL. For the remaining diets (H1, H3 and H4), the association between CCL and FR was better described by a quadratic function (P=0.030, P=0.001 and P=0.019 for H1, H3 and H4, respectively). As a result, an interaction between CCL and diet composition was observed in the FR of LCOH (P=0.004). It should be pointed out, that this curvilinear association between FR and CCL in horse diets could be explained by the unexpectedly lower FR of C24- (0.87) and C26-OH (0.88) when compared with the rest of LCOH markers (mean of 0.98). In fact, if C24- and C26-OH data are not considered, a linear association between FR and CCL was observed (P<0.001, FR=0.766+0.009×CCL, r 2=0.929).
Diet composition estimates
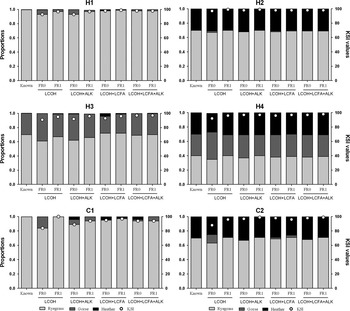
The comparison of known diet composition data with those estimated using different marker types (LCOH, LCFA and alkanes) and their combinations, and their respective KSI values are illustrated in Figure 3. Overall, accuracy of diet composition estimates was higher (P=0.033) in horses (96.5%) than in cattle (95.0%), and tended to be higher (P<0.05) in the diets with more composition complexity in both animal species. Consequently, diet composition influenced (P<0.01) the accuracy of the estimates. In horses, mean KSI values ranged from a minimum of 94.7% (H2) to a maximum of 98.0% (H4), whereas in cattle, the highest KSI value was observed in C2 diet (96.6%). In both animal species, accuracy of diet composition estimates was also influenced by markers (P<0.05) and FR corrections (P<0.05) used in the calculations.
Comparisons of known and estimated proportions of dietary components for horses (H1, H2, H3 and H4) and cattle (C1 and C2) obtained using different marker data (LCOH, LCOH+alkanes, LCOH+LCFA, LCOH+LCFA+alkanes) and faecal recovery corrections (FR0, FR1). LCOH=long-chain alcohol; LCFA=long-chain fatty acid.

The combination of all markers (LCOH+LCFA+alkanes) resulted in the most accurate estimates of diet composition for diets H2 (KSI of 97.2%), H3 (KSI of 97.8%), H4 (KSI of 98.2%) and C2 (KSI of 98.4%), while the combination of LCOH+LCFA was more precise for the animal groups fed only with ryegrass (H1 and C1 with mean KSI values of 98.6% and 95.9%, respectively). The best estimates of diet composition were obtained in cattle fed C2 when using the combination LCOH+LCFA+alkanes (KSI of 98.4%), while the worst estimates were observed in cattle fed C1 when using the LCOH+alkanes (KSI of 91.5%). Thus, the accuracy of estimates obtained for each marker type or combination depended on the diets and, as a consequence, an interaction between these two factors was found for cattle (P=0.023), although for horses there was not interaction (P=0.621).
As expected, the accuracy of diet composition estimates was affected (P=0.05 for horses and P<0.001 for cattle) by the recovery corrections used in the calculations. For both animal species, the use of uncorrected marker faecal concentrations (FR0) led to poorer estimates than those obtained using faecal concentrations corrected with mean recovery rate across all experimental diets (FR1), with minimum mean KSI values of 96.6% for horses and 92.8% for cattle, and maximum mean KSI values of 97.4% for horses and 97.2% for cattle.
Discussion
Marker profiles of the plant species
Results on LCOH profiles of the plant species used in this study are consistent with results of previous reports (Dove and Charmley, Reference Dove and Charmley2008; Lin et al., Reference Lin, Luo, Zhang, Wang, Shu and Hong2009; Ferreira et al., Reference Ferreira, Celaya, Santos, Mayes, Rodrigues and Osoro2015) that reported a trend for higher total LCOH concentrations than those of alkanes for the majority of plant species, especially in herbaceous species. In general, herbaceous species are known to possess very low total alkane concentrations (Dove and Mayes, Reference Dove and Mayes2006; Oliván et al., Reference Oliván, Ferreira, García, Celaya and Osoro2007b). In comparison with LCFA, LCOH showed lower total concentrations as observed by Ferreira et al. (Reference Ferreira, Celaya, Santos, Mayes, Rodrigues and Osoro2015) with similar plant species. A similar trend was observed by Ali et al. (Reference Ali, Mayes, Hector, Verma and Ørskov2005) when comparing the concentration of these epicuticular wax compounds on 25 rangeland species of Sudan. By contrast, Lin et al. (Reference Lin, Luo, Zhang, Wang, Shu and Hong2009 and 2012) found a predominance of LCOH over LCFA in several Chinese grass species and other forages such as Chenopodium album, Medicago sativa and Bromus inermis.
The data showed large differences between plant species in their LCOH profile, indicating the usefulness of these compounds for diet composition estimation. Ryegrass presented a predominance of longer LCOH carbon-chain (C26-OH, C28-OH and C30-OH), confirming earlier reports (Dove and Charmley, Reference Dove and Charmley2008; Lin et al., Reference Lin, Zhu, Jiang, Luo, Wang, Zhang and Hong2012; Ferreira et al., Reference Ferreira, Celaya, Santos, Mayes, Rodrigues and Osoro2015) for various grass species. Within heather species, C22-OH was the individual LCOH with the highest concentration, as also observed by Ferreira et al. (Reference Ferreira, Celaya, Santos, Guedes, Rodrigues, Mayes and Osoro2012), whereas for gorse, no LCOH stood out as the predominant one, as observed by Ferreira et al. (Reference Ferreira, Celaya, Santos, Guedes, Rodrigues, Mayes and Osoro2012 and 2015).
In general, PCA results showed that all plant species were clearly discriminated when using LCOH data alone or combined with other markers, as also observed by Ferreira et al. (Reference Ferreira, Celaya, Santos, Guedes, Rodrigues, Mayes and Osoro2012 and 2015). The OPR results indicated that LCOH offered an additional discriminatory information to that provided by the other markers, as observed in previous studies (Dove and Charmley, Reference Dove and Charmley2008; Ferreira et al., Reference Ferreira, Celaya, Santos, Guedes, Rodrigues, Mayes and Osoro2012 and 2015), showing that in situations where these plant species are selected together by grazing animals, a better discrimination could be achieved using LCOH combined with LCFA and/or alkanes. By contrast, Vargas-Jurado et al. (Reference Vargas-Jurado, Tanner, Blevins, McNair, Mayes and Lewisin press), concluded that the combination LCOH+alkanes did not improve the reliability of the predictions obtained with alkanes alone, of forage mixtures composed of tall fescue (Festuca arundinacea) and red clover (Trifolium pratense).
Markers’ FR
Although some LCOH markers had a FR of 1.0, the results obtained in this study showed a general incomplete recovery of LCOH in horses and cattle faeces. Similar results were also observed in previous studies performed with sheep for the same markers (Dove and Charmley, Reference Dove and Charmley2008; Lin et al., Reference Lin, Luo, Zhang, Wang, Shu and Hong2009; Ferreira et al., Reference Ferreira, Celaya, Santos, Mayes, Rodrigues and Osoro2015), and goats (Ferreira et al., Reference Ferreira, Celaya, Santos, Guedes, Rodrigues, Mayes and Osoro2012). In previous studies conducted with horses and cattle, an incomplete FR of alkanes (Ferreira et al., Reference Ferreira, García, Rodrigues, Celaya, Dias-da-SIlva and Osoro2007) and LCFA (Ferreira et al., Reference Ferreira, Celaya, Santos, Falco, Guedes, Rodrigues and Osoro2010) was observed.
The comparison of LCOH FR between animal species indicated that, in general, it was higher for horses, and seemed to have a linear relationship with CCL. An opposite trend was previously observed in this animal species in shorter LCFA and alkane carbon-chain (C22-C30) markers (Ferreira et al., Reference Ferreira, Celaya, Santos, Falco, Guedes, Rodrigues and Osoro2010). For cattle, a positive association between CCL and LCOH FR was found. A similar trend was observed for horses and cattle when using LCFA (Ferreira et al., Reference Ferreira, Celaya, Santos, Falco, Guedes, Rodrigues and Osoro2010) and alkanes (Ferreira et al., Reference Ferreira, García, Rodrigues, Celaya, Dias-da-SIlva and Osoro2007 and Reference Ferreira, García, Celaya, Rodrigues and Osoro2009a), and also in other ruminant species when studying LCOH (Ali et al., Reference Ali, Mayes, Lamb, Hector, Verma and Ørskov2004; Dove and Charmley, Reference Dove and Charmley2008), LCFA (Ali et al., Reference Ali, Mayes, Lamb, Hector, Verma and Ørskov2004; Ferreira et al., Reference Ferreira, Carvalho, Falco, Celaya, García, Santos, Rodrigues and Osoro2009b and Reference Ferreira, Celaya, Santos, Falco, Guedes, Rodrigues and Osoro2011) and alkanes (Dove and Mayes, Reference Dove and Mayes2005; Ferreira et al., Reference Ferreira, Oliván, García, Rodrigues and Osoro2005 and Reference Ferreira, García, Celaya, Rodrigues and Osoro2009a; Charmley and Dove, Reference Charmley and Dove2007). These data indicated that markers behave differently in the gastro-intestinal tract of ruminant and non-ruminant species, and suggest that the disappearance of those with the shorter carbon-chain in the gut of ruminants occurs to a greater extent than in non-ruminants.
Results also showed an effect of diet composition on the FR of LCOH in horses. These results are consistent with those obtained for these same markers in goats (Ferreira et al., Reference Ferreira, Celaya, Santos, Guedes, Rodrigues, Mayes and Osoro2012) and sheep (Ferreira et al., Reference Ferreira, Celaya, Santos, Mayes, Rodrigues and Osoro2015) fed on the same dietary components used in this trial. According to Ferreira et al. (Reference Ferreira, Celaya, Santos, Guedes, Rodrigues, Mayes and Osoro2012), this diet composition effect may be related with its digestibility, that is, higher marker FR are expected in diets with lower digestibility (H2, H4 and C2). In the present study, this association between digestibility and LCOH FR was only observed for C22- and C26-OH in horses and cattle, respectively. Also Dove and Charmley (Reference Dove and Charmley2008) and Lin et al. (Reference Lin, Luo, Zhang, Wang, Shu and Hong2009) did not observe any clear association between LCOH FR and digestibility.
Comparison of LCOH FR data with that obtained for alkanes (Ferreira et al., Reference Ferreira, García, Rodrigues, Celaya, Dias-da-SIlva and Osoro2007) and LCFA (Ferreira et al., Reference Ferreira, Celaya, Santos, Falco, Guedes, Rodrigues and Osoro2010) also indicates that variability between diets, expressed as CV, was lower for LCOH (5.9% for horses and 3.4% for cattle) than for other markers (6.4% and 13.9% for horses; 5.9% and 13.5% for cattle, respectively). This lower between-diet variation of LCOH FR could suggest that differences in the accuracy of diet composition estimates obtained applying mean recovery rate across all experimental diets within species (FR1) will be lower when using LCOH compared with the other markers.
Diet composition estimates
The results indicated that LCOH markers are undoubtedly able for distinguishing the plant species used in the present trial. Estimates based on LCOH combined with LCFA+alkanes were more accurate for horses and cattle than those obtained with the other markers, regardless of the FR correction used in the calculations. The combination of markers is usually suggested when difficulties in distinguishing plant species occur due to similar marker profiles (Ferreira et al., Reference Ferreira, Celaya, Santos, Falco, Guedes, Rodrigues and Osoro2010). Oliván et al. (Reference Oliván, Ferreira, García, Celaya and Osoro2007b) found difficulties in differentiating grass species (L. perenne, P. longifolium and A. capillaris) and gorse when alkane markers were used. In these situations, Ferreira et al. (Reference Ferreira, García, Celaya, Rodrigues and Osoro2009a) suggested that the combination of several faecal markers (alkanes, LCFA and LCOH) can provide a more specific fingerprint to each plant species, increasing the discriminatory power between them. To the authors’ knowledge, there are no published studies using LCOH as markers for horses, previous studies with small ruminants (Ali et al., Reference Ali, Mayes, Hector, Verma and Ørskov2005; Lin et al., Reference Lin, Luo, Zhang, Wang, Shu and Hong2009 and 2012; Ferreira et al., Reference Ferreira, Celaya, Santos, Guedes, Rodrigues, Mayes and Osoro2012 and Reference Ferreira, Celaya, Santos, Mayes, Rodrigues and Osoro2015) also observed greater accuracy when LCOH were used, compared with alkanes and LCFA. By contrast, Dove and Charmley (Reference Dove and Charmley2008) obtained better estimates of diet composition of sheep when using alkanes compared with LCOH, due to high correlation between the LCOH profiles of two of the forage components (Phalaris aquatica and ryegrass). Similarly, Boland et al. (Reference Boland, Scaglia, Notter, Rook, Swecker and Abaye2012) in a study performed with beef steers grazing tall fescue and alfalfa observed that longer carbon-chain LCOH (C26-C30) added additional characterization of forages, but diet composition estimates were not different than those when estimated using alkanes alone. It should be pointed out that the superiority of LCOH markers found in this study, may be situation dependent and the selection of one type of marker should also be based on the marker concentrations in the possible diet components and its capability of discriminating between them (Ferreira et al., Reference Ferreira, Celaya, Santos, Guedes, Rodrigues, Mayes and Osoro2012), discarding types of marker with very low concentrations in plant species within the diets. It is usually suggested that markers with very low concentrations have greater measurement errors in their analytical determination (Dove and Mayes, Reference Dove and Mayes2005) and their utilization may result in less accurate estimates of diet composition (Charmley and Dove, Reference Charmley and Dove2007; Ferreira et al., Reference Ferreira, Carvalho, Falco, Celaya, García, Santos, Rodrigues and Osoro2009b).
As recognized in previous studies (Dove and Mayes, Reference Dove and Mayes2005; Ferreira et al., Reference Ferreira, Oliván, García, Rodrigues and Osoro2005 and Reference Ferreira, García, Celaya, Rodrigues and Osoro2009a; Oliván et al., Reference Oliván, Ferreira, García, Celaya and Osoro2007b), the major limitation of the application of faecal markers in grazing studies is their dependence on the use of accurate FR values to obtain accurate estimates of diet composition. In this study, the most accurate estimates of diet composition for both species were obtained when using the mean faecal concentration for the total of animals within species. These results are consistent with those reported by previous studies for horses and cattle with alkanes (Ferreira et al., Reference Ferreira, García, Celaya, Rodrigues and Osoro2009a) and LCFA markers (Ferreira et al., Reference Ferreira, Celaya, Santos, Falco, Guedes, Rodrigues and Osoro2010), and for small ruminants with LCOH markers (Ali et al., Reference Ali, Mayes, Lamb, Hector, Verma and Ørskov2004; Dove and Charmley, Reference Dove and Charmley2008; Ferreira et al., Reference Ferreira, Celaya, Santos, Guedes, Rodrigues, Mayes and Osoro2012 and Reference Ferreira, Celaya, Santos, Mayes, Rodrigues and Osoro2015) and highlight the need of using accurate estimates of markers’ FR to improve the accuracy of diet composition estimates in both horses and cattle.
Conclusions
The results obtained in this study showed the usefulness of LCOH as diet composition markers, offering additional discriminatory information to that provided by alkanes and LCFA for these particular vegetation communities. The combination of LCOH, LCFA and alkanes provided the more accurate estimates of diet composition. However, faecal concentrations of horses and cattle should be accurately corrected for incomplete FR to improve the precision of estimates.
Acknowledgements
The authors would like to thank Bob Mayes of the James Hutton Institute for his help on the alcohol analysis and to the Carbayal Research Station staff for their help in the field work. Carlos López López is recipient of a predoctoral fellowship from INIA.