Introduction
Lolium perenne is the most important forage species in Ireland and is a major component of the grasslands of temperate climate zones (Central Statistics Office, 2012). It occurs naturally in these zones, but is mainly sown as cultivars in pastures. Selection methods used in the development of cultivars may cause the loss of rare alleles that are not directly involved in the trait of interest, but may be linked to other important characteristics such as resistance to abiotic stress, disease tolerance or high seed yield. Therefore, it is important to maintain collections of germplasm containing such rare alleles and characterize them for maximum utilization in breeding.
Many types of nuclear markers have been used to characterize genetic diversity and population structure in L. perenne and related species (e.g. Kolliker et al., Reference Kolliker, Stadelmann, Reidy and Nosberger1999; Cresswell et al., Reference Cresswell, Hamilton, Roy and Viegas2001; Kubik et al., Reference Kubik, Sawkins, Meyer and Gaut2001; Bolaric et al., Reference Bolaric, Barth, Melchinger and Posselt2005a, Reference Bolaric, Barth, Melchinger and Posseltb), including amplified fragment length polymorphism (AFLP) markers, sequence tagged site markers and simple sequence repeat (SSR) markers (Roldan-Ruiz et al., Reference Roldan-Ruiz, Calsyn, Gilliland, Coll, van Eijk and De Loose2000; Guthridge et al., Reference Guthridge, Dupal, Kolliker, Jones, Smith and Forster2001; Jones et al., Reference Jones, Dupal, Kolliker, Drayton and Forster2001; Kubik et al., Reference Kubik, Sawkins, Meyer and Gaut2001; Roldan-Ruiz et al., Reference Roldan-Ruiz, van Eeuwijk, Gilliland, Dubreuil, Dillmann, Lallemand, De Loose and Baril2001; Skøt et al., Reference Skøt, Hamilton, Mizen, Chorlton and Thomas2002; Lem and Lallemand, Reference Lem and Lallemand2003; Momotaz et al., Reference Momotaz, Forster and Yamada2004; Warnke et al., Reference Warnke, Barker, Jung, Sim, Rouf Mian, Saha, Brilman, Dupal and Forster2004; Van Treuren et al., Reference Van Treuren, Bas, Goossens, Jansen and Van Soest2005; Auzanneau et al., Reference Auzanneau, Huyghe, Julier and Barre2007). Single nucleotide polymorphism (SNP) markers have been used to assess nucleotide diversity (Ponting et al., Reference Ponting, Drayton, Cogan, Dobrowolski, Spangenberg, Smith and Forster2007; Xing et al., Reference Xing, Frei, Schejbel, Asp and Lubberstedt2007). Recently, a European ecotype collection consisting of 90 ecotypes has been genotyped by a SNP array (Blackmore et al., Reference Blackmore, Thomas, McMahon, Powell and Hegarty2015). Nuclear SSR markers have not, so far, been used to characterize genetic diversity in Irish ecotypes or applied to the collections housed by Teagasc.
Many approaches can be taken to characterize genetic resource collections once marker data have been collected, but most include allelic and genotypic diversity estimation, some sort of genetic clustering method, structure analysis, assessments of the degree of partitioning of variation among and within populations and linkage disequilibrium assessments (Pritchard et al., Reference Pritchard, Stephens, Rosenberg and Donnelly2000a; Charlesworth and Wright, Reference Charlesworth and Wright2001; McGrath et al., Reference McGrath, Hodkinson and Barth2007).
This study aimed to characterize nuclear DNA variation in a collection of L. perenne using nuclear SSR markers. More specifically, it aimed to (1) describe allelic and genotypic diversity in natural and breeding populations of L. perenne including Irish and other European ecotypes and bred cultivars, (2) determine the partitioning of the variation between and among the accessions and groups of accessions and (3) evaluate population structure in the collection.
Materials and methods
Plant populations and molecular marker analyses
A total of 928 individuals from a selection of 40 diploid L. perenne accessions were used in this study (Supplementary Table S1, available online). These 40 accessions have been previously used in the work reported to investigate chloroplast DNA diversity and population genetic structure and pattern (McGrath et al., Reference McGrath, Hodkinson and Barth2007), and morphological (McGrath et al., Reference McGrath, Hodkinson, Charles, Zen and Barth2010) and biochemical diversity (McGrath et al., Reference McGrath, Hodkinson, Frohlich, Grant and Barth2014). The sample included 22 Irish ecotypic accessions, seven European ecotypes and 11 released cultivars. Approximately 24 individuals from each accession were selected for analysis. Leaf material from each plant was harvested into 96-well deep-well plates. The samples were dried using a freeze dryer (Ilshin Lab. Co. Ltd, Hialeah, Fl, USA). A single 5 mm glass bead was placed in each well and the samples were then ground with a bead mill (Retsch MM300). DNA was extracted from the samples using a magnetic bead-based method (Qiagen MagAttract Plant DNA Core Kit) on the HamiltonStar automated liquid handling system.
Eight microsatellite primers were chosen from a set developed by IBERS/UK (Turner et al., Reference Turner, Cairns, Armstead, Ashton, Skøt, Whittaker and Humphreys2006: LpHCA18F11, LpACT26D12, LpACT13H2) and by ViaLactia Biosciences (Gill et al., Reference Gill, Wilcox, Whittaker, Winz, Bickerstaff, Echt, Kent, Humphreys, Elborough and Gardner2006: rv0264, rv0908, rv0449, rv1239, rv1423). PCR conditions as described in the original publications were chosen. Amplified PCR products were prepared for analysis on an ABI3100 automated DNA sequencer (Applied Biosystems, Foster City, USA). Amplified PCR products were heated at 65°C for 30 min on a Px2 Thermal Cycler (Thermo Electron Corporation, Waltham, USA) to avoid non-uniform PolyA tails. PCR products were diluted in sterile ultrapure water to achieve optimum fluorescence intensities for runs on the ABI3100 automated DNA sequencer.
Allelic variation
Allele numbers and size ranges of alleles per locus were calculated over all accessions and for each group of accessions (cultivars, all ecotypes, Irish ecotypes and European ecotypes). Observed and expected heterozygosities were calculated for each population at each locus and over all loci, as well as for each group of accessions according to Nei (Reference Nei1973) using POPGENE (Yeh and Boyle, Reference Yeh and Boyle1997). Tests for Hardy–Weinberg equilibrium (HWE) were performed on each population at each locus and for each group of accessions using a modified Markov-chain random walk algorithm (Guo and Thompson, Reference Guo and Thompson1992), and were tested for significance using 1000 permutations in ARLEQUIN 2.0 software (Schneider et al., Reference Schneider, Roessli and Excoffier2000). Polymorphic information content (PIC) values were calculated by hand for each locus over all accessions and for each group of accessions, from allele frequency data calculated in POPGENE (Yeh and Boyle, Reference Yeh and Boyle1997) based on Botstein et al. (Reference Botstein, White, Skolnick and Davis1980).
Genetic distance between populations
A genetic distance matrix was calculated based on Nei's standard genetic distance measure (Nei, Reference Nei1972), using allele data (characters) without size information, and calculated using POPGENE (Yeh and Boyle, Reference Yeh and Boyle1997). From this matrix, a dendrogram showing the similarities between populations was constructed using the unweighted pair group method with arithmetic mean (UPGMA; Sneath and Sokal, Reference Sneath and Sokal1973) as implemented in POPGENE (Yeh and Boyle, Reference Yeh and Boyle1997). Bootstrapping analysis was performed to assess the reliability of groupings (Salamin et al., Reference Salamin, Hodkinson and Savolainen2005) on the UPGMA data with 1000 replicates as implemented in NTSYSpc V2.2 software (Rohlf, Reference Rohlf2005).
Principal components analysis
PCA was performed on the genetic distance matrix, which was based on Nei's genetic distance (Nei, Reference Nei1972). Graphs of the eigenvectors and eigenvalues for two dimensions were constructed. An analysis of molecular variance (AMOVA; Excoffier et al., Reference Excoffier, Smouse and Quattro1992) was carried out with ARLEQUIN 2.0 software (Schneider et al., Reference Schneider, Roessli and Excoffier2000). The level of significance for variance component estimates was calculated by non-parametric permutation procedures using 1000 permutations. The data were partitioned into several combinations to display among and within population variation of Irish and European L. perenne accessions and cultivars, and to assess groupings found in the PCA. Nei's coefficient of gene differentiation (G ST) was calculated for all populations and for subgroups of accessions (cultivars, all ecotypes, Irish ecotypes and European ecotypes). F-statistics were calculated over all populations, for the group cultivars, Irish ecotypes and European ecotypes, according to Weir and Cockerham (Reference Weir and Cockerham1984). Weir's F-statistics (based on variance values of allele frequencies) were used in preference to standard F-statistics (based on allele frequencies) because it has been shown that they are more reliable when the sample size for each population is less than 30 (Berg and Hamrick, Reference Berg and Hamrick1995).
Population structure
Genetic structure among individuals over the whole dataset was investigated with a model-based clustering approach using the software package STRUCTURE (Pritchard et al., Reference Pritchard, Stephens and Donnelly2000b; Falush et al., Reference Falush, Stephens and Pritchard2003, Reference Falush, Stephens and Pritchard2007). The number of subpopulations (K) was set from 1 to 40. Each run started with a burn-in of 20,000, followed by 20,000 iterations and employing an admixture model. Each run was performed independently ten times. In order to determine the number of genetic groups present in the population, an online interface program STRUCTURE HARVESTOR was used (Earl and vonHoldt, Reference Earl and vonHoldt2012). The program processes STRUCTURE results using the method described in Evanno et al. (Reference Evanno, Regnaut and Goudet2005) and generates a ΔK graph to help determine the number of K groups that best fit the data. To visualize the membership of individuals to groups, a bar plot was generated by using an online interface program called STRUCTURE PLOT (Ramasamy et al., Reference Ramasamy, Ramasamy, Bindroo and Naik2014), but to minimize the variance across all the replicates of the selected K value, the program CLUMPP was implemented to generate a single Q matrix file for visualization (Jakobsson and Rosenberg, Reference Jakobsson and Rosenberg2007).
Results
Heterozygosity and allelic variation
Observed and expected heterozygosities (gene diversity) were calculated for each locus, over all accessions and for each group of accessions (cultivars, ecotypes, Irish ecotypes and European ecotypes; Table 1). All loci, both over all accessions and for each group of accessions, were significantly less heterozygous than would be expected if the accessions were under HWE, with a significance level of P< 0.001. Over all loci, across all subpopulations, gene diversity ranged from 0.61 in European ecotypes at locus rv0908 to 0.90 in cultivars at locus rv0449. Gene diversity values varied considerably among populations within loci. For example, gene diversity at locus LpHCA18F11 ranged from 0.69 in Irish ecotypes to 0.83 in European ecotypes. Expected heterozygosity values varied considerably between accessions and between loci (a full range between 0.04 in Irish ecotype IRL-OP-02 007 at locus LpHCA18F11 and 0.91 in ecotypes IRL-OP-02 059, IRL-OP-02 538 and IV-51-161 Hungary at locus rv1239 and IV-51-16 Hungary at locus LpACT13H2 in the entire collection; data not shown). When calculated over all loci, gene diversity values ranged from 0.57 in cultivar Cancan to 0.8 in ecotype IV-51-161 Hungary. The accessions also showed significant deviations from HWE for each locus. The majority of the populations at each locus were less heterozygous than would be expected under the conditions of HWE. When calculated over all loci, gene diversity values ranged from 0.80 in European ecotypes to 0.82 in cultivars. The coefficient of gene differentiation (G ST) was 0.23 over all populations and ranged from 0.18 in European ecotypes to 0.23 in cultivars (Table 1).
Observed and expected heterozygosities at each locus for each group of populations (overall, cultivars, ecotypes, Irish ecotypes and European ecotypes)

N, number of individuals; H o, observed heterozygosity; H e, expected heterozygosity; G ST, coefficient of gene differentiation.
Significant deviations from HWE were observed at *** P< 0.001.
Numbers of alleles, size ranges and PIC values were calculated for each locus over all accessions for cultivars, all ecotypes, Irish ecotypes and European ecotypes (data not shown). Loci rv1239 and rv1423 had the highest number of alleles (26), while locus LpACT26D12 had the lowest number of alleles (16). The widest range of allele sizes was seen in locus LpACT26D12 (61 bp) and the shortest size range was seen in locus rv0908 (25 bp). PIC values over all accessions ranged from 0.70 in locus rv0908 to 0.88 in loci rv0449 and rv1239.
Genetic distance between populations
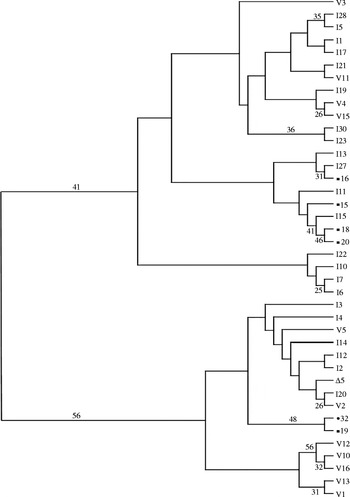
The dendrogram [distances were calculated according to Nei (Reference Nei1973) as implemented in POPGENE (Yeh and Boyle, Reference Yeh and Boyle1997)] shows two major groups, 1 and 2 (Fig. 1). Group 1 had a bootstrap support of 41% and contained all the Irish ecotypes, with the exception of IRL-OP-02 007 (I3), IRL-OP-02 011 (I4), IRL-OP-02 059 (I2), IRL-OP-02 230 (I12), IRL-OP-02 241 (I20) and IRL-OP-02 538 (I14). It also contained the European ecotypes No 10 Spain (■15), 3408 Italy (■16), 3013 Romania (■18) and 920 Bulgaria (■20) and the commercial varieties Cancan (V3), Cashel (V4), Portstewart (V11) and Shandon (V15). Group 2 had a bootstrap support of 56% and contained the Irish ecotypes IRL-OP-02 007 (I3), IRL-OP-02 011 (I4), IRL-OP-02 059 (I2), IRL-OP-02 230 (I12), IRL-OP-02 241 (I20) and IRL-OP-02 538 (I14), the European ecotypes 16-7-62-2 Nordic (Δ5), 3199 Romania Podoloni (■19) and IV-51-161 Hungary (●32) and the cultivars Aurora (V1), Barlenna (V2), Fennema (V5), Odenwaelder (V10), Premo (V12), S24 (V13) and Talbot (V16). Group 2 also contained cultivars that had been developed in earlier European breeding programmes, and individual clusters within this group had a moderate bootstrap support.
Unrooted dendrogram showing similarities between perennial ryegrass populations, constructed using the UPGMA method (Sneath and Sokal, Reference Sneath and Sokal1973) as implemented in POPGENE (Yeh and Boyle, Reference Yeh and Boyle1997), based on Nei's genetic distance measures (Nei, Reference Nei1972). Numbers on the branches are percentage bootstrap values generated in NTSYSpc V2.2 (Rohlf, Reference Rohlf2005). Different symbols represent a geographical group: ■, Northern Europe; Δ, Southern Europe; ●, Eastern Europe; I, Ireland; V, cultivar.

Principal components analysis
All the variation in the dataset was explained by three eigenvalues. The first eigenvalue explained 57.60% of the variation, the second eigenvalue explained 31.49% of the variation and the third eigenvalue explained the final 10.91% of the variation (data not shown). Two major gene pools of ecotypic accessions were defined by the PCA that corresponded to those found in the UPGMA (data not shown).
Analysis of molecular variance
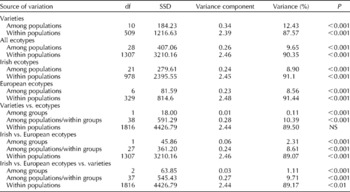
AMOVA was carried out on seven different subgroups of accessions (Table 2) to test for differences in genetic structure among and within the Irish and European ecotypes and commercial varieties. For all subgroups, the within-population variation accounted for most variation. For example, for all ecotypes, the within-population variation accounted for 90.35% of the total variation, with a significance level of P< 0.001. The within-population variation was higher for ecotypes (90.35% over all ecotypes, 91.1% in Irish ecotypes and 91.44% in European ecotypes) than for commercial varieties (87.57%). In any case, levels of variation in each subgroup were similar to each other. When groups of accessions were compared with each other, levels of within-population variation were similar to each other (89.50, 89.07 and 89.17%, respectively). The among-group variation was highest between the Irish and European ecotypes (2.31%) and lowest between the commercial varieties and all ecotypes (0.11%).
AMOVA for Irish and European perennial ryegrass accessions and varieties

df, Degrees of freedom; SSD, sum of squared differences; NS, not significant.
F-statistics
Weir and Cockerham's (Reference Weir and Cockerham1984) F-statistics were calculated for each locus and over all loci to assess the level of variation within and between the Irish and European ecotypes and cultivars (data not shown). For the Irish ecotypes versus European ecotypes versus cultivars, F IT, which is the proportion of variation among all individuals, ranged from 0.19 at locus rv0264 to 0.64 at locus LpHCA13H2, and over all loci was 0.39. F ST, which is the proportion of variation among all populations, ranged from 0.07 at locus rv1423 to 0.16 at loci rv0908 and LpHCA13H2, and over all loci was 0.11. F PT, which is the proportion of variation among groups ranged from 0 at four loci to 0.03 at locus rv0908, and over all loci was 0.01. F IS, which is the proportion of variation between individuals among populations, ranged from 0.14 at locus rv0264 to 0.58 at locus LpHCA13H2, and over all loci was 0.31. F SP, which is the proportion of variation between populations among groups ranged from 0.06 at loci LpACT26D12 and rv0264 to 0.15 at locus LpHCA13H2, and over all loci was 0.10. F IP, which is the proportion of variation between individuals among groups, ranged from 0.19 at locus rv0264 to 0.64 at locus LpHCA13H2, and over all loci was 0.38. For the other tests, results were very similar to those found in the AMOVA.
Structure analysis
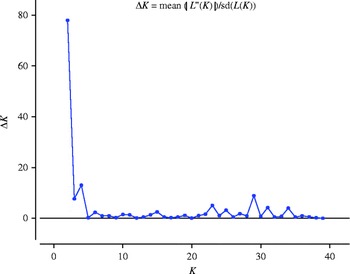
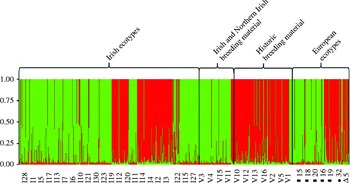
Genetic structure among individuals over the whole dataset was investigated. When K was plotted against the ΔK values, it could be seen that the ΔK value started high at K= 2 and declined immediately, suggesting the presence of two groups as best fit for the data (Fig. 2). The STRUCTURE analysis confirmed that Irish ecotypes fell into two major gene pools where one of the gene pools accounted for two-thirds of the ecotypes (Fig. 3). The same gene pool included most of the current Irish and Northern Irish breeding materials and about half of the European ecotypes included in this study.
ΔK value showing the presence of two groups by a steep decline in the graph after K= 2.

Visualization of two gene pools in the investigated perennial ryegrass populations. Data in the bar plot are shown by using the program STRUCTURE PLOT (Ramasamy et al., Reference Ramasamy, Ramasamy, Bindroo and Naik2014) with an implementation of the program CLUMPP (Jakobsson and Rosenberg, Reference Jakobsson and Rosenberg2007).

Discussion
Allelic and genotypic variation in Lolium perenne
Eight SSR markers were used to characterize the genetic diversity in a collection of 40 diploid L. perenne accessions. Markers were highly polymorphic both overall and within individual populations. Allele numbers and heterozygosities (H o and H e) had wide variability both over groups within a marker and over all markers. The average number of alleles per locus over all accessions was 22.25 (data not shown), which is higher than that found in other studies using SSR markers (2–7 alleles per locus, Jones et al., Reference Jones, Dupal, Kolliker, Drayton and Forster2001; 19.41 per locus, Kubik et al., Reference Kubik, Sawkins, Meyer and Gaut2001; 3.25 alleles per locus, Studer et al., Reference Studer, Widmer, Enkerli and Kolliker2006; 9.37 alleles per locus, Auzanneau et al., Reference Auzanneau, Huyghe, Julier and Barre2007). However, these studies had a smaller number of individuals and so a smaller number of alleles would be expected to be generated with fewer individuals. In subgroups of accessions (Irish ecotypes, European ecotypes and cultivars), allele numbers across loci ranged from an average of 16.88 in European ecotypes to 21.75 in Irish ecotypes, with cultivars having an intermediate average number of alleles (19.38). Gene diversity values [H e: according to Nei (Reference Nei1973)] ranged from 0.57 to 0.8 across the populations, and had a value of 0.82 over all accessions. This value is much higher than values calculated in studies using SSR markers (0.59–0.64, Kubik et al., Reference Kubik, Sawkins, Meyer and Gaut2001; 0.56, Studer et al., Reference Studer, Widmer, Enkerli and Kolliker2006; 0.60, Auzanneau et al., Reference Auzanneau, Huyghe, Julier and Barre2007) and also much higher than values calculated using AFLP markers (0.17, Skøt et al., Reference Skøt, Humphreys, Armstead, Heywood, Skøt, Sanderson, Thomas, Chorlton and Hamilton2005; 0.18–0.2, Van Treuren et al., Reference Van Treuren, Bas, Goossens, Jansen and Van Soest2005). Furthermore, PIC values ranged from 0.71 to 0.89 with an average of 0.81 over all markers. This value is much higher than PIC values found in previous studies, both of cultivars (0.28, Roldan-Ruiz et al., Reference Roldan-Ruiz, Calsyn, Gilliland, Coll, van Eijk and De Loose2000; 0.41, Bolaric et al., Reference Bolaric, Barth, Melchinger and Posselt2005a) and of ecotypes (0.33–0.40, Bolaric et al., Reference Bolaric, Barth, Melchinger and Posselt2005b). This may be due to the different marker system (SSR) used or to the fact that the sample size employed was bigger compared with previous studies.
An excess of homozygotes was found in many accessions or groups of accessions (data not shown). This is in agreement with a previous study of L. perenne using SSR markers (Kubik et al., Reference Kubik, Sawkins, Meyer and Gaut2001), which also showed an excess of homozygotes. While small numbers of individual populations either agreed with HWE or were slightly in excess of heterozygotes, the vast majority of accessions were less heterozygous than would be expected. So while allele numbers were high, both in individual accessions and over all accessions, individuals were generally more homozygous than would be expected. The reasons why populations might deviate from HWE are non-random mating, due to inbreeding, or small population size, directional selection, mutation and migration. While the cultivars in this study could be expected to deviate from HWE because of inbreeding caused by selective breeding, the ecotypic material would be normally expected to be more heterozygous, which is not the case. The Weir and Cockerham (Reference Weir and Cockerham1984) inbreeding coefficient (F IS) of Irish ecotypes, European ecotypes and cultivars ranged from 0.14 at locus rv0264 to 0.58 at locus LpHCA13H2, and over all loci was 0.31. Within the ecotypic material, the populations may have been isolated from each other or breeding may not have been random at the scale of sampling used (e.g. increased mating between closely related plants, relative to the entire population, would occur because they lie in close proximity to each other).
Partitioning of variation in Lolium perenne
AMOVA was used to analyse the partitioning of variation within and among groups of accessions. In every case, most variation was explained by within population variation, which ranged from 87.57% in cultivars (varieties) to 91.44% in European ecotypes. This is in agreement with many other studies of L. perenne, both cultivars and ecotypes, and irrespective of the marker system (66%, Bolaric et al., Reference Bolaric, Barth, Melchinger and Posselt2005a; 71%, Bolaric et al., Reference Bolaric, Barth, Melchinger and Posselt2005b; 82%, Kolliker et al., Reference Kolliker, Stadelmann, Reidy and Nosberger1999; 85.35%, Kubik et al., Reference Kubik, Sawkins, Meyer and Gaut2001; 89.6%, Guthridge et al., Reference Guthridge, Dupal, Kolliker, Jones, Smith and Forster2001; 58.5%, Van Treuren et al., Reference Van Treuren, Bas, Goossens, Jansen and Van Soest2005 for first two dimensions of PCA). Equally, when analysed by Weir and Cockerham's (Reference Weir and Cockerham1984) F-statistics, the majority of variation over all accessions was explained by within-population variation (F IT 0.39, F IS 0.31 and F IP 0.38).
When different groups of accessions were compared with each other, the within-population variation was again high, and much lower variation was seen between groups. When groups seen in the PCA were compared with each other by AMOVA and F-statistics, similar results were found, with the exception of the comparison between the historic breeding material and the Irish/Northern Irish breeding material, where between-group variation was higher than in other comparisons. This would be expected from the different breeding histories of the groups. G ST values were 0.23 overall and ranged from 0.18 in European ecotypes to 0.23 in cultivars. The higher value of G ST in cultivars is in agreement with the higher level of between-population variation seen in the AMOVA for cultivars; as the G ST value increases, the populations become more different from each other.
Relationships between accessions and genetic distance
Two groups of accessions could be defined in both the UPGMA dendrogram and the PCA. While Mantel tests did not show any correlation between geographical distance and genetic distance, several clusters of geographically close accessions were found in both, and with reasonable bootstrap support in the UPGMA dendrogram. So perhaps in the overall group of populations, there was no obvious geographical groups, but close geographical populations may have bred together. In the PCA diagram, the division of the populations would seem to be reliable given that 89.09% of the variation was explained by the first two dimensions. This is in agreement with a study using RAPD markers (Kolliker et al., Reference Kolliker, Stadelmann, Reidy and Nosberger1999) where 88% of the variation within L. perenne was explained by the first three dimensions. This is in comparison to previously more commonly used markers (AFLP) where there are often high levels of dimensionality. That is, the major axes only explained small amounts of the variation observed (Cresswell et al., Reference Cresswell, Hamilton, Roy and Viegas2001; Guthridge et al., Reference Guthridge, Dupal, Kolliker, Jones, Smith and Forster2001; Skøt et al., Reference Skøt, Hamilton, Mizen, Chorlton and Thomas2002; Van Treuren et al., Reference Van Treuren, Bas, Goossens, Jansen and Van Soest2005). The STRUCTURE analysis predicted two clusters (gene pools), which were similar to the groups found in the UPGMA and PCA. A similar grouping of two major gene pools has been found in a European ecotype study by Blackmore et al. (Reference Blackmore, Thomas, McMahon, Powell and Hegarty2015). When individuals were assigned to clusters, some individuals were assigned partially to more than one cluster; this might reflect continuous gradations in allele frequencies or admixture of neighbouring groups (Rosenberg et al., Reference Rosenberg, Pritchard, Weber, Cann, Kidd, Zhivotovsky and Feldman2002). This is expected because of the outbreeding nature of L. perenne, as well as the easy spread of pollen (by wind) and seeds (by multiple means). It could also explain the general lack of geographical differentiation between accessions (with the exception of a number of accessions, in Cork for example, which could be explained by adaptation to similar environments). No geographical structuring, either within Ireland or across Europe, was seen in this structuring analysis.
Supplementary material
To view supplementary material for this article, please visit http://dx.doi.org/10.1017/S1479262115000611
Acknowledgements
This work was funded by Teagasc Walsh PhD fellowships to S. M. G. and S. K., Teagasc core funding and additional funding from the Genetic Resources for Food and Agriculture fund of the Irish Department of Agriculture, Food and the Marine to S. B. The authors are grateful for the comments of one exceptional anonymous referee who improved the manuscript significantly.