Significant structural and functional brain development occurs during adolescence, supporting the concurrent development of emotional and cognitive regulation (Casey, Jones, & Hare, Reference Casey, Jones and Hare2008; Dahl, Reference Dahl2001; Spear, Reference Spear2000; Steinberg, Reference Steinberg2005). However, brain development during adolescence may also potentiate the occurrence of a variety of forms of psychopathology, including alcohol abuse and dependence (Paus, Keshavan, & Giedd, Reference Paus, Keshavan and Giedd2008; Spear, Reference Spear2000). Adolescent neurological changes have been observed via the use of noninvasive structural magnetic resonance imaging (MRI) and functional magnetic resonance imaging (fMRI) techniques. Such adolescent neuroimaging research has suggested a developmental trajectory toward increasingly refined neural circuitry and signaling efficiency. Less is known, however, about developmental neurochemical changes occurring during this period or the impact of these changes on cognition, behavior, or the risk for alcohol addiction. Brain neurochemistry can be explored via magnetic resonance spectroscopy (MRS), a technology that permits noninvasive in vivo detection of multiple brain metabolites relevant to neuronal health and functioning, as well as key neurotransmitter systems such as γ-aminobutyric acid (GABA) and glutamate (Glu). To date, there have been a number of MRS studies exploring normative developmental changes in neurochemistry in the neonatal period, infancy, and early childhood, but there is a paucity of studies focusing on adolescence. There have been significantly more studies conducted using MRS to investigate metabolite abnormalities associated with pediatric psychopathology, including, but not limited to, pediatric depression (Gabbay et al., Reference Gabbay, Mao, Klein, Ely, Babb and Panzer2012; Olvera et al., Reference Olvera, Caetano, Stanley, Chen, Nicoletti and Hatch2010), bipolar disorder (Davanzo et al., Reference Davanzo, Yue, Thomas, Belin, Mintz and Venkatraman2003; Sikoglu et al., Reference Sikoglu, Jensen, Vitaliano, Liso Navarro, Renshaw and Frazier2013), obsessive–compulsive disorder (Whiteside, Abramowitz, & Port, Reference Whiteside, Abramowitz and Port2012), generalized anxiety disorder (Strawn et al., Reference Strawn, Chu, Whitsel, Weber, Norris and Adler2013), and attention-deficit/hyperactivity disorder (Soliva et al., Reference Soliva, Moreno, Fauquet, Bielsa, Carmona and Gispert2010; Yeo, Hill, Campbell, Vigil, & Brooks, Reference Yeo, Hill, Campbell, Vigil and Brooks2000). In contrast, no MRS data are available that provide insight into the effects of alcohol use and abuse on neurochemistry during adolescence, despite the high prevalence of consumption in this age group (SAMHSA, 2004). Accordingly, the purpose of this review is to provide a brief overview of key cognitive, behavioral, and neurological changes during adolescence; outline the basic principles and methods of MRS; review the existing MRS literature on normative neurochemical development and the relationships between neurochemistry and cognitive functioning in normative development and in adults with alcohol abuse disorders; and present potential applications of MRS in understanding the effects of alcohol consumption and alcohol use disorders on neurochemistry in adolescent populations. Developmental characterization of neurochemistry via MRS during adolescence would help fill in important knowledge gaps and could yield mechanistic hypotheses regarding normative trajectories of adolescent neurochemical development and nonnormative neurochemical trajectories associated with adolescent alcohol abuse disorders.
Adolescent Development
While structural and functional brain development, along with concurrent cognitive changes, are widely evident and documented during adolescence, less is known about changes in brain chemistry during this age period that may contribute to healthy developmental changes in cognition and behavior, as well as adolescents' elevated risk for multiple forms of psychopathology (Paus et al., Reference Paus, Keshavan and Giedd2008). Structural, functional, and neurochemical changes in the adolescent brain do not occur independently, but rather they interact to produce the cognitive and behavioral changes observed during adolescence. Thus, the section below provides a very brief overview of adolescent cognitive and neurobiological development, providing necessary context for the subsequent discussion of MRS findings. More extensive discussions of the many cognitive, behavioral, and neurological changes that occur during adolescence are available in multiple existing reviews (e.g., Blakemore & Choudhury, Reference Blakemore and Choudhury2006; Casey et al., Reference Casey, Jones and Hare2008; Dahl, Reference Dahl2001; Spear, Reference Spear2000; Steinberg, Reference Steinberg2005, Reference Steinberg2010).
Cognitive development in adolescence is predominantly characterized by the maturation of executive functions and the consequent consolidation of collaborative cognitive systems, allowing for flexible thinking, complex problem solving, and cognitive control (Hooper, Luciana, Conklin, & Yarger, Reference Hooper, Luciana, Conklin and Yarger2004; Huizinga, Dolan, & van der Molen, Reference Huizinga, Dolan and van der Molen2006; Johnstone, Pleffer, Barry, Clarke, & Smith, Reference Johnstone, Pleffer, Barry, Clarke and Smith2005; Rubia et al., Reference Rubia, Smith, Woolley, Nosarti, Heyman and Taylor2006; Toga, Thompson, & Sowell, Reference Toga, Thompson and Sowell2006). Adolescents also demonstrate higher levels of sensation seeking than do children or adults, often leading to experimentation with alcohol and drugs, as well as other risky behaviors (Spear, Reference Spear2000). Adolescence also features interacting and changing relationships between emotion and cognitive control (Cohen-Gilbert & Thomas, Reference Cohen-Gilbert and Thomas2013; Somerville, Jones, & Casey, Reference Somerville, Jones and Casey2010; Van Leijenhorst et al., Reference Van Leijenhorst, Zanolie, Van Meel, Westenberg, Rombouts and Crone2011), and elevated risk for multiple forms of psychopathology, including alcohol and substance abuse, mood disorders, eating disorders, and conduct disorder (Paus et al., Reference Paus, Keshavan and Giedd2008).
These important cognitive and behavioral changes during adolescence are linked to concurrent structural and functional changes occurring in the adolescent brain (Casey et al., Reference Casey, Jones and Hare2008; Toga et al., Reference Toga, Thompson and Sowell2006). Structural MRI and histological studies have demonstrated a continuous increase in white matter volume during adolescence, thought to reflect ongoing myelination of axons within the brain (Giedd et al., Reference Giedd, Blumenthal, Jeffries, Castellanos, Liu and Zijdenbos1999; Gogtay et al., Reference Gogtay, Giedd, Lusk, Hayashi, Greenstein and Vaituzis2004; Sowell, Thompson, Holmes, Jernigan, & Toga, Reference Sowell, Thompson, Holmes, Jernigan and Toga1999; Sowell, Trauner, Gamst, & Jernigan, Reference Sowell, Trauner, Gamst and Jernigan2002; Yakovlev & Lecours, Reference Yakovlev and Lecours1967). Diffusion tensor imaging data also support the existence of ongoing changes in white matter structural integrity during adolescence (Barnea-Goraly et al., Reference Barnea-Goraly, Menon, Eckert, Tamm, Bammer and Karchemskiy2005; Bava et al., Reference Bava, Thayer, Jacobus, Ward, Jernigan and Tapert2010; Liston et al., Reference Liston, Watts, Tottenham, Davidson, Niogi and Ulug2006; Schmithorst, Wilke, Dardzinski, & Holland, Reference Schmithorst, Wilke, Dardzinski and Holland2002). Higher order association areas and the prefrontal cortex (PFC) show a peak in gray matter volume in early adolescence, followed by a gradual decline that may reflect continued synaptic pruning (Giedd et al., Reference Giedd, Blumenthal, Jeffries, Castellanos, Liu and Zijdenbos1999; Gogtay et al., Reference Gogtay, Giedd, Lusk, Hayashi, Greenstein and Vaituzis2004). Because a number of brain metabolites, detectable using MRS, have physiological relevance to the expression of structural changes, for example, choline (Cho) reflective of myelination, N-acetylaspartate (NAA) reflective of gray matter integrity, and phosphomonoesters (PME) and phosphodiesters (PDE) reflective of membrane synthesis and breakdown (described in detail below, see also Table 1), integration of measures across structural and neurochemical studies in healthy adolescents and adolescents with psychopathology are warranted.
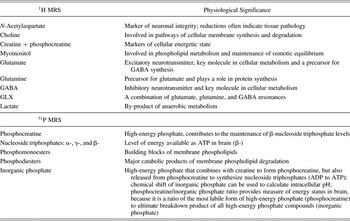
Physiological significance of MRS metabolites

Note: MRS, Magnetic resonance spectroscopy; GABA, γ-aminobutyric acid; ATP, adenosine triphosphate; ADP, adenosine diphosphate.
Functional neuroimaging studies suggest that the brain regions recruited for executive tasks also change significantly during the second decade of life. Studies using fMRI have documented a shift from diffuse to more focal activity and/or greater reliance on the PFC between late childhood and early adulthood during performance of tasks requiring executive functions (Casey et al., Reference Casey, Trainor, Orendi, Schubert, Nystrom and Giedd1997; Crone, Wendelken, Donahue, van Leijenhorst, & Bunge, Reference Crone, Wendelken, Donahue, van Leijenhorst and Bunge2006; Durston et al., Reference Durston, Davidson, Tottenham, Galvan, Spicer and Fossella2006; Scherf, Sweeney, & Luna, Reference Scherf, Sweeney and Luna2006). This shift is thought to reflect improved efficiency in the recruitment of necessary regulatory circuitry, along with reductions in the overall effort necessary to perform executive tasks (Durston et al., Reference Durston, Davidson, Tottenham, Galvan, Spicer and Fossella2006; Luna, Padmanabhan, & O'Hearn, Reference Luna, Padmanabhan and O'Hearn2010). In addition to changes observed in prefrontal function, developmental changes occur during adolescence in widespread circuits including the parietal, temporal, cerebellar, and thalamic regions. Development of these cortical–subcortical circuits also supports age-related improvements in inhibitory control (Rubia, Smith, Taylor, & Brammer, Reference Rubia, Smith, Taylor and Brammer2007). Functional neuroimaging studies also show evidence that brain circuits involved in reward processing and emotion regulation are differentially activated in adolescence versus in childhood or adulthood (Ernst et al., Reference Ernst, Nelson, Jazbec, McClure, Monk and Leibenluft2005; Galvan et al., Reference Galvan, Hare, Parra, Penn, Voss and Glover2006; Hare et al., Reference Hare, Tottenham, Galvan, Voss, Glover and Casey2008). It has been suggested that there is a developmental shift toward reliance on more frontal regions during reward processing and decision making during adolescence (Casey et al., Reference Casey, Jones and Hare2008), supporting improvements in self-regulation and future-oriented decisions. As with structural studies, brain metabolites that can be acquired using MRS can be linked to processes associated with changes in functional brain activation. For example, phosphocreatine (PCr) reflects available energy resources, and beta nucleoside triphosphate (β-NTP) reflects the brain's available adenosine triphosphate (ATP). Neurochemicals measurable via MRS also reflect excitatory and inhibitory neurotransmission: Glu is the brain's primary excitatory neurotransmitter whereas GABA reflects inhibitory neurotransmission, both of which are also involved in glucose metabolism. Potentially impacting functional brain activation, lactate is indicative of anaerobic metabolism when energy substrates are taxed or unavailable owing to neurological abnormalities (described in detail below, see also Table 1).
Thus, to extend structural and functional developmental findings, MRS can be employed to assess neuronal health and integrity, bioenergetics, neurotransmission, and cell membrane synthesis and degradation. Use of this technique to identify neurobiological processes operating on a cellular level will extend our understanding of adolescent developmental changes in brain structure and function, as well as cognition, behavior, and risk for psychopathology.
MRS
MRS permits in vivo detection of multiple brain metabolites and some neurotransmitters. MRS data can be acquired using most standard scanners, and often spectra can be acquired within the same imaging session as other structural and functional scans. In all forms of MRI, when a sample is placed into a large static magnetic field, each nucleus precesses (or spins) about its axis, with some nuclei aligned with and some nuclei aligned against the direction of the field. The frequency of this nuclear precessional rotation is unique to the resonant (Larmor) frequency of a specific nucleus at a specific magnetic field strength. When a pulse from a radiofrequency (RF) coil is transmitted at the Larmor frequency for a particular nucleus (e.g., hydrogen), a transient magnetic field is generated, causing the targeted nuclei to transition to a higher energy state by absorbing the energy from the RF pulse. When the RF pulse is turned off, the nuclei within the sample release their energy in the form of a RF signal that contains spectral information encoded within it. In MRS, this information-rich signal is detected by the RF coil (acting as a receiver) and subsequently plotted as energy released (signal intensity) as a function of time, and then converted to a series of spectral peaks, whereby signal intensity can be visualized in the frequency domain (Hz), which is independent of magnetic field strength.
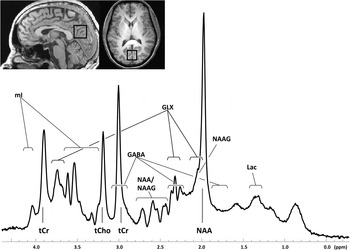
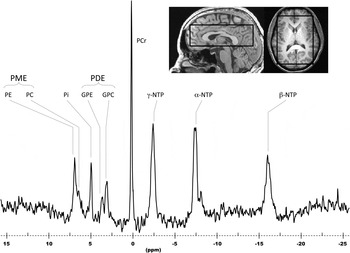
Proton (1H; Figure 1) and phosphorus (31P; Figure 2) are the two nuclei most commonly studied via MRS, although detection of resonance intensities is also possible for carbon (13C), sodium (23Na), sulfur (33S), fluorine (19F), and lithium (7Li). The use of MRS is limited to these and several other nuclei, based on their physical properties, that is, possessing a resonance frequency that responds, or aligns, within a magnetic field, and the release of energy after perturbation following application of an RF pulse, all of which make these nuclei MR visible. For a given nucleus (e.g., 1H), chemically distinct groups within a molecule that contain the given nucleus possess minor differences in their local resonant frequencies owing to the inhomogeneous and unique distribution of electrons within the molecule (Bovey, Jelinski, & Mirau, Reference Bovey, Jelinski and Mirau1988). These small differences in resonant frequency, or chemical shift, make it possible to differentiate molecules based on their distinct spectral signatures (e.g., Figure 1, 1H spectrum; Figure 2, 31P spectrum). The area of the resonance intensity, or the area under the peak, is proportional to the concentration of molecules that contribute to the resonance, thus allowing for the estimation of the concentration of a particular molecule within the sample.
Sagittal (left) and axial (right) anatomical images illustrating the placement of a single voxel (2 × 2 × 3 cm) in the anterior cingulate cortex of a healthy subject and the associated 1H spectrum (below). mI, Myoinositol; tCr, total creatine; tCho, total choline; GABA, γ-aminobutyric acid; NAA, N-acetylaspartate; NAAG, N-acetylaspartylglutamic acid; GLX, a combination of glutamate, glutamine, and GABA resonances; Lac, lactate.

Sagittal (left) and axial (right) anatomical images illustrating extracted spectral data from a three-dimensional chemical shift imagine voxel grid (2.1 × 2.1 × 2.1 cm) from a region placed in the anterior cingulate cortex of a healthy subject and the associated 31P spectrum (below). PME, Phosphomonoesters; PE, phosphoethanolamine; PC, phosphocholine; Pi, inorganic phosphate; PDE, phosphodiesters; GPE, glycerophosphoethanolamine; GPC, glycerophosphocholine; PCr, phosphocreatine; NTP, nucleoside triphosphate.

Nuclei that are capable of producing a resonance signal, and are therefore considered MR visible, differ in detection sensitivity based on their electromagnetic properties and concentrations, which must be high enough (millimolar range) to be detected. Sensitivity, or intensity of the MR signal, can be amplified by increasing the size of the voxel (or volume) sampled and/or by increasing the strength of the magnetic field. While larger voxels have more limited anatomical specificity, the use of stronger magnetic fields is limited by the availability of high field scanners. While a large number of MRS publications have included spectral data acquired at a low field (1.5 T), more recently, MRS data have been reported at increasingly higher field strengths (3, 4, and 7 T, and above; Mangia et al., Reference Mangia, Tkac, Gruetter, De Moortele, Giove and Maraviglia2006; Mekle et al., Reference Mekle, Mlynárik, Gambarota, Hergt, Krueger and Gruetter2009; Tkac et al., Reference Tkac, Andersen, Adriany, Merkle, Ugurbil and Gruetter2001; Tkac, Oz, Adriany, Ugurbil, & Gruetter, Reference Tkac, Oz, Adriany, Ugurbil and Gruetter2009). To date, however, published MRS studies in healthy children and adolescents have only been based on data acquired at 4 T (one study) or lower field strengths, the majority of which have been acquired at 1.5 T. Increases in field strength over the past decade have been particularly valuable for technological advancement of MRS methods, because sensitivity increases linearly with field strength, owing in part to greater spectral dispersion, or separation of metabolite peaks, which allows for improved quantification. Although the current trend is to acquire spectral data at relatively short echo times (e.g., 2–20 ms) in order to minimize signal loss, in some instances a metabolite-specific echo time is necessary to optimize metabolite detection (e.g., echo time = 68 ms for GABA).
In addition to identifying the nucleus of interest, hypotheses regarding anatomical structures of interest should also be considered when choosing the sequence for spectral acquisition. Spectra are acquired from either single anatomical volumes (single voxel) or from multiple volumes in two or three dimensions within the brain, each of which has its own strength. Multidimensional techniques such as chemical shift imaging (CSI) permit the collection of a matrix of spatially resolved spectral data from a large region of tissue selected using high-resolution anatomical MRI. CSI permits the extraction of data from multiple voxels during acquisition, and during postprocessing it allows for regional examination of metabolite levels (Brown, Kincaid, & Ugurbil, Reference Brown, Kincaid and Ugurbil1982; Wiedermann et al., Reference Wiedermann, Schuff, Matson, Soher, Du and Maudsley2001). Thus CSI is well suited for exploratory studies, such as those characterizing major metabolites (NAA, Cho, creatine [Cr]) across multiple regions during brain development. Single voxel MRS, in contrast, permits focus on a small number of discreet brain regions with higher spatial and spectral resolution, which is necessary for regions with increased susceptibility to field inhomogeneties, such as the frontal lobe or the hippocampus. Single voxel acquisition is also necessary when employing specialized acquisition schemes that are optimized for detecting complex metabolites, such as GABA or Glu.
The choice of MRS quantification strategy depends on the nucleus of interest to be examined. The most commonly used commercially available software program employed for the quantification of in vivo proton MR spectra is Linear Combination of Model Spectra (LCModel; Provencher, Reference Provencher1993, Reference Provencher2001). LCModel fits spectra by comparing in vivo raw spectral data either with in vitro metabolite data collected under identical conditions or with simulated basis sets. Phosphorous spectra are generally fitted in a similar fashion, typically using in-house software that fits spectra in the frequency or time domain using linear and interactive algorithms, similar to those used in LCModel.
Some MRS studies report absolute values, while others report ratios of one metabolite to another. In practice, calculating the absolute values of metabolite concentrations requires knowledge of the T1 and T2 relaxation times of the molecule of interest, the repetition time and echo time acquisition parameters, the tissue volume of interest, and the efficiency of signal detection. Calculation of absolute concentrations in LCModel uses a theoretical fitting routine (basis set) that incorporates the spectroscopic imaging parameters (repetition time and echo time) and nuclei-specific relaxation times. However, other factors specific to the volume of interest (partial volume effects or tissue content) and to the MR scanner are not incorporated in these calculations, which make metabolite concentrations very liberal, and perhaps unreliable, estimates of true metabolite levels. Given these difficulties, it is common practice to report relative values of MRS data as metabolite ratios. There remains, however, a significant debate regarding the optimal reference standard for determining metabolite ratios. Metabolite ratios can be calculated using a number of strategies. For example, metabolite peaks can be quantified relative to an external standard, typically a small capsule containing known amounts of metabolites placed near the subject's head. This method increases scan time, because spectra collected from the in vitro, external standard must be acquired within the same scanning session with the patient in the scanner. Alternatively, reference data can also be acquired from a phantom following removal of the subject from the scanner. However, this method is subject to variations owing to differences in coil loading between the subject's head position and that of the phantom. More recently, the use of an electric reference to access in vivo concentrations method has been applied for normalizing metabolite levels (Chen, Pavan, Heinzer-Schweizer, Boesiger, & Henning, Reference Chen, Pavan, Heinzer-Schweizer, Boesiger and Henning2012; Heinzer-Schweizer et al., Reference Heinzer-Schweizer, De Zanche, Pavan, Mens, Sturzenegger and Henning2010). This method introduces an additional synthetic reference signal during the spectral acquisition; it is not only sensitive to patient coil loading but can be quantified independent from in vivo metabolites.
In terms of normalizing to internal standards, the unsuppressed peak arising from water is routinely used to calculate metabolite ratios, but this is complicated by the need to discriminate between water in tissue versus water in cerebrospinal fluid, which can differ by up to 30%–40%. Another common strategy is to use a relatively stable metabolite peak, such as Cr. In proton MRS, the Cr peak represents the concentration of Cr plus PCr, which is typically maintained at constant levels in healthy tissue. However, like water, Cr levels vary between brain regions and tissue types, and may also differ between subject populations, complicating interpretations of metabolite ratios when Cr serves as the denominator. Furthermore, because the chemical composition of gray and white matter differ, it is important to assess the tissue content of the sampled brain regions. High-resolution anatomical MR images used to define voxels for spectral acquisition allow for tissue segmentation and subsequent calculation of relative metabolite levels in gray versus white matter (Pouwels & Frahm, Reference Pouwels and Frahm1998). Nonetheless, choosing a quantification strategy remains a significant challenge. It is likely that this technological issue will continue to be a major focus of research for the next several years.
Although studies utilizing MRS yield an abundance of information about both the structure and the chemical composition of tissues, MRS technology is limited by a number of factors. Optimal signal to noise ratio and a homogenous magnetic field are necessary to obtain narrow resonance peaks for quantification, which may require 10 to 45 min of scanning, free of motion artifact. As with other MR techniques, subject or patient comfort is critical for minimizing subject motion, which degrades spectral quality. Perhaps the most significant limitation of MRS is low sensitivity. The signal strength of a particular nucleus depends upon its inherent signal intensity and the externally applied magnetic field strength. Sensitivity limitations can be minimized by acquiring spectra at higher field strengths and by applying optimized strategies for spatial localization.
MRS During Healthy Brain Development and Relationships With Cognition
Few studies have been published regarding age-related changes in neurochemical metabolites focused on the first two decades of life. As reviewed in subsequent sections, these studies have used cross-sectional research designs and focus on childhood or the full life span, with little data available regarding neurochemical changes specifically occurring during adolescence. While some data are available regarding the relationships between MRS-visible metabolite concentrations and cognitive functioning in childhood and adolescence, the majority of such studies have been conducted in adults. Regardless, these studies have great value and offer promising new directions for future research in adolescent populations, because brain metabolite levels are predictive of not only cognitive performance but also impairments in cognitive functioning that are associated with psychopathological conditions, such as alcohol use disorders. Accordingly, results from selected studies examining metabolite–cognition relationships in adults are included here in order to elucidate the potential cognitive relevance of developmental changes in MR-visible metabolites.
Development and cognition: 1H MRS findings
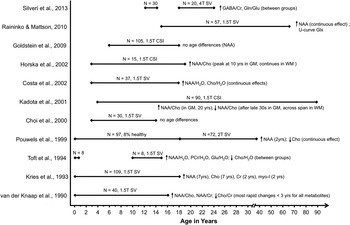
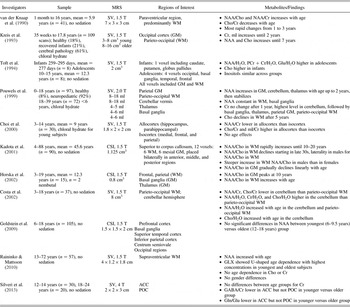
In vivo 1H MRS permits the detection and quantification of important amino acids that contain proton nuclei, including NAA, cytosolic Cho compounds, Cr, myoinositol (mI), and lactate (Figure 1). Albeit near the lower limit of detection, Glu, glutamine (Gln), and GABA can also be quantified in the proton spectrum (Behar & Rothman, Reference Behar and Rothman2001; Jensen, Frederick, & Renshaw, Reference Jensen, Frederick and Renshaw2005; Licata et al., Reference Licata, Jensen, Penetar, Prescot, Lukas and Renshaw2009; Petroff, Mattson, & Rothman, Reference Petroff, Mattson and Rothman2000; Shulman, Rothman, Behar, & Hyder, Reference Shulman, Rothman, Behar and Hyder2004). Physiological relevance of proton and phosphorous brain metabolites are provided in Table 1 and developmental 1H MRS findings are summarized in Table 2 and Figure 3.
Age spans investigated across all available 1H magnetic resonance spectroscopy studies of normative development. The ages in parentheses indicate the plateau of age effects.

1H MRS findings in healthy children and adolescents

Note: The subjects in all studies were healthy, normally developing individuals except where noted otherwise. The findings reflect healthy subjects only. MRS, Magnetic resonance spectroscopy; SV, single voxel; WM, white matter; NAA, N-acetylaspartate; Cho, choline; Cr, creatine; GM, gray matter; PCr, phosphocreatine; mI, myoinositol; CSI, chemical shift imaging; GLX, a combination of glutamate, glutamine, and γ-aminobutyric acid resonances; ACC, anterior cingulate cortex; POC, parieto-occipital cortex; GABA, γ-aminobutyric acid; Gln/Glu, glutamine/glutamate.
NAA contributes the largest signal in the proton spectrum at a chemical shift of 2.009 ppm. NAA is primarily found in mature neurons and has been viewed as an indicator of neuronal integrity (Birken & Oldendorf, Reference Birken and Oldendorf1989; Demougeot, Marie, Giroud, & Beley, Reference Demougeot, Marie, Giroud and Beley2004; Inglese et al., Reference Inglese, Rusinek, George, Babb, Grossman and Gonen2008; Moffett, Ross, Arun, Madhavarao, & Namboodiri, Reference Moffett, Ross, Arun, Madhavarao and Namboodiri2007; Pouwels & Frahm, Reference Pouwels and Frahm1997; Sullivan et al., Reference Sullivan, Adalsteinsson, Hedehus, Ju, Moseley and Lim2001). Across the published developmental 1H MRS studies, in vivo levels of NAA have most often been reported to increase with age, whether reported as a concentration or as a ratio relative to Cho, Cr, or the unsuppressed water signal (Costa, Lacerda, Garcia Otaduy, Cerri, & Da Costa Leite, Reference Costa, Lacerda, Garcia Otaduy, Cerri and Da Costa Leite2002; Grachev & Apkarian, Reference Grachev and Apkarian2000; Horska et al., Reference Horska, Kaufmann, Brant, Naidu, Harris and Barker2002; Hüppi et al., Reference Hüppi, Posse, Lazeyras, Burri, Bossi and Herschkowitz1991; Kadota, Horinouchi, & Kuroda, Reference Kadota, Horinouchi and Kuroda2001; Kreis, Ernst, & Ross, Reference Kreis, Ernst and Ross1993; Pouwels et al., Reference Pouwels, Brockmann, Kruse, Wilken, Wick and Hanefeld1999; van der Knaap et al., Reference van der Knaap, van der Grond, van Rijen, Faber, Valk and Willemse1990). NAA levels have been reported to increase most rapidly within the first few years of life and plateau anywhere from 2 to 30 years of age, depending on the region and tissue type studied. Two published studies, however, have failed to find any significant associations between NAA and age in samples spanning from 3 to 14 years (Choi, Ko, Lee, Lee, & Suh, Reference Choi, Ko, Lee, Lee and Suh2000) and from 6 to 18 years (Goldstein et al., Reference Goldstein, Panchalingam, McClure, Stanley, Calhoun and Pearlson2009), using moderate to large sample sizes. NAA has been most widely accepted as a biomarker of neuronal integrity, but it may also index neuronal density. Thus, early NAA increases with age may reflect the rapid changes in brain tissue volume occurring early in life. However, production of NAA also is related to energy metabolism, suggesting that developmental increases in NAA may also result from the global increases in glucose metabolism associated with brain maturation (Chugani, Reference Chugani1998).
In adults, NAA concentrations in a left occipito-parietal voxel have been found to correlate positively with a composite measure of neuropsychological performance (Jung, Yeo, Chiulli, Sibbitt Jr., & Brooks, Reference Jung, Yeo, Chiulli, Sibbitt and Brooks2000) and with full-scale IQ, as measured by the Wechsler Adult Intelligence Scale, Third Edition (Jung et al., Reference Jung, Haier, Yeo, Rowland, Petropoulos and Levine2005). A later study using CSI reported both a positive relationship between NAA values in right posterior gray matter and performance IQ and a negative correlation between NAA in right anterior gray matter and verbal IQ (Jung et al., Reference Jung, Gasparovic, Chavez, Caprihan, Barrow and Yeo2009). Pfleiderer et al. (Reference Pfleiderer, Ohrmann, Suslow, Wolgast, Gerlach and Heindel2004), however, found a positive relationship between vocabulary scores and NAA in the left dorsolateral PFC, though this effect only reached significance in women. Studies exploring metabolite–cognition relationships in healthy elderly populations have revealed positive relationships between NAA and NAA/Cr ratios and performance on tests of executive function, attention, processing speed, and memory (Charlton, McIntyre, Howe, Morris, & Markus, Reference Charlton, McIntyre, Howe, Morris and Markus2007; Ferguson et al., Reference Ferguson, MacLullich, Marshall, Deary, Starr and Seckl2002; Pfefferbaum, Adalsteinsson, Spielman, Sullivan, & Lim, Reference Pfefferbaum, Adalsteinsson, Spielman, Sullivan and Lim1999; Ross, Sachdev, Wen, Valenzuela, & Brodaty, Reference Ross, Sachdev, Wen, Valenzuela and Brodaty2005; Valenzuela et al., Reference Valenzuela, Sachdev, Wen, Shnier, Brodaty and Gillies2000). Several studies have also reported associations between NAA and cognitive functioning within normative pediatric samples. In a sample of healthy 10- to 18-year-olds (Gimenez et al., Reference Gimenez, Junque, Narberhaus, Caldu, Segarra and Vendrell2004), positive correlations were reported between measures of NAA/Cho in the left hippocampus and measures of both verbal and nonverbal learning and memory. Similarly, Yeo et al. (Reference Yeo, Hill, Campbell, Vigil and Brooks2000) reported positive relationships between NAA and performance on a two-back memory task in a sample of 7- to 12-year-olds. This study, however, found no relationship between NAA concentrations and a second memory measure: the Visual Temporal Order Memory Test. In contrast with earlier research (Jung et al., Reference Jung, Brooks, Yeo, Chiulli, Weers and Sibbitt1999), neither of these studies found a significant relationship between metabolite measures and general intelligence. In a third developmental study, a large sample of healthy individuals between 6 and 18 years of age were examined (Ozturk et al., Reference Ozturk, Degaonkar, Matson, Wells, Mahone and Horska2009). Along with increased NAA/Cr with age in both parietal gray matter and white matter, this study reported a relationship between the NAA/Cr ratio in the left frontal white matter and right-handed scores on the Perdue pegboard task of dexterity, while the same metabolite ratio in the right frontal white matter correlated with scores on a bead memory task. In a similarly aged sample (6–18 years), Goldstein et al. (Reference Goldstein, Panchalingam, McClure, Stanley, Calhoun and Pearlson2009) found a positive relationship between NAA levels and performance on a battery of visual–spatial construction tasks. Taken together, these studies suggest both an increase in neural integrity with age, as indexed by NAA, and a positive relationship between NAA concentrations and cognitive functioning in both children and adults.
The largest Cho signal resonates at 3.22 ppm and reflects a number of Cho-containing compounds, including free choline, phosphorylcholine, and glycerophosphocholine (Barker et al., Reference Barker, Breiter, Soher, Chatham, Forder and Samphilipo1994). Cho-containing compounds are involved in pathways of cellular membrane synthesis and degradation (Miller, Reference Miller1991; Pouwels & Frahm, Reference Pouwels and Frahm1998), with most of the Cho in the brain being membrane-bound as phosphatidylcholine, which is MR invisible (Miller, Reference Miller1991). Declines in measurable Cho are consistent with accelerated myelination, because nuclear magnetic resonance visible Cho residues become incorporated into MR-invisible macromolecules associated with myelin production. Developmental findings in childhood and adolescence with regard to Cho are inconsistent, with some studies reporting an age-related decrease in Cho (Pouwels et al., Reference Pouwels, Brockmann, Kruse, Wilken, Wick and Hanefeld1999; Toft, Christiansen, Pryds, Lou, & Henriksen, Reference Toft, Christiansen, Pryds, Lou and Henriksen1994; van der Knaap et al., Reference van der Knaap, van der Grond, van Rijen, Faber, Valk and Willemse1990), others reporting an age-related increase in Cho (Costa et al., Reference Costa, Lacerda, Garcia Otaduy, Cerri and Da Costa Leite2002; Kreis et al., Reference Kreis, Ernst and Ross1993), and some claiming no significant relationship between Cho levels and age (Raininko & Mattsson, Reference Raininko and Mattsson2010). These disparate results may be partly accounted for by differences between studies in voxel size and location. Looking at the ratio of NAA to Cho, a number of studies have found age-related increases, which may reflect both increases in NAA and decreases in Cho (Horska et al., Reference Horska, Kaufmann, Brant, Naidu, Harris and Barker2002; Kadota et al., Reference Kadota, Horinouchi and Kuroda2001; van der Knaap et al., Reference van der Knaap, van der Grond, van Rijen, Faber, Valk and Willemse1990). Not all studies, however, report developmental changes in this metric (Choi et al., Reference Choi, Ko, Lee, Lee and Suh2000; Costa et al., Reference Costa, Lacerda, Garcia Otaduy, Cerri and Da Costa Leite2002; Gimenez et al., Reference Gimenez, Junque, Narberhaus, Caldu, Segarra and Vendrell2004). MRS studies of developmental delay in children have reported reduced NAA and elevated Cho levels, thought to reflect delayed myelination (Fayed & Modrego, Reference Fayed and Modrego2005). Thus, simultaneous changes in NAA and Cho may reflect maturational processes critical to normative cognitive development. Consistent with these findings, in adults, Cho concentrations in a temporal voxel were found to be negatively correlated with performance on visual memory and digit span tasks (Buckley et al., Reference Buckley, Moore, Long, Larkin, Thompson and Mulvany1994). In contrast, however, a positive relationship between vocabulary scores and Cho in the left dorsolateral PFC has been reported (Pfleiderer et al., Reference Pfleiderer, Ohrmann, Suslow, Wolgast, Gerlach and Heindel2004). The conflicting results and lack of replication of MRS studies examining both developmental changes in measurable Cho and relationships between Cho concentrations and cognition make it difficult to draw firm conclusions regarding the roll of this metabolite in typical neurological and cognitive development at this time.
Singlet Cr resonances at 3.03 and 3.93 ppm arise from protons in Cr and phosphorylated Cr (PCr). Cr plays a major role in brain energy metabolism, acting both as an energy buffer, by maintaining constant brain ATP levels through the creatine kinase reaction, and by distributing energy (via mitochondria) within the brain (Kemp, Reference Kemp2000; Miller, Reference Miller1991). There is some evidence that developmental changes in Cr levels plateau by the second year of life (Kreis et al., Reference Kreis, Ernst and Ross1993; Pouwels et al., Reference Pouwels, Brockmann, Kruse, Wilken, Wick and Hanefeld1999), with the exception of a study documenting higher Cr levels when comparing infants to adolescents (Toft et al., Reference Toft, Christiansen, Pryds, Lou and Henriksen1994). However, the infants tested in this study were less than 1 year old, and thus the results do not preclude the possibility that the Cr changes observed between infancy and adolescence occurred by 2 years of age. In healthy adults, a positive relationship has been observed between temporal Cr levels and visual memory span performance (Buckley et al., Reference Buckley, Moore, Long, Larkin, Thompson and Mulvany1994). In a sample of 7- to 12-year-olds, a similarly positive relationship was observed between Cr and two-back memory task performance but not between Cr concentrations and a temporal order memory task (Yeo et al., Reference Yeo, Hill, Campbell, Vigil and Brooks2000). In elderly populations, however, Cr concentrations were found to correlate positively with increasing age and negatively with memory and executive function (Charlton et al., Reference Charlton, McIntyre, Howe, Morris and Markus2007; Ferguson et al., Reference Ferguson, MacLullich, Marshall, Deary, Starr and Seckl2002; Valenzuela et al., Reference Valenzuela, Sachdev, Wen, Shnier, Brodaty and Gillies2000). Thus, Cr increases may index metabolic changes both in the first 2 years of life and in old age. Furthermore, Cr concentrations show differing relationships with cognitive skills at different stages of development, suggesting a changing significance of this metabolic marker with age.
The most pronounced mI resonance occurs at 3.54 ppm. This compound is involved in the synthesis and turnover of phospholipid membranes, maintenance of osmotic equilibrium, and is a phosphorylated derivative in the synthesis of secondary messengers (Berridge & Irvine, Reference Berridge and Irvine1989; Brand, Richter-Landsberg, & Leibfritz, Reference Brand, Richter-Landsberg and Leibfritz1993; Downes & Macphee, Reference Downes and Macphee1990; Kim, McGrath, & Silverstone, Reference Kim, McGrath and Silverstone2005; Moore et al., Reference Moore, Breeze, Kukes, Rose, Dager and Cohen1999; Wolfson et al., Reference Wolfson, Bersudsky, Hertz, Berkin, Zinger and Hertz2000). Concentrations of mI have been reported to increase with age until reaching a plateau by age 2 (Kreis et al., Reference Kreis, Ernst and Ross1993). However, increases in mI have also been detected in early adulthood (Grachev & Apkarian, Reference Grachev and Apkarian2000) and across the life span (Raininko & Mattsson, Reference Raininko and Mattsson2010). Concentrations of mI, as measured via MRS, are yet to be linked to cognitive performance in pediatric or young adult populations. However, increases in the mI/Cr ratio have been observed in cases of mild cognitive impairment and Alzheimer disease in aging populations (Catani et al., Reference Catani, Cherubini, Howard, Tarducci, Pelliccioli and Piccirilli2001; Kantarci et al., Reference Kantarci, Smith, Ivnik, Petersen, Boeve and Knopman2002).
Lactate, or lactic acid, increases significantly when the brain is deprived of oxygen, or anaerobic respiration increases. Thus, lactate is an important metabolic marker. The lactate resonance is a doublet at 1.33 ppm, which is obscured by a resonance arising from lipids (Auer, Gossl, Schirmer, & Czisch, Reference Auer, Gossl, Schirmer and Czisch2001; Behar, Rothman, Spencer, & Petroff, Reference Behar, Rothman, Spencer and Petroff1994), but this can be reliably resolved when a long TE is employed (Behar et al., Reference Behar, Rothman, Spencer and Petroff1994). To date, no age- or cognition-related changes have been associated with lactate concentrations in healthy children or adolescents. An age-related increase in lactate has, however, been reported in a young adult sample (19–31 years), when data were averaged across multiple voxels (Grachev & Apkarian, Reference Grachev and Apkarian2000).
Gln, Glu, and GABA all play multiple critical roles in neurological functioning. Gln serves as a precursor for Glu, which is a major excitatory neurotransmitter found in all brain cell types, with the highest concentrations typically observed in neurons. GABA is the major inhibitory neurotransmitter found in the mammalian brain (McCormick, Reference McCormick1989). Gln, Glu, and GABA also play important roles in glucose metabolism, neuronal energetics, and ammonia detoxification (Behar & Rothman, Reference Behar and Rothman2001; Patel et al., Reference Patel, de Graaf, Mason, Rothman, Shulman and Behar2005). While brain Glu is present at much higher concentrations than GABA, only a small fraction of Glu participates in neurotransmission. These metabolites each consist of multiple peaks that have strong spectral overlap, and thus are obscured by peaks of higher concentrations, such as Cr. For instance, GABA resonates at three chemical shift positions, triplet peaks at 2.31 and 3.01 ppm, and a quintet at 1.91 ppm. Glu also consists of a number of multiplet peaks, although the majority of the Glu signal is observed at 2.35 ppm. Because there is considerable overlap of Gln and Glu, predominantly around 3.75 ppm, a combined GLX resonance intensity is often reported, particularly when spectra are acquired at low field strength (1.5 T). For example, higher GLX concentrations have been reported to predict inferior global cognitive functioning in patients with Type 1 diabetes (Lyoo et al., Reference Lyoo, Yoon, Musen, Simonson, Weinger and Bolo2009). Recently, increasing availability of high-field MR scanners and specialized editing techniques have enhanced MR visibility of these metabolites by facilitating separation of resonances, allowing more accurate quantification of individual Glu, Gln, and GABA resonances (Jensen et al., Reference Jensen, Licata, Ongur, Friedman, Prescot and Henry2009; Keltner, Wald, Frederick, & Renshaw, Reference Keltner, Wald, Frederick and Renshaw1997; Mescher, Merkle, Kirsch, Garwood, & Gruetter, Reference Mescher, Merkle, Kirsch, Garwood and Gruetter1998; Weber, Trabesinger, Duc, Meier, & Boesiger, Reference Weber, Trabesinger, Duc, Meier and Boesiger1997). One such study found increased GABA in the frontal eye fields predicted diminished impact of distractors on directed visual saccades in healthy adults (Sumner, Edden, Bompas, Evans, & Singh, Reference Sumner, Edden, Bompas, Evans and Singh2010). Furthermore, in an all-male adult sample, higher GABA concentrations in the left dorsolateral PFC were found to correlate with lower self-report based scores of rash impulsivity (Boy et al., Reference Boy, Evans, Edden, Lawrence, Singh and Husain2011). Higher Glu in the medial PFC was found to be associated with poorer performance on a continuous performance task in an adult sample including both the healthy siblings of patients with schizophrenia and healthy control subjects (Purdon, Valiakalayil, Hanstock, Seres, & Tibbo, Reference Purdon, Valiakalayil, Hanstock, Seres and Tibbo2008). In a study of young adults, GABA, Glu, and Gln were all found to be higher in a 21- to 31-year-old group when compared to a 19- to 20-year-old group (Grachev & Apkarian, Reference Grachev and Apkarian2000). Our preliminary study (Silveri et al., Reference Silveri, Crowley, Covell, Acharya, Sneider and Rosso2013) provides the first in vivo human brain evidence of lower GABA/Cr in adolescence relative to adulthood, measured at 4 T, in 30 healthy adolescents relative to 20 emerging adults in the anterior cingulate cortex (ACC) but not in a control region (parieto-occipital cortex). Higher ACC GABA significantly predicted better accuracy on the No Go trials of a Go/No Go task and lower overall Barratt Impulsiveness Scale trait impulsivity. Given this developmental increase in ACC GABA observed during adolescence, and the predictive nature of brain GABA levels on response inhibition, motor control, and impulsivity (Boy et al., Reference Boy, Evans, Edden, Singh, Husain and Sumner2010, Reference Boy, Evans, Edden, Lawrence, Singh and Husain2011; Silveri et al., Reference Silveri, Crowley, Covell, Acharya, Sneider and Rosso2013), further characterization of brain metabolites and potential links to alcohol abuse disorders in adolescence is warranted.
In a young adult sample (19–31 years of age), Grachev and Apkerian (Reference Grachev and Apkarian2000) detected elevated NAA in females relative to males in sensorimotor cortex and higher lactate in males relative to females in the dorsolateral PFC. To date, no published studies explore sex differences in 1H metabolites in healthy children or adolescents. Using 1H MRS to explore neurochemical changes paralleling the sexual differentiation that occurs in the neuroendocrine system during puberty may prove to be a particularly fruitful area of study. Increased sexual dimorphism during this period may also result in divergent cognition–metabolite relationships in men and women. Exploring such relationships may provide key insights into sex differences in emotion and reward processing that emerge during this period.
Development and cognition: 31P MRS findings
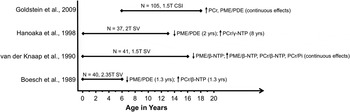
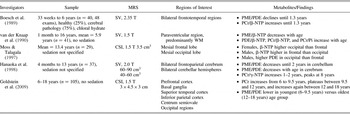
In vivo 31P MRS permits the detection of high-energy phosphate metabolites and constituents of membrane synthesis, which reflect cellular bioenergetic state, and cell membrane integrity and function, respectively (Table 1). Phospholipid metabolites associated with high-energy intracellular metabolism that are detectable include PCr, inorganic phosphate (Pi), and β-NTP, primarily reflecting ATP in the brain. Components of cell membranes detectable with 31P MRS include PME and PDE (see Figure 2 for a sample 31P spectrum). For 31P MRS, the chemical shift of each metabolite is referenced relative to PCr, which is used as an internal standard. Physiological relevance of each phosphorous metabolite is listed in Table 1, and developmental 31P MRS studies are summarized in Table 3 and Figure 4.
Age spans investigated across all available 31P magnetic resonance spectroscopy studies of normative development. The ages in parentheses indicate the plateau of age effects.

31P MRS findings in healthy children and adolescent

Note: The subjects in all studies were healthy, normally developing individuals except where noted otherwise. The findings reflect healthy subjects only. MRS, Magnetic resonance spectroscopy; SV, single voxel; PME/PDE, phosphomonoesters/phosphodiesters; PCr, phosphocreatine; β-NTP, β-nucleoside triphosphate; WM, white matter; Pi, inorganic phosphate; CSI, chemical shift imaging; γ-NTP, γ-nucleoside triphosphate.
High-energy PCr serves as a buffer for maintenance of β-NTP levels and shuttles energy from sites of production to sites of utilization (Bessman & Geiger, Reference Bessman and Geiger1981; Wallimann, Wyss, Brdiczka, Nicolay, & Eppenberger, Reference Wallimann, Wyss, Brdiczka, Nicolay and Eppenberger1992). Thus, availability of PCr stimulates the production of β-NTP via conversion to Cr and high-energy phosphate (Wallimann et al., Reference Wallimann, Wyss, Brdiczka, Nicolay and Eppenberger1992). This process results in a reduction of PCr levels, while the levels of adenosine diphosphate and Pi increase to support maintenance of β-NTP levels (Gyulai, Roth, Leigh Jr., & Chance, Reference Gyulai, Roth, Leigh and Chance1985). The ratio of PCr relative to Pi, therefore, is thought to reflect phosphorylation potential, or available energy within a cell (Nioka et al., Reference Nioka, Smith, Chance, Subramanian, Butler and Katzenberg1990). The chemical shift of Pi can also be used to calculate internal pH level, which serves to modulate synaptic transmission and plasticity, and neuronal excitability, and can aid in the discrimination between diseased and healthy tissue (de Graaf, Reference de Graaf2002). In general, the ratio of PCr to both β-NTP and γ-NTP increases most rapidly within the first few years of life and then increases more gradually, reaching a plateau around age 8 (Boesch, Gruetter, Martin, Duc, & Wuthrich, Reference Boesch, Gruetter, Martin, Duc and Wuthrich1989; Hanaoka, Takashima, & Morooka, Reference Hanaoka, Takashima and Morooka1998; van der Knaap et al., Reference van der Knaap, van der Grond, van Rijen, Faber, Valk and Willemse1990). More recent work, however, suggests that PCr values may level off in late childhood and early adolescence, with the positive relationship between PCr and age once again becoming significant between 12 and 18 years of age (Goldstein et al., Reference Goldstein, Panchalingam, McClure, Stanley, Calhoun and Pearlson2009). Therefore, it has been posited that increases in cellular energy stores enable synaptic remodeling, an energetically demanding process. Goldstein et al. (Reference Goldstein, Panchalingam, McClure, Stanley, Calhoun and Pearlson2009) also reported positive relationships between PCr levels and age-related improvements in composite measures of language abilities, visuospatial construction, and memory, but not executive functioning. In contrast to these findings in adolescents, Voltz et al. (Reference Volz, Hübner, Rzanny, Rößger, Preußler and Eichhorn1998) found a negative relationship between energy cycling, indicated as PCr/ATP, and executive function performance, measured via the Wisconsin Card Sorting Test, in healthy adults. Taken together, these findings suggest a changing relationship between energy cycling and executive functioning skills, with developmental changes likely reflecting a change over to increased neuronal efficiency (Casey et al., Reference Casey, Jones and Hare2008; Durston et al., Reference Durston, Davidson, Tottenham, Galvan, Spicer and Fossella2006), which requires fewer energy resources, such as PCr and β-NTP, for the individual to perform at a higher level. This represents a maturational change from the more diffuse activation typically observed during performance of higher order cognitive functions during childhood and early adolescence, where PCr levels are not directly coupled to executive functioning abilities.
Components of cell membranes detectable with 31P MRS include PME and PDE. The PME resonance arises primarily from phospholipid membrane precursors (Pettegrew et al., Reference Pettegrew, Keshavan, Panchalingam, Strychor, Kaplan and Tretta1991), while the PDE resonance arises from the presence of phospholipid catabolites. Therefore, the PME peak reflects membrane synthesis and the PDE peak reflects products of membrane breakdown, while the ratio of PME/PDE indexes membrane phospholipid turnover. At a high field (4.0 T and higher), subpeaks within the PME peak can be further quantified into phosphoethanolamine and phosphocholine anabolites, and in the PDE peak, glycerophosphoethanolamine and glycerolphosphocholine catabolites, allowing more precise quantification of metabolites and reflecting concurrent changes in the biophysical state of membrane phospholipids. A decline in the ratio of PME/PDE has been observed with age, until approximately 2 years of age, in both the cerebrum and the cerebellum (Boesch et al., Reference Boesch, Gruetter, Martin, Duc and Wuthrich1989; Hanaoka et al., Reference Hanaoka, Takashima and Morooka1998; van der Knaap et al., Reference van der Knaap, van der Grond, van Rijen, Faber, Valk and Willemse1990). Significant reductions in PME/PDE with age have also been observed between childhood and adolescence (Goldstein et al., Reference Goldstein, Panchalingam, McClure, Stanley, Calhoun and Pearlson2009). Although these age-related changes in the ratio of PME/PDE may reflect changing rates of membrane synthesis and degradation, likely associated with developmental profiles of pruning and myelination, decreases in PME may also be due in part to the incorporation of membrane precursors into larger membrane macromolecules (e.g., synaptic receptors composed of large protein structures), which are largely MR invisible.
From the limited data on sex differences in 31P metabolites during childhood and adolescence, males do not appear to differ from females in terms of overall age-related changes in metabolite levels. However, sex differences in the regional distributions of metabolites have been reported during this age period in a single study (Moss & Talagala, Reference Moss and Talagala1997). Higher β-NTP has been observed in frontal versus occipital regions in males, whereas females exhibit higher β-NTP in the occipital region relative to the frontal regions. Furthermore, males demonstrate higher PDE levels in the occipital region than the frontal region (Moss & Talagala, Reference Moss and Talagala1997). Sex differences in 31P metabolites may therefore reflect the well-documented sex differences in structural and functional brain changes during childhood and adolescence, as well as the cognitive differences between males and females. For example, the more rapid increase in white matter in males versus females and an earlier peak in gray matter volume in females versus males may be reflected in differential neurometabolite profiles. Thus, sex differences in the timing of structural brain changes may result in variable energy demands and rates of membrane turnover in various brain regions, affecting the concentrations of β-NTP and PDE, respectively. Further research is needed to explore this possibility.
MRS in Alcohol and Substance Abuse and Dependence
Risk taking is a key feature of adolescence, which includes experimentation with alcohol and drugs. Prevalence of alcohol use increases from 2.6% at age 12 to 67.5% at age 21 (SAMHSA, 2004). Quantity of alcohol consumed likewise increases during adolescence, sometimes reaching binge-like levels. A study of risk-taking behaviors among US teenagers found that 25.5% of all students had drunk more than five drinks on one occasion (i.e., a binge episode) during the previous month (Eaton et al., Reference Eaton, Kann, Kinchen, Ross, Hawkins and Harris2006). Both heavy episodic use and early initiation of alcohol use are associated with higher rates of abuse and dependence (Grant & Dawson, Reference Grant and Dawson1997; Nigg et al., Reference Nigg, Wong, Martel, Jester, Puttler and Glass2006). It is clear that the onset of drinking during adolescence raises a serious public health concern, because it increases dangerous risk-taking behaviors already potentiated by adolescent brain development and can have a negative impact on neurological development during an important period of brain reorganization.
Cognitive alterations are frequently reported in association with alcohol abuse and dependence in adult populations (Oscar-Berman, Reference Oscar-Berman1990, Reference Oscar-Berman, Noronha Eckardt and Warren2000; Oscar-Berman & Marinkovic, Reference Oscar-Berman and Marinkovic2003; Parsons & Nixon, Reference Parsons and Nixon1998). MR studies have documented a wide variety of associated neurobiological changes, which highlight the frontal lobe and hippocampus as being the most compromised by chronic alcohol use in adult cohorts (Harris et al., Reference Harris, Jaffin, Hodge, Kennedy, Caviness and Marinkovic2008; Oscar-Berman & Marinkovic, Reference Oscar-Berman and Marinkovic2007; Paulus, Tapert, Pulido, & Schuckit, Reference Paulus, Tapert, Pulido and Schuckit2006; Pfefferbaum, Sullivan, Mathalon, & Lim, Reference Pfefferbaum, Sullivan, Mathalon and Lim1997; Sullivan & Pfefferbaum, Reference Sullivan and Pfefferbaum2005). More recently, a growing body of literature has likewise demonstrated alterations in brain structure and function in frontal networks and the hippocampus in adolescents and young adults with alcohol use disorders (DeBellis et al., Reference DeBellis, Clark, Beers, Soloff, Boring and Hall2000; Tapert et al., Reference Tapert, Brown, Kindermann, Cheung, Frank and Brown2001; Tapert, Pulido, Paulus, Schuckit, & Burke, Reference Tapert, Pulido, Paulus, Schuckit and Burke2004; Tapert, Schweinsburg, et al., Reference Tapert, Schweinsburg, Barlett, Brown, Frank and Brown2004) and those reporting binge alcohol consumption (McQueeny et al., Reference McQueeny, Schweinsburg, Schweinsburg, Jacobus, Bava and Frank2009; Schweinsburg, McQueeny, Nagel, Eyler, & Tapert, Reference Schweinsburg, McQueeny, Nagel, Eyler and Tapert2010; Squeglia, Schweinsburg, Pulido, & Tapert, Reference Squeglia, Schweinsburg, Pulido and Tapert2011), as well as those who have not yet begun to drink alcohol but who are family history positive for alcoholism (Hill et al., Reference Hill, Wang, Kostelnik, Carter, Holmes and McDermott2009; Silveri, Rogowska, McCaffrey, & Yurgelun-Todd, Reference Silveri, Rogowska, McCaffrey and Yurgelun-Todd2011; Spadoni, Norman, Schweinsburg, & Tapert, Reference Spadoni, Norman, Schweinsburg and Tapert2008).
Although no studies to date have used MRS to investigate the consequences of alcohol use on neurochemistry during adolescence, numerous MRS studies conducted in adult cohorts have demonstrated abnormalities in brain metabolites associated with alcohol use, abuse, and dependence. In the majority of these published MRS studies, which have largely been confined to recently detoxified alcoholic adult males (>35 years old), substantial evidence for reductions in NAA and Cho, mostly in frontal lobe regions of interest, has been reported (for a comprehensive review and table of MRS studies in alcohol abusing and dependent populations, see Meyerhoff, Durazzo, & Ende, Reference Meyerhoff, Durazzo and Ende2011). There is less evidence of abnormalities in Cr and mI associated with chronic alcohol use, although when reported, decreased Cr likely reflects altered cell bioenergetics and elevated mI reflects proliferation of glial cells (Meyerhoff et al., Reference Meyerhoff, Durazzo and Ende2011). Alterations in metabolite levels have been observed during acute abstinence, with recovery of metabolite levels increasing with length of alcohol abstinence in dependent populations that exhibit physiologic withdrawal (Meyerhoff et al., Reference Meyerhoff, Durazzo and Ende2011). Recovery of brain metabolites is predictive of restoration of cognitive functioning, underscoring the dual utility of MRS, to capture the impact of alcohol use on brain chemistry and to identify neurochemical correlates associated with recovery.
There have been fewer MRS studies that have quantified GABA and Glu metabolite levels in heavy alcohol-using adult populations, which is extremely relevant given that these compounds are central targets of alcohol action and that heavy alcohol use, dependence, and withdrawal have been shown to be associated with neurobiological alterations in GABAergic and glutamatergic systems (Krupitsky et al., Reference Krupitsky, Rudenko, Burakov, Slavina, Grinenko and Pittman2007; Krystal, Petrakis, Limoncelli, et al., Reference Krystal, Petrakis, Limoncelli, Webb, Gueorgueva and D'Souza2003; Krystal, Petrakis, Mason, Trevisan, & D'Souza, Reference Krystal, Petrakis, Mason, Trevisan and D'Souza2003; Krystal et al., Reference Krystal, Staley, Mason, Petrakis, Kaufman and Harris2006; Tsai & Coyle, Reference Tsai and Coyle1998). Of the limited studies available, relative to healthy comparison subjects, detoxified alcoholics exhibited significantly lower occipital GABA levels, which was negatively correlated with impaired verbal recall (Behar et al., Reference Behar, Rothman, Petersen, Hooten, Delaney and Petroff1999). More recent studies have reported no significant group differences in ACC or occipital GABA in alcohol-dependent patients studied early in abstinence (Abe et al., Reference Abe, Mon, Durazzo, Pennington, Schmidt and Meyerhoff2012; Mason et al., Reference Mason, Petrakis, de Graaf, Gueorguieva, Guidone and Coric2006; Mon, Durazzo, & Meyerhoff), although smoking history emerged as an important mediator of metabolite changes (Mason et al., Reference Mason, Petrakis, de Graaf, Gueorguieva, Guidone and Coric2006). In a study of young adult social alcohol drinkers, a 13% ± 8% reduction in occipital GABA was observed after an acute alcohol infusion, which is consistent with facilitation of the GABAA receptor by alcohol (Gomez et al., Reference Gomez, Behar, Watzl, Weinzimer, Gulanski and Sanacora2011).
In stark contrast, only one study to date has used MRS to explore the neurochemical predictors of risk for substance abuse in adolescents. Moss, Talagala, and Kirisci (Reference Moss, Talagala and Kirisci1997) used 31P spectroscopic imaging to study a sample of peripubertal children (mean age = 12.5 years) at varying degrees of risk for developing a substance use disorder. Subjects in this study were split into three groups: adolescents with a paternal history of substance use disorder and a personal diagnosis of disruptive behavior disorder, adolescents with a paternal history of substance use disorder but no personal history of disruptive behavior disorder, and adolescents with no paternal history and no disruptive disorders (a healthy comparison group). The first group, predicted to be at highest risk of developing substance use problems, was found to have significantly lower PDE in the right parietal cortex when compared to the low-risk control subjects. Furthermore, PDE in this brain region correlated positively with the information scale score of the Wechsler Intelligence Scale for Children, Third Edition, in only the highest risk group. It was speculated that the difference in PDE concentrations could reflect heightened synaptic pruning or decreased activity-dependent synaptogenesis in the right parietal cortex, consequently influencing information-retrieval abilities. The group possessing only a single risk factor of family history of substance abuse did not differ significantly from either of the other two groups for any metabolite measure, and no effects of age were observed. A significant main effect of sex for PCr levels did emerge, with females exhibiting lower levels than males across brain regions and risk groups, a result that may reflect differences in white and gray matter proportions within the regions studied (Moss et al., Reference Moss, Talagala and Kirisci1997). Females also had lower frontal β-NTP levels than males, but higher β-NTP concentrations overall, mirroring findings from a separate study by the same group in older subjects (Moss et al., Reference Moss, Talagala and Kirisci1997).
There have been 32 MRS studies published investigating alcohol-related neurochemical consequences in alcohol abusing and dependent adult populations (see Meyerhoff et al. Reference Meyerhoff, Durazzo and Ende2011), but no studies have been published to date that have examined neurochemistry using MRS in adolescents with either significant alcohol use histories or alcohol use disorders. The metabolites detected as abnormal in adult patients with alcohol abuse disorders overlap with metabolites that demonstrate maturational changes during healthy adolescence (e.g., NAA, Cho, Cr, and GABA). Furthermore, metabolite alterations observed in alcohol abuse cohorts occur widely in the frontal lobe, which is in line with other neuroimaging results demonstrating that this late-maturing brain region is particularly susceptible to alcohol effects. Given the impact of alcohol use and abuse observed across multiple domains of cognitive functioning in adults, the paucity of MRS studies investigating neurochemical correlates of adolescent alcohol use further highlights the critical need for research in this area.
Conclusions and future directions
Structural, functional, and neurochemical maturation in the healthy adolescent brain occurs in regions and in cognitive domains that overlap with those observed to be most vulnerable to alcohol abuse and dependence. While a substantial body of neuroimaging research exploring the impact of alcohol on the structure and functional activation of the adolescent brain exists, less is known about neurochemical changes occurring in the human adolescent brain that are associated with healthy development or that are associated with adolescent alcohol use. Recent advances have made MRS technology more amenable to the study of pediatric populations, offering promise for understanding typical brain neurochemical development and maladaptive developmental trajectories associated with the manifestation of alcohol disorders or other adolescent psychopathologies.
Developmental characterization of neurochemistry via MRS during adolescence could yield mechanistic hypotheses regarding the neurobiological consequences of alcohol use, as well as the propensity for future, continued and heavy alcohol use. For example, animal models suggest that reduced GABA in prefrontal control regions in adolescents versus adults may reduce the sedative effects of alcohol, allowing for longer and heavier bouts of drinking (Silveri & Spear, Reference Silveri and Spear2004), which is consistent with developmental changes in GABA concentrations measured in the frontal regions of human adolescents (Silveri et al., Reference Silveri, Crowley, Covell, Acharya, Sneider and Rosso2013). In addition, lower prefrontal concentrations of NAA have been reported not only in children and adolescents compared to adults (Costa et al., Reference Costa, Lacerda, Garcia Otaduy, Cerri and Da Costa Leite2002; Horska et al., Reference Horska, Kaufmann, Brant, Naidu, Harris and Barker2002; Kadota et al., Reference Kadota, Horinouchi and Kuroda2001) but also in recently detoxified alcoholics relative to healthy controls (Meyerhoff et al., Reference Meyerhoff, Durazzo and Ende2011), suggesting that alcohol use during adolescence may present a double threat to neuronal integrity and volume in the prefrontal regions critical to self-regulation. Given that PCr concentrations have been reported to increase with age (Goldstein et al., Reference Goldstein, Panchalingam, McClure, Stanley, Calhoun and Pearlson2009), the developing adolescent brain may be more susceptible to alcohol effects on this important high-energy resource pool, leading to deleterious alterations in brain function. Moreover, MRS can be integrated with other imaging techniques and behavioral assessments to provide an additional level of analysis and construct a more comprehensive profile of brain development. This profile would provide a foundation for quantifying the effects of alcohol use on the adolescent brain and for the development of biomarkers that could help identify adolescents at risk for initiating and escalating alcohol consumption, even before they start drinking.
For the majority of the currently published developmental studies using MRS, the sparse distribution of sampling from different age groups makes results difficult to interpret. Larger samples and longitudinal studies are needed to map the time course of age-related metabolite changes associated with structural and functional brain development (Figures 3 and 4), as well as with cognitive and behavioral changes during adolescence. Furthermore, the majority of existing pediatric MRS studies were conducted at a relatively low field strength (1.5 T), which limits the number of proton- and phosphorous-containing metabolites that can be detected and reliably quantified. Significant future advances in understanding pediatric neurochemical development will depend on a number of factors: increased uniformity in protocols across studies and sites (improving feasibility and reliability in multisite studies); inclusion of large sample sizes to achieve statistical power to detect significant group differences; and collection of longitudinal data sets. It also will be important to consider the influence of sex differences and brain laterality on metabolite levels. The measurement of additional nuclei (e.g., 13C and 19F) and the integration of metabolite data with data from other MR imaging modalities, such as brain tissue volumes (MRI), indices of white matter microstructure integrity (diffusion tensor imaging), and neuronal activation (fMRI), will provide a more comprehensive understanding of neurochemical brain development.
Taken together, MRS studies of adolescent populations hold promise for advancing developmental neuroscience by identifying the biochemical signatures associated with healthy brain development, as well as neurobiological predictors and consequences of alcohol use and abuse. Given the paucity of extant developmental MRS data, a better characterization of healthy neurochemical development is needed to identify potential risk factors for the manifestation of alcohol and substance abuse disorders, which can also be applied to better understand neurobiological alterations associated with a number co-occurring psychopathological conditions that often emerge during adolescence. Thus, the continued evolution of MRS is expected to contribute to our understanding of pathophysiology, mechanisms of treatment response, and ultimately to contribute to advances in treatment development in both low- and high-risk adolescent populations.