INTRODUCTION
Bivalve dredge fishing and manual harvesting constitute ancient activities and play relevant socio-economic roles in the Algarve coast (southern Portugal). Due to its local importance, annual fishing campaigns are performed by the Portuguese Institute for the Sea and Atmosphere (IPMA, I.P.), aiming to assess the exploitation status of the bivalve populations and propose fishery management measures. The southern Portuguese coast is characterized by highly diverse molluscan fauna, with about 250 bivalve species reported for the Algarve coast (Afonso, Reference Afonso and Borges2007), therefore those fishing surveys provide a unique opportunity to collect, sample and analyse a large quantity and wide variety of bivalves with broad size ranges, caught along an extensive coastal area and within a considerable depth range.
Bivalve species from the Algarve coast have been subject to several studies covering many different subjects (e.g. fishery, farming, population dynamics, general biology and ecology, genetics). In contrast, studies on bivalve morphometric relationships and relative growth are much scarcer and limited to commercial and/or most common species (e.g. Gaspar et al., Reference Gaspar, Santos and Vasconcelos2001a, Reference Gaspar, Santos, Vasconcelos and Monteiro2002a). Compilations of species morphometric data (relationships and indices) are relatively common for fishes (e.g. Petrakis & Stergiou, Reference Petrakis and Stergiou1995; Gonçalves et al., Reference Gonçalves, Bentes, Lino, Ribeiro, Canário and Erzini1997; Morato et al., Reference Morato, Afonso, Lourinho, Barreiros, Santos and Nash2001; Santos et al., Reference Santos, Gaspar, Vasconcelos and Monteiro2002, Reference Santos, Canas, Lino and Monteiro2006; Stergiou & Karpouzi, Reference Stergiou and Karpouzi2003; Oliveira et al., Reference Oliveira, Santos, Coelho, Monteiro, Martins and Lino2015; Rodriguez-Marin et al., Reference Rodriguez-Marin, Ortiz, Ortiz de Urbina, Quelle, Walter, Abid, Addis, Alot, Andrushchenko, Deguara, Di Natale, Gatt, Golet, Karakulak, Kimoto, Macias, Saber, Santos and Zarrad2015) but much less frequent for benthic invertebrates (Robinson et al., Reference Robinson, Greenstreet, Reiss, Callaway, Craeymeersch, De Boois, Degraer, Ehrich, Fraser, Goffin, Kröncke, Lindal Jorgenson, Robertson and Lancaster2010; Mutlu, Reference Mutlu2013), namely for bivalves (Gaspar et al., Reference Gaspar, Santos and Vasconcelos2001a, Reference Gaspar, Santos, Vasconcelos and Monteiro2002a; Park & Oh, Reference Park and Oh2002; Powell et al., Reference Powell, Mann, Ashton-Alcox, Kim and Bushek2016) and for gastropods (Vasconcelos et al., Reference Vasconcelos, Barroso and Gaspar2016). However, confirming their usefulness and multiple practical applications, studies providing compilations of morphometric data are frequently consulted and highly cited by the research community, as revealed by accessing diverse databases of scientific literature available online (e.g. Web of Science, Scopus, ORCID, ResearcherID, ResearchGate or Google Scholar).
Studies on mollusc shell morphology and its morphometric relationships are performed for diverse purposes, including detailed description of the shell, taxonomic identification, inter-specific comparisons, distinction between populations and analysis of sexual dimorphism. The establishment of morphometric relationships allows obtaining conversion equations relating different morphometric variables, which are used for improving the selectivity of bivalve dredges and the technical design of bivalve sorting equipment installed on board commercial fishing boats (Gaspar et al., Reference Gaspar, Santos, Vasconcelos and Monteiro2002a). Moreover, morphometric relationships are frequently used in size-based analyses of communities and monitoring of stocks (Robinson et al., Reference Robinson, Greenstreet, Reiss, Callaway, Craeymeersch, De Boois, Degraer, Ehrich, Fraser, Goffin, Kröncke, Lindal Jorgenson, Robertson and Lancaster2010), namely for application in mathematical models used in fisheries biology and ecology, population dynamics, fisheries assessment and management.
In particular, weight-length relationships have several uses, namely the estimation of weight from individual length and from size classes, conversion of growth-in-length equations into growth-in-weight for prediction of weight-at-age and subsequent use in stock assessment models, estimation of population production and biomass (standing-crop biomass by means of the length-frequency distribution), calculation of condition indices and following seasonal variations in growth, physiology studies, life history and morphological comparisons between species or populations from different habitats and/or regions (e.g. Ricker, Reference Ricker1973; Eagar, Reference Eagar1978; Seed, Reference Seed, Rhoads and Lutz1980; Anderson & Gutreuter, Reference Anderson, Gutreuter, Nielsen and Johnson1983; Beyer, Reference Beyer1991; Pauly, Reference Pauly1993; Richter et al., Reference Richter, Luckstadt, Focken and Becker2000).
In this context, following the publication of previous studies reporting weight-length and shell morphometric relationships of most common bivalves from the Algarve coast (Gaspar et al., Reference Gaspar, Santos and Vasconcelos2001a, Reference Gaspar, Santos, Vasconcelos and Monteiro2002a), the present study established morphometric relationships (between shell length, height, width and total weight), calculated morphometric indices (elongation, compactness, convexity and density) and analysed relative growth (isometry vs allometry) in 20 uncommon bivalve species collected during several fishing surveys using bivalve dredges along the Algarve coast (southern Portugal).
MATERIALS AND METHODS
Study area and fishing surveys
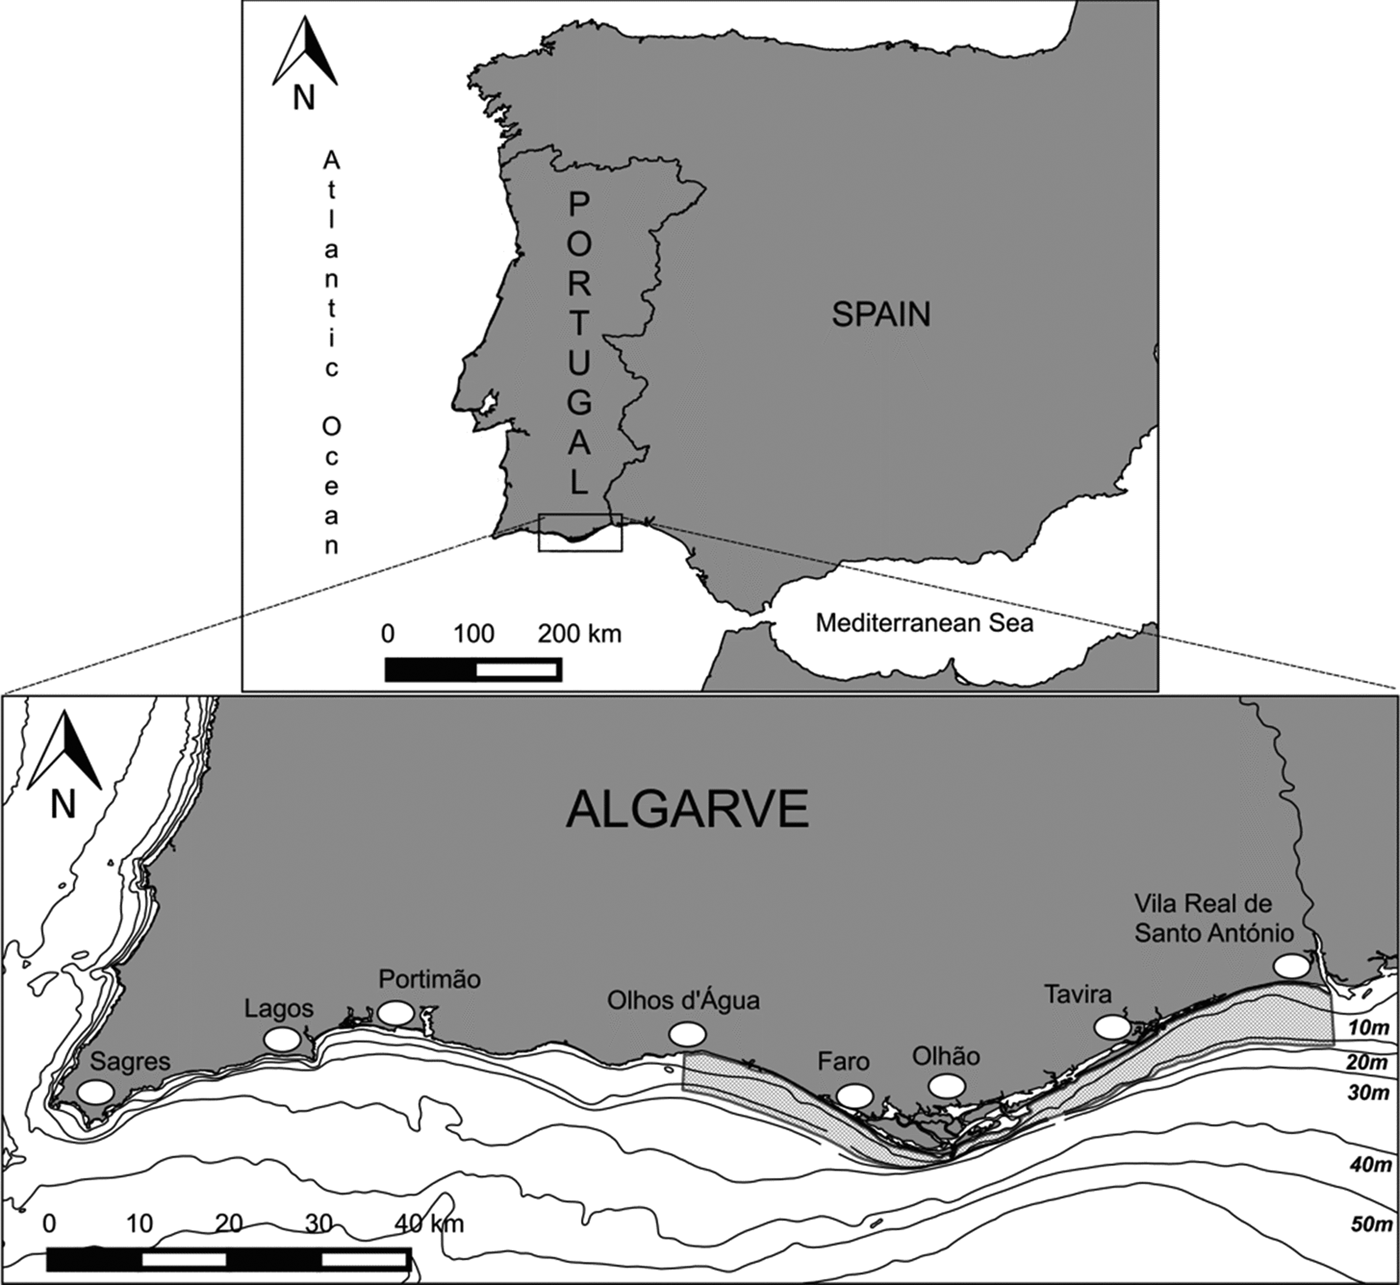
Sampling was performed along the Algarve coast (southern Portugal), between Vila Real de Santo António (right margin of the river Guadiana, Portuguese-Spanish southern border ≈−7.4°W) and Olhos d’Água (≈−8.9°W) (Figure 1). Individuals were collected during several bivalve fishing surveys (years ≈ 2000–2015) carried out annually by the Portuguese Institute for the Sea and Atmosphere (IPMA, I.P.) on board the research vessel ‘NI Diplodus’. Fishing surveys covered subtidal soft bottoms (≈3–25 m depth) along more than 150 km of coastline, comprising over 250 sampling stations distributed in transects perpendicular to the seashore (corresponding to more than 500 dredge hauls).
Map of the Algarve coast (southern Portugal) showing the subtidal soft bottoms (≈3–25 m depth) where bivalve species were collected by dredging (grey shadow area) during the annual bivalve fishing surveys performed by IPMA.

Samples were collected using two types of bivalve dredges (clam and razor clam dredges) that dig at different depths into bottom sediments and have distinct species- and size-selectivity. Dredges were towed simultaneously and side-by-side for 5 min at a constant speed of 1–2 knots, each dredge sweeping an area of ~150 m2 in every haul (for further details on the bivalve dredges' design and technical specifications see Gaspar et al., Reference Gaspar, Castro and Monteiro1999, Reference Gaspar, Dias, Campos, Monteiro, Santos, Chícharo and Chícharo2001b, Reference Gaspar, Leitão, Santos, Sobral, Chícharo, Chícharo and Monteiro2002b, Reference Gaspar, Leitão, Santos, Sobral, Chícharo, Chícharo and Monteiro2003a, Reference Gaspar, Leitão, Santos, Chícharo, Dias, Chícharo and Monteirob). Once on board, the bivalve catches were kept in identified plastic bags and preserved in ice until subsequent laboratory procedures.
Species identification and biological sampling
In the laboratory, bivalve species were identified using a combination of diverse external and/or internal shell features, following specialized literature (Tebble, Reference Tebble1966; Poppe & Goto, Reference Poppe and Goto1993; Macedo et al., Reference Macedo, Macedo and Borges1999) and adopting the most recent taxonomic nomenclature available in the World Register of Marine Species – WoRMS (http://www.marinespecies.org).
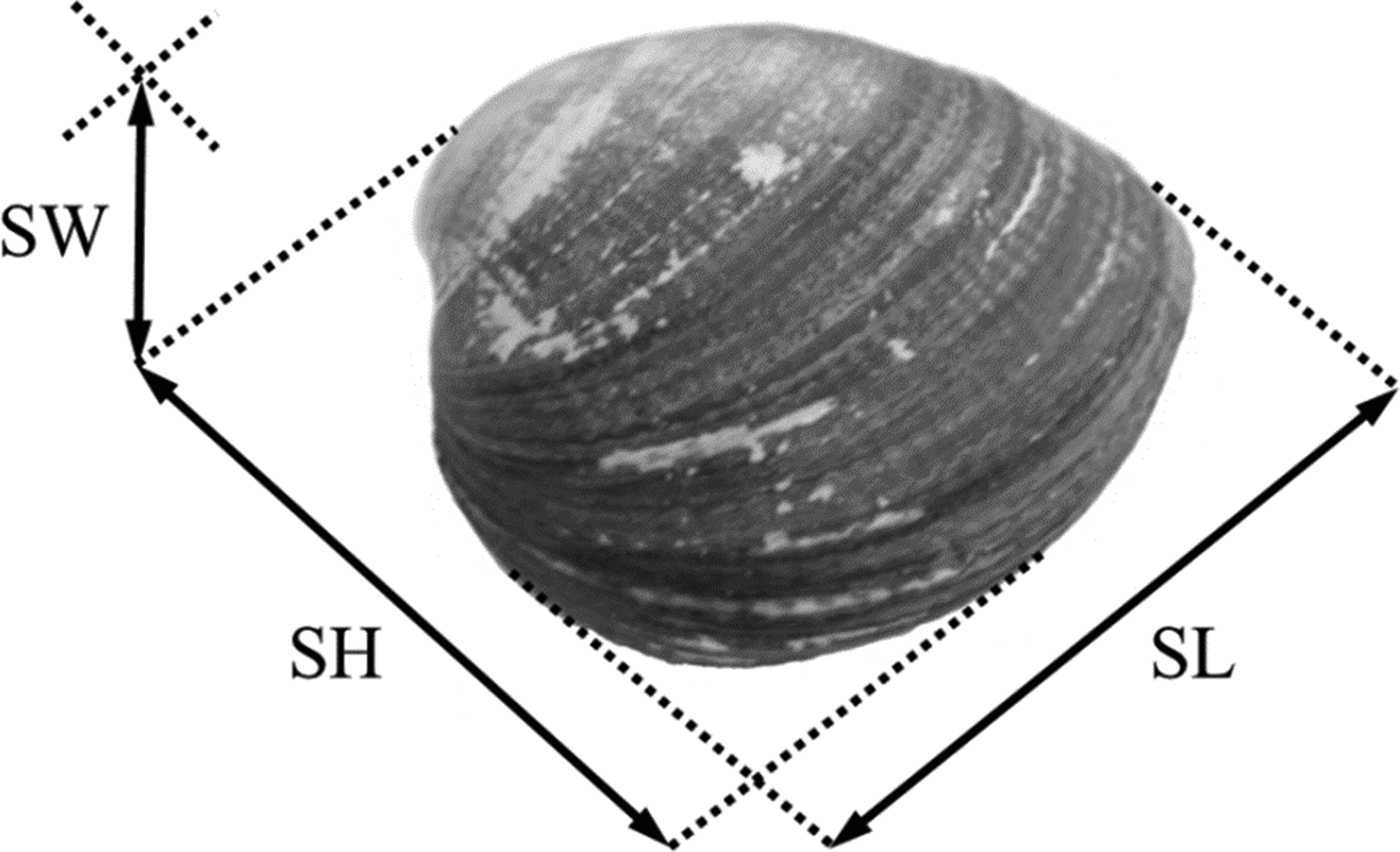
Subsequently, individuals were counted, measured using a digital caliper (precision of 0.01 mm) and weighed on a top loading digital balance (precision of 0.01 g). Bivalve morphometric analyses were based on the measurement of the three shell axes, namely shell length (SL, maximum distance on the anterior-posterior axis), shell height (SH, maximum distance on the dorsal-ventral axis, across the shell middle axis), and shell width (SW, maximum distance on the lateral axis, between both valves of the closed shell) (Figure 2), and on the determination of total weight (TW, individuals slightly blotted dry to remove surface fluids and drain excessive inter-valve water from the mantle cavity). Damaged specimens (mainly with anthropogenic damages inflicted during fishing and handling of the catches) were discarded or were only analysed for those morphometric parameters that were intact.
Schematic representation of the measurement of the three shell axes (SL, shell length – maximum distance on the anterior-posterior axis; SH, shell height – maximum distance on the dorsal-ventral axis, across the shell middle axis; SW, shell width – maximum distance on the lateral axis, between both valves of the closed shell).

Data treatment and statistical analyses
Bivalve morphometric relationships (SL vs SH, SW and TW) were established through regression analysis (least squares method), by fitting the power function to raw data (Y = aXb) and assessing the degree of association between variables by the Pearson correlation coefficient (r). The relative growth between variables (isometry vs allometry) was analysed through the allometry coefficient (regression slope – b) of the morphometric relationships. In relationships between the same type of variables (both linear) isometry occurs when b is not statistically different from 1 and in relationships between distinct types of variables (linear and ponderal) isometry occurs when b is not statistically different from 3, meaning that growth rates of both variables are identical during ontogeny (Huxley & Teissier, Reference Huxley and Teissier1936).
Afterwards, a t-test (H0: b = 1 or 3; HA: b ≠ 1 or 3) (Sokal & Rohlf, Reference Sokal and Rohlf1987) was applied to confirm whether the slopes (b) of the morphometric relationships were isometric (b = 1 or 3) or included in the allometric ranges (negative allometry: b < 1 or 3; positive allometry: b > 1 or 3) (Huxley & Teissier, Reference Huxley and Teissier1936). Statistical significance was considered for the standard cut-off level α = 0.05, but since multiple comparisons were performed, the significance level of both regressions and t-tests was adjusted using the Bonferroni correction, by dividing the original α-value by the number of analyses on the dependent variable (α’ adjusted = α critical/k) (Sokal & Rohlf, Reference Sokal and Rohlf1987).
Moreover, in order to further analyse and characterize bivalve species morphology, diverse morphometric indices based on the coupled ratios between the three shell axes and respective linear and ponderal variables (SL, SH, SW and TW), were calculated through the following equations (Caill-Milly et al., Reference Caill-Milly, Bru, Mahé, Borie and D'Amico2012, Reference Caill-Milly, Bru, Barranger, Gallon and D'Amico2014):
- Elongation index = SH/SL
- Compactness index = SW/SL
- Convexity index = SW/SH
- Density index (or weight ratio) = TW/SL
Finally, a discriminant analysis (DA) was used as an explanatory and predictive technique that generates a two-dimensional overview, allowing the spatial visualization of the differences between bivalve species and families based on their individual morphometric variables (measurements and weightings), performed using the statistical software XLStat (version 2016.6).
RESULTS
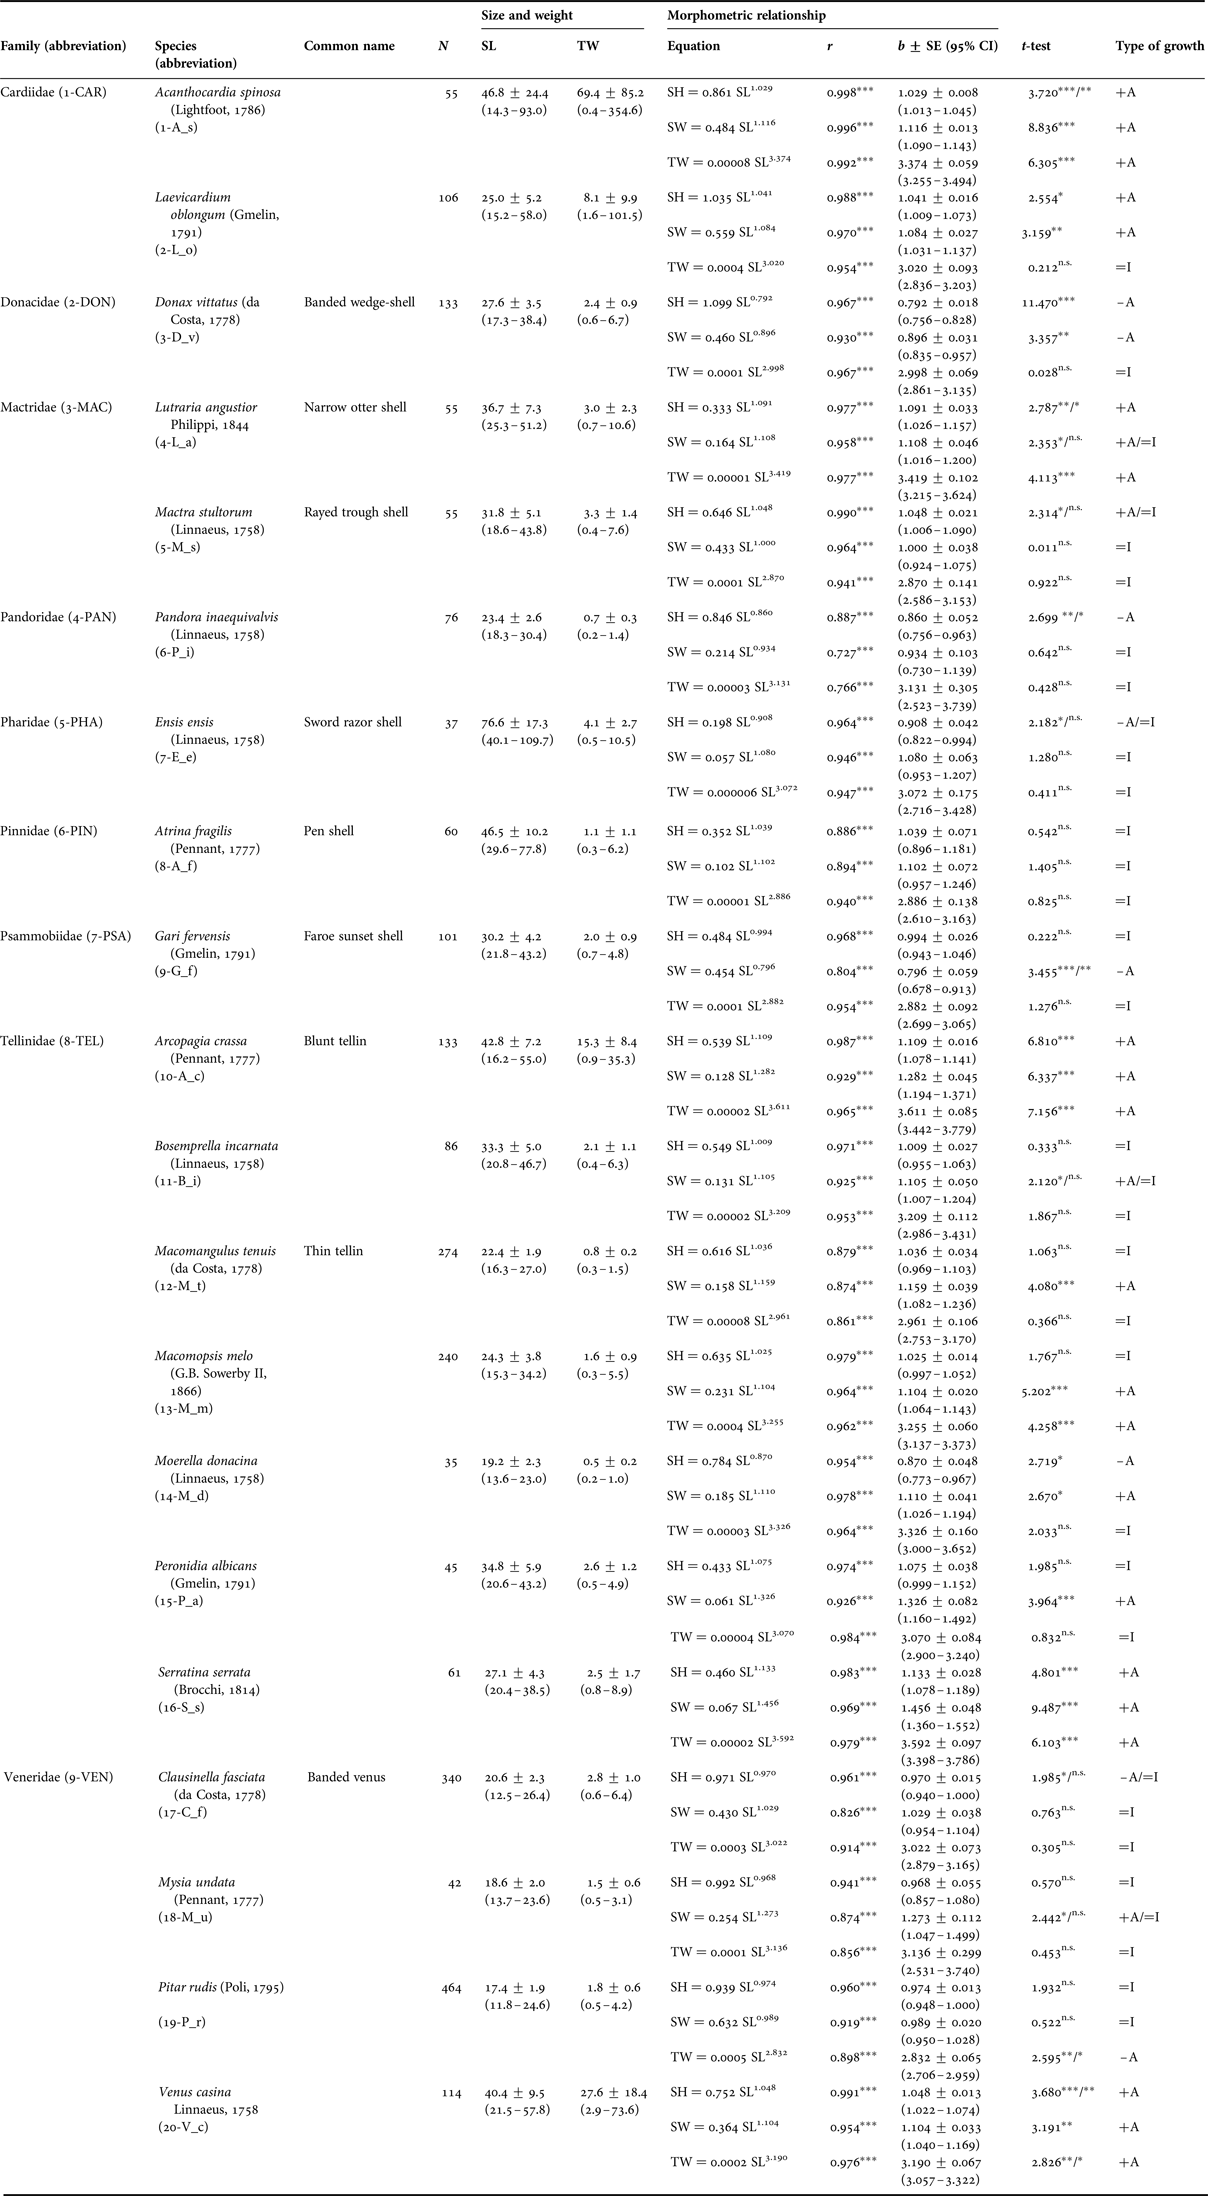
The descriptive statistics, morphometric relationships and type of growth of the uncommon bivalve species are compiled in Table 1. Overall, 2512 individuals of 20 species belonging to nine families were sampled (largely dominated by the families Tellinidae, Veneridae, Cardiidae with seven, four and two species, respectively). On average, 125 specimens of each species were sampled, ranging from 35 individuals (Moerella donacina) to 464 individuals (Pitar rudis). In general, those 20 species comprised individuals with broad size (11.8–109.0 mm SL) and weight (0.2–354.6 g TW) ranges, i.e. fairly representative of the bivalve populations inhabiting along the Algarve coast (Macedo et al., Reference Macedo, Macedo and Borges1999; Afonso, Reference Afonso and Borges2007). The largest specimens (76.6 ± 17.3 mm SL) belonged to Ensis ensis and the heaviest specimens (69.4 ± 85.2 g TW) belonged to Acanthocardia spinosa (Table 1).
Descriptive statistics, morphometric relationships and type of growth of 20 uncommon bivalve species from the Algarve coast (southern Portugal).

Notes: N, number of individuals; SL, shell length; SH, shell height; SW, shell width; TW, total weight; r, correlation coefficient; se, standard error; 95% CI, 95% confidence interval; +A, positive allometry; =I, isometry; –A, negative allometry. Size and weight data presented as mean ± sd and range (minimum – maximum). Abbreviations of bivalve families comprise a sequential number and the first three letters of the family name. Abbreviations of bivalve species comprise a sequential number and a pair of letters corresponding to the first letters of the genus and species names. Asterisks denote statistical significance level (P-value): n.s., P > 0.05 (not significant); *, P < 0.05; **, P < 0.01; ***, P < 0.001. t-test values with lower significance level after the Bonferroni correction present two sets of asterisks or types of growth (before/after the adjustment of the significance level).
In all bivalve species, the morphometric relationships were highly significant (P < 0.001) and displayed invariably high correlation coefficients (r = 0.727–0.998). In general, the correlation coefficients were slightly higher in the relationship SL vs SH (range = 0.879–0.998) compared with SL vs TW (range = 0.766–0.992) and SL vs SW (range = 0.727–0.996). In most species, correlation coefficients were higher in the relationship SL vs SH (15 species = 75.0%) or equally higher in SL vs SH and SL vs TW (2 species = 10.0%), followed by SL vs TW (2 species = 10.0%) and SL vs SW (1 species = 5.0%) (Table 1).
The allometry coefficients were in the ranges b = 0.792–1.456 (linear variables) and b = 2.832–3.611 (linear and ponderal variables), being more stable in the relationship SL vs SH (range = 0.792–1.133) and more variable in SL vs SW (range = 0.796–1.456) and SL vs TW (range = 2.832–3.611). Among the 60 morphometric relationships, isometries (27 = 45.0%) and positive allometries (25 = 41.7%) were much more frequent than negative allometries (8 = 13.3%). Isometries prevailed in the relationships SL vs TW (13 species = 65.0%) and SL vs SH (8 species = 40.0%), whereas positive allometries prevailed in SL vs SW (12 species = 60.0%) and negative allometries occurred mainly in SL vs SH (5 species = 25.0%). The application of the Bonferroni correction decreased the significance level of some t-tests and induced the reclassification of the type of growth in six morphometric relationships (from four positive and two negative allometries to six isometries). Some species exhibited a consistent growth type in all morphometric relationships, namely A. spinosa, Arcopagia crassa, Lutraria angustior, Serranita serrata and Venus casina (three positive allometries), Atrina fragilis (three isometries) and Bosemprella incarnata, Clausinella fasciata, E. ensis, Mactra stultorum and Mysia undata (three isometries following Bonferroni correction) (Table 1).
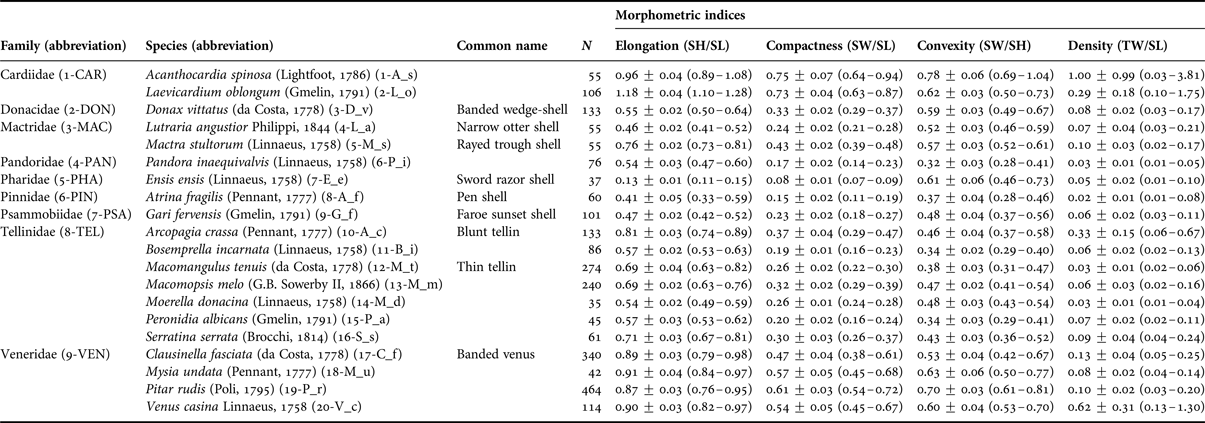
The morphometric indices (elongation, compactness, convexity and density) of the 20 uncommon bivalve species are compiled in Table 2. These indices displayed a remarkable variation among taxa, reflecting the high morphological diversity of species belonging to different families. Overall, the elongation index (SH/SL) presented a mean value of 0.68, ranging from 0.13 in E. ensis and 1.18 in Laevicardium oblongum. The compactness index (SW/SL) displayed a mean value of 0.36, with the lowest index corresponding again to E. ensis (0.08) and the highest index to A. spinosa (0.75). The convexity index (SW/SH) presented a mean value of 0.51, ranging from 0.32 in Pandora inaequivalvis and 0.78 also in A. spinosa. The density index (TW/SL) exhibited the highest variation among these morphological indices, with a mean value of 0.17 and a wide range between the lowest index of A. fragilis (0.02) and the highest index of A. spinosa (1.00). As expected, these morphometric indices intimately reflect that main morphological features of these bivalve species, being useful to highlight extreme variations in shell shape among species, such as for instance between the longer, thinner and lighter shells of E. ensis and A. fragilis from the more regular-shaped, compact and heavier shells of A. spinosa and L. oblongum (Table 2).
Morphometric indices (elongation, compactness, convexity and density) of 20 uncommon bivalve species from the Algarve coast (southern Portugal).

Notes: N, number of individuals; SL, shell length; SH, shell height; SW, shell width; TW, total weight. Data presented as mean ± sd and range (minimum – maximum). Abbreviations of bivalve families comprise a sequential number and the first three letters of the family name. Abbreviations of bivalve species comprise a sequential number and a pair of letters corresponding to the first letters of the genus and species names.
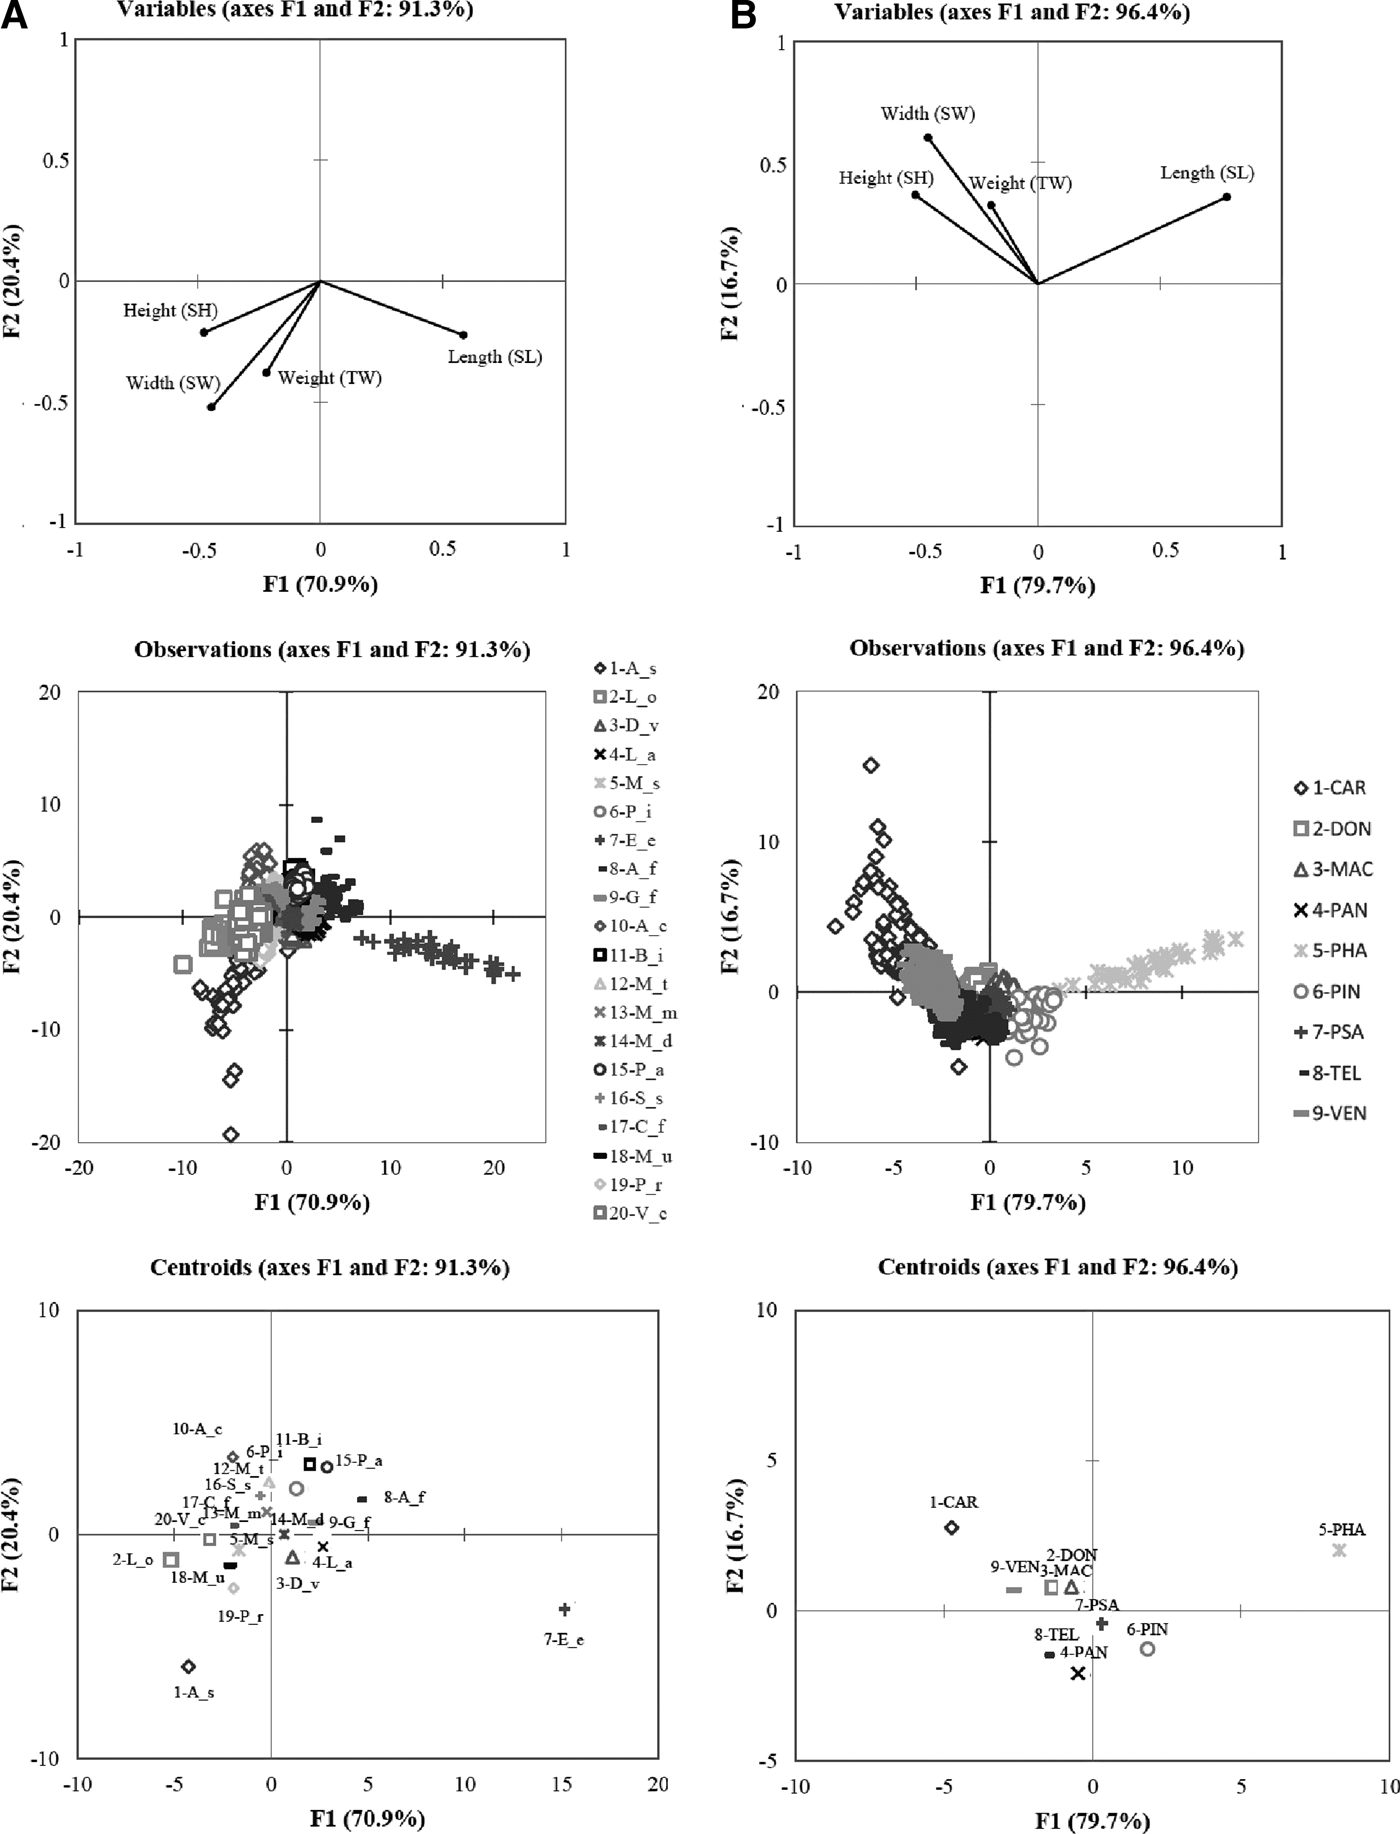
The discriminant analysis (DA) overview further evidenced this morphological variability by providing a spatial visualization of the morphometric variables (measurements and weightings) displayed by different species belonging to varied bivalve families (Figure 3). The DA detected highly significant morphometric differences between species (Wilks’ lambda test: F = 450.418, P < 0.0001) and families (Wilks’ lambda test: F = 615.527, P < 0.0001). In the inter-specific comparison the first two axes explained 91.3% of the total covariance (70.9% by F1 and 20.4% by F2) (Figure 3A), whereas in the comparison between families the first two axes explained 96.4% of the total covariance (79.7% by F1 and 16.7% by F2) (Figure 3B). In both cases, the first axis (F1) is correlated with shell length and the second axis (F2) is correlated with the remaining morphometric variables (shell height, shell width and total weight). The axis F1 clearly discriminates E. ensis (Pharidae) but also incorporates A. fragilis (Pinnidae), as a function of their remarkable shell length, whereas the axis F2 mainly highlights the morphological distinctness of A. spinosa and L. oblongum (Cardiidae), as a function of their globous shape and heavy weight. Indeed, Pharidae and Cardiidae were the most dissimilar families, as evidenced by their farthest position and projection in separate axis of the ordination diagram (Figure 3A, B). Overall, the DA provided a correct cross-validation of 88.1% of the species analysed (100% correct assignments for A. fragilis, E. ensis and M. stultorum) and of 95.1% of the families analysed (100% correct assignments for Pharidae and Pinnidae).
Discriminant analysis biplots illustrating the morphometric variables, groupings and centroids of (A) 20 bivalve species and (B) nine bivalve families collected along the Algarve coast (southern Portugal). Abbreviations: species and families names are abbreviated using the first letters of the genus and species and the first three letters of the family, being represented with different symbols and greyscales (further details on the bivalve species and families are presented in Tables 1 & 2).

DISCUSSION
Bivalves are known for their remarkable morphological diversity and the phenotypic plasticity of shell morphometrics has long been reported in the literature (Caill-Milly et al., Reference Caill-Milly, Bru, Barranger, Gallon and D'Amico2014). Phenotypic plasticity is a key evolutionary strategy that enables organisms to respond both adaptively and non-adaptively to natural and artificial selection (Scheiner, Reference Scheiner1993; Murren et al., Reference Murren, Auld, Callahan, Ghalambor, Handelsman, Heskel, Kingsolver, MacLean, Masel, Maughan, Pfennig, Relyea, Seiter, Snell-Rood, Steiner and Schlichting2015). A high degree of phenotypic plasticity allows organisms to adapt physically and behaviourally to spatially and temporally variable environments, allowing them to survive under climatic changes (West-Eberhard, Reference West-Eberhard2003; Murren et al., Reference Murren, Auld, Callahan, Ghalambor, Handelsman, Heskel, Kingsolver, MacLean, Masel, Maughan, Pfennig, Relyea, Seiter, Snell-Rood, Steiner and Schlichting2015). Inhabiting highly diverse and changeable marine habitats, bivalves are subjected to several ecological drivers of species distribution (McKeon et al., Reference McKeon, Tunberg, Johnston and Barshis2015), which further contributes to high phenotypic plasticity being reflected in great morphological diversity.
The allometric principles of animal morphology have long been recognized, since relative growth and the concept of allometry were postulated by Huxley & Teissier (Reference Huxley and Teissier1936). Because growth is a three-dimensional process with all axes changing over time, allometry studies the relationship between two measurable variables aiming to analyse size and its consequences (Mayrat, Reference Mayrat1970; Reiss, Reference Reiss1989). Morphometric changes throughout ontogeny are clearly genotype-driven (Gosling, Reference Gosling2003) but can be also modulated by environmental conditions (Caill-Milly et al., Reference Caill-Milly, Bru, Barranger, Gallon and D'Amico2014), following the concept of conservation of physiologically favourable ratios of surface area to volume (Rhoads & Pannella, Reference Rhoads and Pannella1970; Gosling, Reference Gosling2003). In general, ontogenetic changes in bivalve morphometrics reflect functional adaptations in shell shape to better cope with certain habitat features and environmental conditions, allowing improvement in burrowing ability (e.g. Pohlo, Reference Pohlo1964; Thayer, Reference Thayer1975) and to avoid involuntary dislodgement by turbulence and currents (e.g. Eagar, Reference Eagar1978). In addition, some morphological features of bivalve shells, including rigidity, sculpture and ornamentation (e.g. ribs, ridges, knobs and spines), reflect habitat preferences and life-habits of the species, which regulate functional specializations such as anchoring into the sediment to avoid inadvertent displacement, burrowing behaviour and ability, and defence from predators (Trueman et al., Reference Trueman, Brand and Davis1966; Stanley, Reference Stanley1970, Reference Stanley1975, Reference Stanley1981; Eagar, Reference Eagar1978; Seed, Reference Seed, Rhoads and Lutz1980; McLachlan et al., Reference McLachlan, Jaramillo, Defeo, Dugan, de Ruyck and Coetzee1995).
Despite the above-mentioned selective characteristics of the bivalve dredges operated along the Algarve coast (Gaspar et al., Reference Gaspar, Castro and Monteiro1999, Reference Gaspar, Dias, Campos, Monteiro, Santos, Chícharo and Chícharo2001b, Reference Gaspar, Leitão, Santos, Sobral, Chícharo, Chícharo and Monteiro2002b, Reference Gaspar, Leitão, Santos, Sobral, Chícharo, Chícharo and Monteiro2003a, Reference Gaspar, Leitão, Santos, Chícharo, Dias, Chícharo and Monteirob), the present study comprises bivalve species with broad size and weight ranges (11.8–109.0 mm SL and 0.2–354.6 g TW ranges), being fairly representative of the bivalve populations inhabiting the southern coast of Portugal. For example, besides comprising some remarkably small-sized individuals, several species clearly approached (e.g. A. spinosa, C. fasciata, Donax vittatus, Macomangulus tenuis, M. donacina, P. rudis and S. serrata) or slightly exceeded (e.g. B. incarnata and V. casina) the sizes previously reported for the Portuguese coast (Macedo et al., Reference Macedo, Macedo and Borges1999). Such wide ranges are crucial because morphometric relationships and indices should be limited to the size intervals included in the analyses, thus avoiding biased extrapolation of data for individuals below or above those size ranges.
In the present study, the invariably high correlation coefficients registered in the morphometric relationships established between linear and ponderal variables of all bivalve species revealed that the measurement of shell length is an adequate predictor of shell height, shell width and total weight, therefore such morphometric relationships constitute accurate tools for mutual conversion between those linear and ponderal variables, even though soft parts weight and total weight might vary slightly throughout the species' reproductive cycle. In each species, correlation coefficients varied depending on the type of morphometric relationships, but in most species (75.0%) were higher in the relationship SL vs SH compared with the relationships SL vs SW and SL vs TW, indicating lower variability in shell shape in terms of shell height than in shell width and total weight. Similarly, the allometry coefficients (b) were more stable in the relationship SL vs SH and more variable in the relationships SL vs SW and SL vs TW, further confirming higher variability and greater morphological plasticity in terms of shell height compared with shell width and total weight. Regarding specifically total weight, this higher variability might be attributable to diverse factors, including the difficulty to standardize the blot-drying procedures and consequent discrepancy in the amount of water retained inside the shell (Vasconcelos et al., Reference Vasconcelos, Lopes, Castro and Gaspar2008), fluctuation in soft-parts weight due to changes in the physiological processes (gonad maturation, ripening, spawning and resting) that occur throughout the reproductive cycle (Lucas & Beninger, Reference Lucas and Beninger1985; Davenport & Chen, Reference Davenport and Chen1987; Crosby & Gale, Reference Crosby and Gale1990) and variation in shell weight due to investment of energetic resources in repairing shell damage (Vasconcelos et al., Reference Vasconcelos, Lopes, Castro and Gaspar2008).
In the 20 bivalve species analysed, isometries (43.3%) and positive allometries (43.3%) largely prevailed over negative allometries (13.3%), in practice meaning that in most morphometric relationships the dependent variables (SH, SW and TW) grow at similar or at higher rate than the independent variable (SL) throughout the ontogeny. In addition, the relative growth between variables (isometry vs allometry) also varied depending on the type of morphometric relationship: SL vs TW was isometric in most species (60.0%), SL vs SW was positive allometric in most species (60.0%), and SL vs SH was isometric (40.0%) or negative allometric (25.0%) in several species. Overall, this indicates gradual morphological changes throughout the species ontogeny, which vary as a function of their functional adaptations and strategies to better cope with unfavourable environmental conditions. Indeed, particular shell shapes favour inhabiting specific environments and allow an efficient functioning of the shell, such as for instance the functional significance of shell relative weight, with thicker and heavier shells being more protective against wave impact, aerial exposure, freezing, heating and drying (Alyakrinskaya, Reference Alyakrinskaya2005). In addition, since the vast majority of these species inhabit sandy or sandy-mud bottoms, the type of substrata might also influence their morphometric relationships and relative growth, with more streamlined shells providing an important advantage in terms of burrowing ability in soft-bottom sediments (Pohlo, Reference Pohlo1964; Thayer, Reference Thayer1975; Gaspar et al., Reference Gaspar, Santos, Vasconcelos and Monteiro2002a).
In some bivalve species, such ontogenetic changes in shell morphometrics and relative growth appear to be characteristic of their genus, namely the predominant positive allometries in the genus Acanthocardia and predominant isometries and negative allometries in the genus Donax. In the present study, A. spinosa exhibited a consistent type of growth in all morphometric relationships (three positive allometries) and the congeneric A. aculeata, A. paucicostata and A. tuberculata also displayed mainly positive allometric growth between the same linear and ponderal variables (Gaspar et al., Reference Gaspar, Santos and Vasconcelos2001a, Reference Gaspar, Santos, Vasconcelos and Monteiro2002a). Such consistency in relative growth is certainly due to the life habits of these species (living only half-buried in the substrata) and their defence against predators relying on the heavy-weight, voluminous and globous shaped, solid, thick and ornamented shell (including prominent spines on the shells of A. spinosa and A. aculeata). In contrast, D. vittatus exhibited one isometry (SL vs TW) and two negative allometries (SL vs SH and SL vs SW) and the congeneric D. semistriatus, D. trunculus and D. variegatus were also among the species that displayed frequent negative allometric growth in the same morphometric relationships (Gaspar et al., Reference Gaspar, Santos and Vasconcelos2001a, Reference Gaspar, Santos, Vasconcelos and Monteiro2002a). The prevalence of negative allometries in these species, reflected in elongated, narrow, smooth and light shells, is probably related to their active burrowing behaviour into sandy sediments, constituting an adaptive strategy to improve burrowing ability and avoid detrimental dislodgement by intense currents and waves in the relatively shallow waters inhabited by these species.
The calculation of morphometric indices (elongation, compactness, convexity and density) provided additional insights into the morphological variability and particular shell features of the studied bivalve species, further confirming the usefulness of this type of data treatment already evidenced in recent morphometric studies of bivalves (Selin, Reference Selin2007; Caill-Milly et al., Reference Caill-Milly, Bru, Mahé, Borie and D'Amico2012, Reference Caill-Milly, Bru, Barranger, Gallon and D'Amico2014). Furthermore, the discriminant analysis (DA) overview allowed for clearly separating the species with more dissimilar shell shapes as a function of their contrasting morphometric variables (e.g. A. spinosa and L. oblongum vs E. ensis and A. fragilis), reflecting their different life habits and specific morphological adaptations. This simple example perfectly illustrates the diversity of adaptive strategies developed by bivalve species for coping with particular environmental conditions, such as for instance the ‘anchoring’ effect displayed by A. spinosa and the fast and deep burrowing behaviour exhibited by E. ensis. Finally, depending on the separation or grouping of species and families as a function of their morphometric variables, the DA overview proved suitable for highlighting the main shell features responsible for the distinctness between some bivalve species and families (e.g. Pharidae and Cardiidae, clearly separated in the DA biplot) and the morphological resemblance among some species belonging to other families (e.g. Veneridae and Tellinidae, closely grouped in the DA biplot), which might constitute a useful additional tool for the identification and classification of bivalves.
ACKNOWLEDGEMENTS
The authors are grateful to the technical staff of the Instituto Português do Mar e da Atmosfera (IPMA, I.P.) for their helpful assistance in the fishing surveys and laboratory sampling procedures. The authors acknowledge the Associate Editor of JMBA UK (Dr Jan G. Hiddink) and two anonymous reviewers for their valuable comments and suggestions that improved the revised version of the manuscript.
FINANCIAL SUPPORT
This study was performed within the framework of the research project ‘Salubridade e Classificação das Zonas de Produção de Bivalves da Região Algarvia – SALBIV’, funded by the Fisheries Operational Programme (PROMAR) and co-financed by the European Fisheries Fund (EFF 2007-2013). The first author (Paulo Vasconcelos) was funded by a post-doctoral grant (SFRH/BPD/26348/2006) awarded by the Fundação para a Ciência e Tecnologia (FCT – Portugal).