INTRODUCTION
In livestock, the constant improvement of genetic potential is an important factor for increasing productivity, improving performance parameters and quality of the final product (Montaldo et al. Reference Montaldo, Casas, Ferraz, Vega-Murillo and Roman-Ponce2012). In Brazil, the selection of beef cattle is based mainly on using standardized weights at different ages and weight gains (Queiroz et al. Reference Queiroz, Oliveira, Costa and Fries2013). However, the selection of animals with a phenotype suitable for the production system is a key aspect of increasing the economic efficiency of a rural enterprise (Faria et al. Reference Faria, Magnabosco, Albuquerque, Bezerra and Lôbo2009).
The methodology proposed by Koury Filho et al. (Reference Koury Filho, Albuquerque, Forni, Silva, Yokoo and Alencar2010) describes body structure (BS), finishing precocity (FP) and muscling (MS) as visual score traits. These scores allow assessment of the morphological differentiation of animals and classification into different groups of phenotypes. Currently, this methodology is used in Brazil by the breeding programmes of the Brazilian Association of Zebu Breeders (ABCZ) and the National Association of Breeders and Researchers (ANCP).
In addition to standard weights and visual scores, two other factors have been considered for improving herd breeding performance: the assessment of sexual precocity and fertility (Guarini et al. Reference Guarini, Neves, Schenkel, Carvalheiro, Oliveira and Queiroz2015), by evaluating traits such as age at first calving (AFC), heifer pregnancy (HP) and stayability (STAY; the probability of a cow to produce at least three calves before reaching 76 months of age). Anticipating the AFC is directly linked to the efficiency and profitability of beef cattle production although this reproductive trait has a low heritability (Buzanskas et al. Reference Buzanskas, Grossi, Baldi, Barrozo, Silva, Torres, Munari and Alencar2010; Valente et al. Reference Valente, Sant'Anna, Baldi, Albuquerque and Costa2015). Generally, reproductive traits have low heritability estimates, but high economic importance. Thus, breeding programmes that take into account these traits can have a positive impact on herd productivity in the long term (Boligon et al. Reference Boligon, Albuquerque and Rorato2008).
Therefore, the objective of the current study was to estimate the genetic parameters for visual assessment traits, body weight, AFC, HP and STAY in Nellore cattle and verify the possibility of including these traits in the selection criteria of breeding programmes.
MATERIALS AND METHODS
Data
The data used in the current study was provided by the ANCP. A total of 37 826 Nellore animals, born in farms throughout Brazil between 2002 and 2014 that participate in the ANCP genetic evaluation programme, were evaluated. The following traits were studied: body weight adjusted to 450 days of age (W450), visual assessment scores (BS, FP and MS) measured at 487 days of age, AFC, HP and STAY. The pedigree file was composed of 88 213 animals.
The database presented, on average, 1·93 and 33·73 offspring per dam and sire, respectively. The ANCP technicians conducted the visual assessments, assigning scores on a scale ranging from 1 to 6. Intermediate animals were scored between three and four in the management group and taken as a reference for scoring the other animals, below (one or two points) or above (five or six points) the average (Faria et al. Reference Faria, Pires, Vozzi, Magnabosco, Koury Filho, Viu, Oliveira and Lôbo2010). Therefore, visual scores were evaluated following the methodology proposed by Koury Filho et al. (Reference Koury Filho, Albuquerque, Forni, Silva, Yokoo and Alencar2010), as described below:
-
• Body structure: Visually predicts the body area as seen from the side (body length and rib depth). The smallest animals of the management group were assigned a score of 1, which gradually increased to 6, assigned to the largest animals.
-
• Finishing precocity: This evaluation was based on the observation of fat deposition in strategic points of the animal's body. In addition, visual assessment of the rib depth in relation to the length of the limbs was used. Animals presenting shorter rib depth and longer limbs are frequently less precocious than those with longer rib depth and shorter limbs. Animals with a precocious phenotype require less time for fat deposition and hence lower production costs. A score of 1 was assigned to animals with lower precocity and a score of 6 to animals with early fat deposition.
-
• Muscling: MS was assessed by the distribution of muscle mass in the animal's body and the convexity of the muscles in the carcass. Scores of 1–6 were assigned to animals with muscle mass volume varying from ‘thinner’ to ‘thicker’, respectively.
In the current study, the STAY trait was adapted from the definition presented by Hudson & Van Vleck (Reference Hudson and Van Vleck1981) and expressed the cow's ability to calve at least three times up to 76 months of age. Thus, STAY = 1 was assigned to females that failed to calve three or more times up to 76 months of age, while STAY = 2 was assigned to females that fulfilled the requirement. Age at first calving was measured as the age at which the heifer calved for the first time.
The HP trait identified heifers that became pregnant early, up to 30 months of age, and carried the pregnancy to term, giving birth to a living calf. The heifers that did not fulfil this requirement were assigned HP = 1, whereas the females that fulfilled this requirement were early and assigned HP = 2.
Genetic analysis
The least squares method in the GLM procedure of SAS statistical software (SAS 9·3, SAS Institute, Cary, NC, USA) was used to define fixed effects for BS, FP, MS, W450 and AFC traits. For the BS, FP and MS traits, the significant fixed effects (P < 0·05) considered were the contemporary group (CG), animal age at assessment (covariate, linear effect) and age of the dam at calving (covariate, linear and quadratic effects). For W450, the significant fixed effects (P < 0·05) were CG and age of the dam at calving (covariate, linear and quadratic effects). The significant fixed effects (P < 0·05) for AFC considered CG and age of the dam at calving (covariate, linear effect).
Logistic regression in the GENMOD procedure of SAS was used to define the fixed effects of the HP and STAY traits. For HP, the significant fixed effects (P < 0·05) were CG and age of the dam at calving (covariate, linear and quadratic effects). For STAY, only CG was considered as a fixed effect. The CGs for BS, FP, MS, W450 and AFC concatenated the effects of sex (not considered for AFC), birth season and year and farm of birth. For HP, CG was formed by birth year, season and farm of birth. The CG for STAY considered cows born in the same year and farm.
Bulls with fewer than three offspring and CGs with fewer than three animals were excluded from the analysis. For STAY and HP traits, CGs presenting females that scored only ‘1’ or only ‘2’ were excluded. The UNIVARIATE procedure of SAS was used to verify the normality of the standardized residuals for each trait. Observations with standardized residual above 3·5 or below −3·5 standard deviations were excluded.
The statistical model used for the genetic analysis consisted of additive genetic and residual random effects and the fixed effects mentioned above. The two-trait animal model can be represented by:
 $$\left[ {\matrix{ {y_1} \cr {y_2} \cr}} \right] = \left[ {\matrix{ {X_1} & 0 \cr 0 & {X_2} \cr}} \right]\left[ {\matrix{ {b_1} \cr {b_2} \cr}} \right] + \left[ {\matrix{ {Z_1} & 0 \cr 0 & {Z_2} \cr}} \right]\left[ {\matrix{ {a_1} \cr {a_2} \cr}} \right] + \left[ {\matrix{ {e_1} \cr {e_2} \cr}} \right]$$
in which y 1 and y 2 represent traits 1 and 2. The fixed-effect vectors for trait 1 (b 1) and trait 2 (b 2) considered the CGs and covariates previously described. The vectors a 1 and a 2 are random additive genetic effects and e 1 and e 2 are residual random effects for traits 1 and 2, respectively. The incidence matrices X 1 and X 2 associated the elements of b 1 and b 2 with y 1 and y 2. The incidence matrices Z 1 and Z 2 associated the elements of a 1 and a 2 with y 1 and y 2.
The variance–covariance structure of random effects is described as follows:
 $${\rm Var}\left[ {\matrix{ {\matrix{ {a_1} \cr {a_2} \cr}} \cr {e_1} \cr {e_2} \cr}} \right] = \left[ {\matrix{ {A\sigma _{a_1} ^2} & {A\sigma _{a_1 a_2}} & 0 & 0 \cr {A\sigma _{a_1 a_2}} & {A\sigma _{a_2} ^2} & 0 & 0 \cr 0 & 0 & {I\sigma _{e_1} ^2} & {I\sigma _{e_1 e_2}} \cr 0 & 0 & {I\sigma _{e_1 e_2}} & {I\sigma _{e_1} ^2} \cr}} \right]$$
in which
 $\sigma _{a_1} ^2 $
and
 $\sigma _{a_2} ^2 $
are additive genetic variances for traits 1 and 2, respectively;
 $\sigma _{e_1} ^2 $
and
 $\sigma _{e_2} ^2, $
the residual variances for traits 1 and 2, respectively;
 $\sigma _{a_1 a_2} $
and
 $\sigma _{e_1 e_2} $
, the genetic and residual covariances between traits 1 and 2; and A and I, the relationship and identity matrices, respectively.
Linear models were considered for analysing BS, MS, FP, W450 and AFC. Threshold models were applied for HP and STAY. The single- and two-trait Bayesian analyses were conducted using the thrgibbsf90b software (Tsuruta & Misztal Reference Tsuruta and Misztal2006) and considered a chain length of 1 200 000 cycles and a burn-in period of 200 000 cycles. The samples were stored every 200 cycles, generating 5000 samples. Both the discard period and the sampling interval were established empirically. Uninformative a priori distributions were defined for all effects and genetic variances.
The convergence of the chains generated by the Gibbs sampler was monitored using the Geweke (Geweke Reference Geweke, Bernardo, Berger, Dawid and Smith1992) and Heidelberger and Welch (Heidelberger & Welch Reference Heidelberger and Welch1983) criteria obtained from the ‘Bayesian Output Analysis Programme – boa’ (Smith Reference Smith2007). The chains converged when at least one of the criteria was achieved.
RESULTS
Descriptive statistics
Table 1 presents the descriptive statistics for BS, FP, MS, W450, AFC, HP and STAY. The median and mode values assigned to the visual scores were between 3 and 4. For STAY, around 0·75 of the cows successfully calved three calves up to 76 months of age. The average body weight at 450 days of age was 285 kg and the average AFC was equal to 34·47 months. These values are close to those found in the literature (Guidolin et al. Reference Guidolin, Buzanskas, Ramos, Venturini, Lôbo, Paz, Munari and Oliveira2012; Lopes et al. Reference Lopes, Magnabosco, Paulini, Silva, Miyagi and Lôbo2013).
Descriptive statistics for body structure (BS), finishing precocity (FP) and muscling (MS) at 487 days of age; body weight at 450 days of age (W450); age at first calving (AFC); heifer pregnancy (HP); and stayability (STAY) of Nellore cows

NCG, number of contemporary groups; s.d., standard deviation.
Heritability estimates
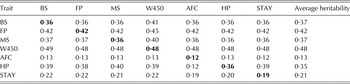
Heritability estimates of single-trait analysis converged for all diagnoses considered. In the two-trait analysis, according to the Heidelberger and Welch criterion only, convergence was achieved for the heritability estimates for STAY when analysed with FP, MS and W450 and for HP when analysed with AFC. The other analyses converged for both criteria.
For the visual assessment traits, body weight at 450 days of age, AFC, HP and STAY, the heritability estimates varied according to the type of analysis (single- and two-trait). Among the reproductive traits, AFC had the lowest heritability estimate (Table 2). The heritability estimates for visual assessment traits were moderate and the values were equal to 0·37, 0·42 and 0·37 for BS, FP and MS, respectively. The body weight at 450 days of age presented high heritability estimates, with an average of 0·48.
Posterior estimates of heritability obtained from single (diagonal, in bold) and two-trait (off-diagonal) analyses and average heritability estimates obtained from two-trait analyses for body structure (BS), finishing precocity (FP) and muscling (MS) at 487 days of age; body weight at 450 days of age (W450); age at first calving (AFC); heifer pregnancy (HP); and stayability (STAY) of Nellore cows
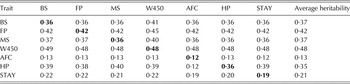
Standard deviation for BS, FP, MS and W450 equal to 0·02; standard deviation for AFC equal to 0·03; standard deviation for HP and STAY varying from 0·07 to 0·08.
Estimates of correlations between studied traits
According to the Geweke criterion, the genetic and environmental correlations that did not converge were between STAY with BS, FP, MS and AFC, and between HP with AFC. Also for the Geweke criterion, the phenotypic correlations that did not converge were between STAY with BS and AFC, and between HP with FP and AFC.
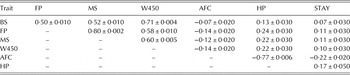
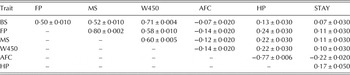
The visual assessment traits displayed high genetic correlations with W450. All visual assessment traits and W450 presented negative genetic correlations with the AFC, ranging from low to moderate magnitude. The FP and MS traits, when compared to W450, showed higher genetic correlations with the reproductive traits (Table 3).
Posterior estimates of genetic (above diagonal) and environmental (below diagonal) correlations from two-trait analyses between body structure (BS), finishing precocity (FP) and muscling (MS) at 487 days of age; body weight at 450 days of age (W450); age at first calving (AFC); heifer pregnancy (HP); and stayability (STAY) of Nellore cows

± Standard error.
The environmental correlations ranged from low to high, in which higher estimates were observed between FP and MS traits, and lower estimates between BS and STAY. The genetic correlations between BS × AFC and BS × HP, and environmental correlations between BS × STAY, FP × HP, FP × STAY, MS × STAY, W450 × STAY and HP × STAY, had standard deviations equal to or greater than the estimates (Table 3). Environmental and phenotypic correlations were close and in the same direction for all traits (Tables 3 and 4).
Phenotypic correlation estimates (above diagonal) from two-trait analyses between body structure (BS), finishing precocity (FP) and muscling (MS) at 487 days of age; body weight at 450 days of age (W450); age at first calving (AFC); heifer pregnancy (HP); and stayability (STAY) of Nellore cows
± Standard error.
DISCUSSION
All studied traits may respond to direct selection
Heritability estimates observed in the current study were higher than those estimated by Koury Filho et al. (Reference Koury Filho, Albuquerque, Forni, Silva, Yokoo and Alencar2010) for BS (0·24), FP (0·32) and MS (0·27). For MS, the heritability estimate was higher than that obtained by Faria et al. (Reference Faria, Magnabosco, Albuquerque, Bezerra and Lôbo2009). The results indicated that visual assessment traits varied due to additive gene action and using these traits as selection criteria may result in genetic improvement of body composition and body type.
For body weight at 450 days of age, the heritability estimate was higher than those estimated by Grossi et al. (Reference Grossi, Venturini, Paz, Bezerra, Lôbo, Oliveira and Munari2009) and Vargas et al. (Reference Vargas, Buzanskas, Guidolin, Grossi, Bonifácio, Lôbo, Fonseca, Oliveira and Munari2014) for Nellore and Brahman cattle, respectively. However, Loaiza-Echeverri et al. (Reference Loaiza-Echeverri, Toral, Bergmann, Osorio, Carmo and Henry2013) investigated Guzerat cattle and reported higher values for W450, ranging from 0·52 to 0·60. Slightly higher heritability estimates for W450 (0·56) were observed by Silva et al. (Reference Silva, Araújo, Bittencourt, Araújo, Lôbo, Bezerra, Silva and Silva2013) for Nellore. Guidolin et al. (Reference Guidolin, Buzanskas, Ramos, Venturini, Lôbo, Paz, Munari and Oliveira2012) reported heritability estimates ranging from 0·2 ± 0·07 to 0·7 ± 0·05 for Nellore in a genotype × environment interaction study.
Grossi et al. (Reference Grossi, Venturini, Paz, Bezerra, Lôbo, Oliveira and Munari2009); Buzanskas et al. (Reference Buzanskas, Grossi, Baldi, Barrozo, Silva, Torres, Munari and Alencar2010) and Bernardes et al. (Reference Bernardes, Grossi, Savegnago, Buzanskas, Urbinati, Bezerra, Lôbo and Munari2015) estimated lower AFC heritability for Nellore, Canchim and Tabapuã cattle, respectively. Moreira et al. (Reference Moreira, Buzanskas, Munari, Canova, Lôbo and Paz2015) and Silva et al. (Reference Silva, Boligon, Fernandes, Filho, El Faro, Tonhati, Albuquerque and Fraga2016) reported higher AFC heritability estimates, 0·2 ± 0·01 and 0·3 ± 0·06 for Nellore and Gir, respectively. These findings would predict that direct selection for AFC might result in slow improvement compared to selection for other reproductive traits such as HP. Boligon & Albuquerque (Reference Boligon and Albuquerque2011) concluded that it would be beneficial to use HP at 16 months of age for sexual precocity selection, due to its high heritability.
Among reproductive traits, HP heritability estimates were higher, averaging 0·35, indicating that selection for this trait could result in a faster genetic change in the population compared to selection for AFC and STAY. Thus, it is recommended to evaluate young heifers in order to identify and select females with higher sexual precocity. The definition of the HP trait in the current study was similar to that of Boligon & Albuquerque (Reference Boligon and Albuquerque2011), who reported heritability estimate equal to 0·5 ± 0·02 and concluded that it is advantageous to use HP in selection for sexual precocity in Nellore cattle. Valente et al. (Reference Valente, Sant'Anna, Baldi, Albuquerque and Costa2015) estimated heritability equal to 0·4 ± 0·06 for the HP trait in Nellore.
The heritability estimate obtained for STAY was moderate and averaged 0·21. Although direct selection for this trait can result in a genetic gain for productive longevity, the long period needed for dams to express this phenotype makes it difficult to include in the genetic evaluation and using indirect selection to improve this trait could be suggested. In addition, heritability estimates for STAY also indicate that direct selection for this trait would result in a slow genetic gain. Thus, due to the high influence of the environmental component, enhancing environmental conditions could be an alternative for cows to remain productive in the herd.
The heritability estimates of STAY may vary depending on breed and trait definition used in each study. Doyle et al. (Reference Doyle, Golden, Green and Brinks2000) studied Angus cattle and reported a heritability estimate of 0·15 for cows that had five offspring, given that two calves were born in the first 2 years of life. Martinez et al. (Reference Martinez, Koch, Cundiff, Gregory and Van Vleck2004) studied Hereford cows and, using a sire model, obtained heritability estimates ranging from 0·09 to 0·17. Some studies have reported values lower than the results in the current study for Nellore cattle. Silva et al. (Reference Silva, Eler, Ferraz, Golden and Oliveira2003) estimated a heritability of 0·15 for STAY up to 5 years of age, given that the cow had calved at least once before this age. Silva et al. (Reference Silva, Formigoni, Eler and Ferraz2006) estimated the highest heritability for STAY (0·22), while Guarini et al. (Reference Guarini, Neves, Schenkel, Carvalheiro, Oliveira and Queiroz2015), using the same definition of STAY as in the current study, reported heritability of 0·019 ± 0·0025.
Genetic, phenotypic and environmental relationships between the studied traits
The estimates of genetic correlations were positive between the visual assessment traits, ranging from moderate to high values, indicating that these are largely determined by the same sets of genes with additive action. The high correlation between FP and MS (0·92) is in agreement with the value estimated by Faria et al. (Reference Faria, Pires, Vozzi, Magnabosco, Koury Filho, Viu, Oliveira and Lôbo2010). The genetic correlation estimates between W450 and visual scores were positive and favourable (0·89 with BS, 0·73 with FP and 0·77 with MS). These high correlation estimates indicate that the visually assessed traits could be used as selection criteria to improve growth and carcass traits in these herds. Animals showing higher scores would be heavier (W450) and present larger body size (BS), higher fat deposition (FP) and greater MS. Thus, the use of visually assessed traits for genetic selection in a herd should bring genetic progress for W450 and vice versa.
The genetic correlations of AFC with BS (−0·06) and W450 (−0·22) were negative and low, indicating that body weight and structure have a low impact on female sexual precocity. The genetic correlation estimates of AFC with FP and MS were negative and moderate, −0·47 and −0·37, respectively. Therefore, the selection of animals with higher scores for FP and MS could decrease AFC, which is desirable for the production system. Although the estimates between AFC and W450 had low magnitude, the correlation was favourable, suggesting that heavier females may have lower AFC. Boligon et al. (Reference Boligon, Albuquerque and Rorato2008) estimated the genetic correlation between AFC and FP equal to −0·29, lower than in the current study. In contrast, Boligon et al. (Reference Boligon, Albuquerque, Mercadante and Lôbo2010) studied the genetic association between reproductive traits and body weights in Nellore herds and reported negative genetic correlation estimates between body weights at different ages and AFC ranging from −0·26 to −0·14, lower than the correlation estimates between AFC and W450 found here.
Genetic correlations between HP and STAY with the visual assessment traits and body weight were positive and favourable, indicating that selecting animals of higher body weight and greater BS, FP and MS values should indirectly select females with successful precocity and reproductive longevity traits. Terakado et al. (Reference Terakado, Pereira, Yokoo and Albuquerque2015) observed that the probability of heifers getting pregnant before 16 months of age increased as heifers’ weight also increased. The favourable genetic correlation between HP and W450 (0·23) found in the current study supports this. The genetic correlation between HP and FP indicates a moderate association between sexual precocity and early finishing. It seems that females that are able to deposit fat at early ages could diminish the growth rate and redirect the nutritional resources for reproduction. However, the genetic correlation between BS and HP was not linear and the standard deviation was higher than the estimate. Although these results are indicative only, they suggest that animals with a larger BS require higher nutritional inputs and therefore, larger BS is not favourable to early pregnancy. A higher response would be expected for the reproductive traits, HP, AFC and STAY when selection was applied to FP and MS.
Genetic correlation estimates for STAY with FP and MS (0·26 and 0·24, respectively) were positive and low. These values indicate that animals with better finishing and increased MS tend to stay longer in production in the herd and the selection applied to these traits should bring a long-term response to STAY. There were no studies in the literature correlating the reproductive traits HP and STAY with visual assessment traits using the methodology proposed by Koury Filho et al. (Reference Koury Filho, Albuquerque, Forni, Silva, Yokoo and Alencar2010). Thus, it is suggested that these traits should be further investigated because of their economic importance and the evidence of genetic correlation with other traits important to the production system.
Among the reproductive traits, the genetic correlation between AFC and HP was high (−0·91) and favourable. Thus, the anticipated breeding of heifers should produce a great impact on herd sexual precocity. The genetic correlations of STAY with AFC and HP were moderate and favourable (−0·64 and 0·50, respectively). Thus, animals that become pregnant earlier should have a greater chance of staying up to 76 months of age in the herd, calving at least three times. These results are very promising and show that direct selection for HP should bring a correlated response to both AFC and STAY. The heritability estimates for HP was the highest among the three reproductive traits and has the advantage of being recorded earlier in female life when compared with STAY. Therefore, it is suggested that implementing management systems that enable heifers to breed earlier could represent a major impact on the reproductive traits of the herd, increasing the profitability of farmers that participate in the breeding programme. Van Melis et al. (Reference Van Melis, Eler, Rosa, Ferraz, Figueiredo, Mattos and Oliveira2010) estimated the genetic correlation between HP and STAY equal to 0·64 in Nellore, which was higher than the estimate obtained in the current study and suggested that the precocity of heifers could be used to select animals that are precocious, fertile and that remain productive in the herd. Eler et al. (Reference Eler, Bignardi, Ferraz and Santana2014) estimated the genetic correlations of HP with AFC and STAY equal to −0·85 and 0·73, respectively: they observed a positive genetic correlation between AFC and STAY, equal to −0·60.
Environmental and phenotypic correlations between the studied traits ranged from low to high and had similar magnitude and direction with the genetic correlations. Among these correlations, those estimated for visual traits were the highest and thus, changing the environment and phenotype performance of one of the traits may interfere with the performance of others. Environmental correlations between the visual assessment traits, body weight and HP with STAY and between FP and HP had standard deviation higher than the estimated correlations.
Although the current results indicate that the use of traditional selection criteria for reproductive, growth and visual assessment traits could be feasible for improving Nellore cattle herds, research on genomic selection could also be performed for future genomic predictions in these traits, with special efforts on reproductive traits of females, which usually present low heritability estimates and because some traits are recorded later in life.
CONCLUSIONS
The favourable genetic correlations found in the current study predict that the selection of animals with higher FP and MS scores may aid the production of sexually precocious progenies with better permanence and higher body weight. Based on the moderate heritability values estimated for the HP trait, it is recommended that heifers should be evaluated at an early age, allowing identification and selection of females that are sexually precocious. Therefore, the HP trait should be included in the selection criteria of the Nellore breeding programme.
The authors would like to thank the National Breeders’ and Researchers’ Association (Associação Nacional de Criadores e Pesquisadores; ANCP) for providing the data used in this study. F.M. PATERNO would like to acknowledge CAPES (‘Coordenação de Aperfeiçoamento de Pessoal de Nível Superior’) for the grant received. S.A. QUEIROZ and R.B. LÔBO were supported by a fellowship from the National Council for Scientific and Technological Development (CNPq).