


Throughout 2020, there was frequent news coverage of the actual and potential use of the US military to respond to a range of domestic security challenges: the National Guard conducting coronavirus testing, the active-duty military taking part in the Operation Warp Speed vaccine rollout program, the use (and the lack of use) of the National Guard in response to protests across the political spectrum, the staging of active-duty forces to respond to unrest in Washington, DC, the National Guard doing election cybersecurity, and speculation over the role the active-duty military might play in facilitating a presidential transition. At the same time, the use of force by local police, particularly against Black Americans, triggered widespread protests and became an extremely salient political issue. This created a tension: in many places the police could not maintain order, and their deployment might actually contribute to unrest, but discussion of military alternatives seemed to risk public backlash.
Throughout these events, there was speculation about public attitudes toward these actual and proposed uses of the active-duty military and/or National Guard but surprisingly little empirical evidence regarding these attitudes. While there is a robust comparative literature on the causes and potential consequences of domestic military operations (see Harig, Jenne, and Ruffa Reference Harig, Jenne and Ruffa2022 and Jenne and Martinez Reference Jenne and Martinez2022 for excellent overviews), very little of this literature examines public opinion about these missions (see Flores-Macías and Zarkin Reference Flores-Macías and Zarkin2022, 1378). In the United States, almost no systematic data exist on how the public perceives or feels about such actions.Footnote 1 Moreover, we know little about how US public responses to such domestic events relate to US public opinion about uses of military power more generally. While international relations (IR) and Americanist political scientists examine public perceptions of the legitimacy of military actions abroad, and criminologists explore the legitimacy of policing behavior at home, neither consider (as of the writing of this article) the legitimacy of various domestic uses of the state’s coercive apparatus in the United States.Footnote 2 This is an important gap to address, both for the growing scholarly interest in these types of missions and for the practical need to consider potential responses to election-related and other political violence (as well as other nontraditional security threats), the risk of which has increased in the United States and elsewhere (see Kleinfeld Reference Kleinfeld2021). We draw on these rich literatures to help bridge this gap in the US setting.
Recent events, as well as the literature noted above, suggest multiple questions about how the US public might view the domestic use of coercive state power. What conditions influence the level of public support for domestic uses of coercive state power, and why? How do key factors, such as the instigating event, the responding actor, and the type of action the actor takes, influence public support? In this article, we directly address each of these questions. First, we consider how such perceptions are influenced by the context in which these actors are deployed—the type of event they are responding to. Second, we consider how public perceptions of domestic order operations (including policing actions) are influenced by the actors involved. The National Guard, for example, plays a dual role in the United States. As part of the Total Force, it is a deployable expeditionary operational reserve for the active component of the federal military (Blankshain Reference Blankshain, Beehner, Brooks and Mauer2021; Summers-Lowe Reference Summers-Lowe2019), but as the descendant of the original state militia forces, it is directly subordinate to the governor and plays an explicit domestic order role. We are particularly interested to see whether this special status of the National Guard lends them more legitimacy than the active component of the military in domestic roles or than the police under certain circumstances. Third, and finally, we consider how the type of intervention—that is the mission and whether the actors are armed or unarmed—influences public support for these efforts. We further expect the effects of the actors and intervention types to be conditional on the context in which the intervention is happening.
Some of the factors we investigate seem straightforward. For example, we expect the public to support interventions that are unarmed over those that are armed, those that are focused on providing logistical support rather than order maintenance, and those that are in response to more traditional threat and disaster scenarios rather than in response to political protests.Footnote 3 Other factors, however, are more ambiguous. The public, for example, may prefer local police intervention rather than federal military intervention, or state National Guard rather than either police or the military. Alternatively, the public may view federal forces as more neutral and professionalized than local police or part-time National Guard members (Cohn Reference Cohn, Collins and Hall2022). It is also possible that these factors will interact and, in particular, that the scenario provoking deployment will shape respondents’ preferences over actors and mission types. Finally, we note that how respondents feel about many of these factors may depend on individual-level factors such as partisanship or race. Our research design allows us to examine these possibilities.
We test our predictions using a preregistered conjoint design survey experimentFootnote 4 in which we manipulate four treatments: the type of event provoking a state response (Category-5 hurricane, Black Lives Matter [left] protest, Reopen America [right] protest, potential terrorist attack, and disease outbreak), the intervening actor (the military, active duty military, the National Guard, or police), the purpose of the intervention (provide logistical support or maintain order), and whether the intervening actor is armed or unarmed. Overall, we find that participants favor more limited intervention (except in response to a terrorist threat). When such interventions do occur, participants prefer (i) authorities deploy local police forces or the National Guard over federal military forces, (ii) those actors be unarmed, and (iii) those actors conduct logistical support rather than order maintenance. We further find evidence that support for interventions is conditional upon the instigating event. Most notably, participants are less likely to support the use of federal military forces versus police or National Guard in response to political protests. Yet, respondents (across partisan ID) are less likely to object to an armed or order maintenance response to a Black Lives Matter (BLM) protest than to a Reopen America protest. Finally, we find that Republican respondents are more likely to support interventions during political protests (regardless of the political valence of the protest), order maintenance interventions, and armed interventions.
These findings illuminate several areas of scholarly and public interest. First, while some research suggests that domestic deployments do not necessarily negatively affect public confidence in the military within the United States (Cohn Reference Cohn, Collins and Hall2022; Snyder Reference Snyder2020), we do find that the public views an intervention by the regular military as somewhat less desirable or legitimate than one conducted by police or the National Guard. This adds yet another wrinkle to the literature on what constitutes “confidence” in the military and what factors affect it. Second, our findings support other research that indicates that the US public in general objects to intrusive, armed, order maintenance interventions, regardless of which actor is doing it and across a range of instigating events (though less so in response to traditional security threats). Republicans are, however, more accepting of this type of intervention. This reinforces the need to disaggregate public opinion in studies on civil-military and civil-police relations, as it is clear that such views can differ widely among groups.
PRETTY PRUDENT? US PUBLIC SUPPORT FOR MILITARY MISSIONS
Scholars of IR and US foreign policy have long been interested in the question of what factors influence public support for military operations abroad, finding that the US public maintains some fairly consistent attitudes in this realm (e.g., Holsti Reference Holsti2004; Shapiro and Page Reference Shapiro and Page1988). This extensive body of research shows that public support for such operations is influenced by a variety of factors, including beliefs about mission legitimacy (Gelpi, Feaver, and Reifler Reference Gelpi, Feaver and Reifler2005; Reference Gelpi, Feaver and Reifler2009; Jentleson Reference Jentleson1992; Jentleson and Britton Reference Jentleson and Britton1998; Reifler et al. Reference Reifler, Clarke, Scotto, Sanders, Stewart and Whiteley2014), expectations about the costs of the mission (Caverley Reference Caverley2014; Flores-Macías and Kreps Reference Flores-Macías and Kreps2017; Gartner and Segura Reference Gartner and Segura1998; Horowitz and Levendusky Reference Horowitz and Levendusky2011; Kriner, Lechase, and Cappella Zielinski Reference Kriner, Lechase and Zielinski2018; Mueller Reference Mueller1973; Reifler et al. Reference Reifler, Clarke, Scotto, Sanders, Stewart and Whiteley2014; Russett Reference Russett1990), whether the president is of the respondent’s party or not (Burbach Reference Burbach2019), what other party elites are cuing (Bartels Reference Bartels2002; Berinsky Reference Berinsky2007; Reference Berinsky2009; Zaller Reference Zaller1992),Footnote 5 whether there is elite consensus or dissensus (Berinsky Reference Berinsky2007; Reference Berinsky2009; Zaller Reference Zaller1992), and perceptions of or expectations about success (Eichenberg Reference Eichenberg2005; Gelpi, Feaver, and Reifler Reference Gelpi, Feaver and Reifler2005; Reference Gelpi, Feaver and Reifler2009).
Jentleson and Britton (Reference Jentleson and Britton1998) sort military operations abroad into three categories—Foreign Policy Restraint, Internal Political Change, and Humanitarian Intervention—and find that the public consistently supports certain types of missions more than others. Their research posits that the underlying mechanism for this differential support lies in a combination of the differences in how the public perceives the legitimacy and likely effectiveness of these operations. Missions likely to be perceived as legitimate and effective—particularly those categorized as Foreign Policy Restraint, or what might be thought of as classic defense of sovereignty missions—receive the highest levels of public support (see also Kiratli Reference Kiratli2023). Those that are likely to be perceived as illegitimate or less effective—particularly missions classified as Internal Political Change—receive the least public support. Gelpi, Feaver, and Reifler (Reference Gelpi, Feaver and Reifler2005; Reference Gelpi, Feaver and Reifler2009) explicitly test these mechanisms, finding that both the perceived legitimacy of a military operation and expectations of its success do in fact matter for public support, with success mattering more than legitimacy. Beliefs about mission and/or actor legitimacy and expectations of success may also shape support for domestic missions, but we know little about what the US public views as legitimate in the domestic realm or what types of interventions they expect to be successful.
There is also a robust political science literature regarding the factors that generally shape public support for domestic issues within the United States.Footnote 6 Here, we know that partisanship, ideology, elite cues, media coverage, race/ethnicity, gender, and a host of other demographic factors matter. All this leads us to expect more legitimacy for less politicized missions and more straightforward threats. Yet, little if any of this work explicitly considers the issue of support for domestic military interventions within the USA. This literature also tends to remain separate from the sociology- and criminology-heavy literature on policing and police legitimacy (see Bottoms and Tankebe Reference Bottoms and Tankebe2012; Tankebe Reference Tankebe, Reisig and Kane2014; Worden and McLean Reference Worden and McLean2017). Indeed, public opinion research on policing and police legitimacy tends to focus on slightly different dependent variables than research on military operations abroad. As a result, these two literatures do not speak directly to one another.
Across the literature on public opinion toward US foreign policy, the common dependent variable is public support for military operations or missions, which is believed to be based on public beliefs about the legitimacy of the mission and its likelihood of success. In contrast, the dependent variable in studies of policing is usually the legitimacy of the actor, generally believed to derive from the police’s procedural justice (Tyler Reference Tyler2004; Reference Tyler2006; Worden and McLean Reference Worden and McLean2017) and possibly from the public’s identity with the groups or power structures supported by the police (Bradford, Milani, and Jackson Reference Bradford, Milani and Jackson2017). Thus, while legitimacy is an important variable in studies focused on foreign policy, it is usually applied to understand support for the mission rather than the actor conducting that mission (i.e., the military organization itself). Indeed, the legitimacy of the military organization is largely assumed, at least in the context of research on US public opinion. The same, however, cannot be said of police organizations in the USA (or in many other countries). One of our aims, therefore, is to begin to bridge this gap in the literature by investigating public support of different types of policing missions as well as public attitudes about the legitimacy of different actors performing those missions.Footnote 7 Indeed, we believe that the type of actor engaging in such missions may be a critical component for perceptions of legitimacy and effectiveness.
Finally, there is a large comparative literature on domestic uses of militaries. Comparativists, particularly those that focus on Latin America, examine (i) how the public responds to the constabularization of military forces (i.e., their use for policing and civil order purposes) and (ii) how the domestic use of such military forces affects civilians. Recent evidence clearly shows that publics across Latin America support the domestic use of military forces and perceive these actors to be more effective than local or federal police forces, despite clear evidence that employing the military domestically increases civilian harms (e.g., Blair and Weintraub Reference Blair and Weintraub2023; Flores-Macías and Zarkin Reference Flores-Macías and Zarkin2021; Reference Flores-Macías and Zarkin2024; Harig Reference Harig2020; Pion-Berlin Reference Pion-Berlin2017). Further evidence from across Africa and the Middle East indicates that publics can clearly differentiate between different types of militarized and policing actors (e.g., Revkin Reference Revkin2022), and publics are sensitive to the use of violence by such authorities (e.g., Curtice and Behlendorf Reference Curtice and Behlendorf2021) but also that militaries generally enjoy much higher levels of trust and public legitimacy than police—as is also the case in the USA. We believe it is important to examine how these dynamics may play out in the USA, especially given the distinct historical context and civil-military relations exhibited across states (see De Bruin and Karbatak Reference De Bruin and Karabatak2022).
PRUDENCE AT HOME: TRANSLATING US PUBLIC SUPPORT INTO A DOMESTIC CONTEXT
The question then becomes: how do these concepts translate into public support for the use of coercive state power in the US domestic context? While Jenne and Martinez (Reference Jenne and Martinez2022) argue that the legal and constitutional structure will both influence and be influenced by domestic uses of the military, Cohn (Reference Cohn, Collins and Hall2022) argues that the legal context for such use in the USA is both permissive and rather stable and that the more important question (for understanding effects on public opinion) is what roles the public believes are legitimate. We further argue that perceptions of role legitimacy will likely be linked to support—especially when an organization is deployed to complete a task not normally associated with it, such as when actors who typically operate in the international realm are asked to do so domestically. We saw above that beliefs about mission legitimacy are linked to support for military operations abroad, and Tyler (Reference Tyler2004) notes that support for police and policing is linked directly to perceptions of the legitimacy of their presence and behavior. Thus, there is a clear concept that perceptions of legitimacy of action should influence public support for the use of the organization. The difficulty we currently face in the US context is that we lack information on the public’s views of the relative legitimacy of different actors engaging in different domestic roles.
The literature on police legitimacy generally finds that two of the main factors influencing such perceptions are procedural legitimacy (e.g., do the police behave in ways that people perceive as fair, even if they do not like the outcome?) (Jackson et al. Reference Jackson, Huq, Bradford and Tyler2013; McCluskey, Mastrofski, and Parks Reference McCluskey, Mastrofski and Parks1999; Tyler Reference Tyler2004) and “Order Maintenance Policing” techniques (e.g., stop and frisk techniques decrease police legitimacy) (Fagan and Davies Reference Fagan and Davies2000; Gau and Brunson Reference Gau and Brunson2010). Accordingly, this drives our argument to focus on four key factors that can influence the perceived legitimacy of the domestic use of coercive state power: (i) the instigating event type, (ii) the actor deployed, (iii) the purpose of the mission, and (iv) the type of intervention used.
First, we hypothesize that public support for state coercive force will vary by the instigating event. More specifically, we anticipate the public will be more supportive of responses to traditional security threats rather than toward social issues, such as protests, or for other humanitarian purposes, such as in response to disease outbreaks. Our intuition here is in part motivated by the findings of the military operations literature that shows that the US public sees “realpolitik” or more “objective” threat missions as more legitimate for the military than those focused on more interventionist aims (Gelpi, Feaver, and Reifler Reference Gelpi, Feaver and Reifler2005; Reference Gelpi, Feaver and Reifler2009; Jentleson and Britten Reference Jentleson and Britton1998; Kiratli Reference Kiratli2023). Translating this to a domestic contest would suggest that the public may be more supportive of responses to traditional security threats. These types of events are also far more likely to generate elite consensus on the response. Moreover, recent studies from criminology and sociology show that the public generally opposes policing tactics during protests (Metcalfe and Pickett Reference Metcalfe and Pickett2022; Revkin Reference Revkin2022).
H1: Public support for use of state coercive force will vary by the instigating event type. Public support for different agents, missions, and types of intervention may also vary by instigating event type.
Second, we hypothesize that public support for the domestic use of state coercive force will vary by the actor being deployed. In particular, we anticipate that the public will be more supportive of the domestic use of the National Guard and less supportive of active-duty military use across scenarios but are agnostic as to whether they will prefer police to the military actors or not. On the one hand, conservatives in the USA tend to favor state or local over federal control (Rendlemen and Rogowski Reference Rendlemen and Rogowski2024), and some comparative research indicates that publics (in this case, in Iraq) can distinguish between the actions of federal versus local police, preferring action by local forces who may be viewed as more restrained (Revkin Reference Revkin2022). As mentioned above, there is also evidence that the use of military forces for domestic missions increases harm to civilians (Blair and Weintraub Reference Blair and Weintraub2023; Flores-Macías and Zarkin Reference Flores-Macías and Zarkin2021; Reference Flores-Macías and Zarkin2024). In the US context, Mummolo (Reference Mummolo2018) notes that police forces that look more militarized enjoy lower public confidence.
On the other hand, publics may be more supportive of the use of military or National Guard personnel for two reasons. First, there is extensive evidence that the US public at large holds the military in high confidence (e.g., Burbach Reference Burbach2019; Kennedy, Tyson, and Funk Reference Kennedy, Tyson and Funk2022; Lupton and Webb Reference Lupton and Webb2022; Margulies and Blankshain Reference Margulies and Blankshain2022). Evidence from Latin America suggests that police forces who look more like military forces are perceived as more effective (Flores-Macías and Zarkin Reference Flores-Macías and Zarkin2022). Indeed, Latin American publics appear to trust the military—rather than the police—to exercise better restraint and to better respect human rights (Pion-Berlin and Carreras Reference Pion-Berlin and Carreras2017)Footnote 8 and are increasingly acceptant of the domestic use of the military (Harig Reference Harig2022). Even more so, this increased trust in the military coincides with reduced public support for police operations (Sung Capellan, and Barthuly Reference Sung, Capellan and Barthuly2022). Second, the increased politicization of police forces in the US context may undermine this public trust, especially among certain segments of American society (see Kennedy, Tyson, and Funk Reference Kennedy, Tyson and Funk2022). This may be especially true as such politicization has been accompanied by an increased militarization of police forces (see Kraska Reference Kraska2007; Moule, Fox, and Parry Reference Moule, Fox and Parry2019). Thus, it is possible that the direction of this relationship between public support for domestic force and the actor employed could go either way.
H2: Public support for domestic force will vary by actor.
Third, we hypothesize th1at mission type can further shape public support for state coercive force. More specifically, we anticipate that the US public will be more resistant to interventions whose purpose is to maintain order, as opposed to missions that primarily involve providing logistical support. Our intuition here is again linked to trends in policing. Order Maintenance Policing (Fagan and Davies Reference Fagan and Davies2000; Kelling and Wilson Reference Kelling and Wilson1982) and a police culture of easy resort to force (Cohn Reference Cohn2020; Kraska Reference Kraska2007) negatively affect both crime (i.e., they increase it) and public trust (Metcalfe and Pickett Reference Metcalfe and Pickett2022; Mummolo Reference Mummolo2018; Nix, Ivanov, and Pickett Reference Nix, Ivanov and Pickett2021). These findings hold beyond the US context. Research shows, for example, that excessive police actions in Uganda can lead to public backlash against these actors and against the state (Curtice and Behlendorf Reference Curtice and Behlendorf2021). Accordingly, we believe these actions will not only be seen as less legitimate but will also garner less public support. Logistical support, on the other hand, tends to be viewed positively (Berndtsson and Ledberg Reference Berndtsson and Ledberg2023, 2–4; Durán et al. Reference Durán, Expósito, López and Martínez2023).
H3: Public support for the domestic use of force will vary by mission type.
Fourth, and finally, we hypothesize that support for the domestic use of force will further vary by the type of intervention employed—armed or unarmed. More precisely, we anticipate that the US public will be more resistant to armed interventions. As noted above, there is evidence that militarized policing reduces perceptions of legitimacy in the context of the USA (Bieler Reference Bieler2016; Moule, Fox, and Parry Reference Moule, Fox and Parry2019).Footnote 9 Mummolo (Reference Mummolo2018), for example, finds that images of heavily armed or militarized police forces reduces public support for police funding and for increased police patrols. Research on Latin America further suggests that it is often difficult for militaries to perform constabulary duties effectively, even when they are trained to do so (Harig Reference Harig2020; Pion-Berlin Reference Pion-Berlin2017). Similarly, research from African politics shows that violent and repressive police action can spur collective dissent against authorities (Curtice and Behlendorf Reference Curtice and Behlendorf2021). And recent work indicates that armed policing may induce negative US public responses in some contexts (see Yesberg Brunton-Smith, and Bradford Reference Yesberg, Brunton-Smith and Bradford2021).
H4: Public support for the domestic use of force will vary by type of intervention.
In addition, and as we explain in more detail later in this study, we further consider the underlying causal mechanisms behind these hypothesized relationships. As suggested by the literatures discussed above, particularly following Gelpi, Feaver, and Reifler (Reference Gelpi, Feaver and Reifler2005), we expect that perceptions of legitimacy and effectiveness of the missions and actors drive public support for and warmth toward these operations. Furthermore, we consider how our identified factors may interact with one another. Most notably, it is likely that the instigating event may condition participants’ perceptions of the other aspects of an intervention. For example, the public may support a specific actor intervening in response to a terrorist attack, but not a disease outbreak.
RESEARCH DESIGN
To test each of our hypotheses, we conduct a conjoint design survey experiment in which we observe how participants perceive distinct domestic uses of state coercive power. More specifically, we assess how factors such as the type of event, the type of actor, and the type of intervention matter for public perceptions of approval, legitimacy, and effectiveness. Conjoint design experiments have been employed to address a wide variety of issues across international relations, American politics, and comparative politics. The primary advantage of conjoint designs, when compared to more traditional factorial designs, is their ability to “assess the effect of one factor and compare this effect to the effect of various other factors” (Knudsen and Johannesson Reference Knudsen and Johannesson2019, 2). Accordingly, they are particularly well suited to study outcomes that can have numerous contributing factors.
Survey Design
Participants in the survey read a series of vignettes in which they are told about “a government response to a domestic incident.” It is made clear to the respondents that “all situations are hypothetical.” After reading each vignette, participants answer a series of questions meant to gauge their approval and feelings toward the situation, as well as their perceptions of the legitimacy and effectiveness of the use of coercive state power domestically (see Bell Reference Bell1982; Burbach Reference Burbach2019; Johnson Reference Johnson2005). Please note that at no point in the survey do we use the term “coercive state power” when describing the situation to participants. Participants engage in three rounds of decision-making, viewing, and responding to three distinct randomly assigned treatments propagated using the Conjoint Design Survey Tool (Strezhnev et al. Reference Strezhnev, Hainmueller, Hopkins and Yamamoto2014).
The experiment is a 5 × 4 × 2 × 2 design allowing for 80 distinct combinations. The first treatment varies the type of event to which the state responds and has five levels: “a Category-5 Hurricane,” “a Black Lives Matter (BLM) protest,” “a Reopen America protest,”Footnote 10 “a threat of multiple car bombs to be detonated by a terrorist organization,” and “an outbreak of a highly contagious and deadly disease.” For our analyses, we employ the Category-5 Hurricane response as the baseline category, as it is the most politically neutral. We include two distinct types of protests here to capture the ideological diversity of recent protests, with the BLM condition representing a left-leaning protest and the Reopen America condition representing a right-leaning protest. The second treatment considers the type of actor who responds to the event and has four levels: “the police,” “state-controlled National Guard personnel,” “the military,” and “active-duty military personnel.” Here, we employ the police as the baseline category. We use the police as our baseline as they are the default law enforcement and emergency response organization. For the sake of comprehension and accuracy, the vignette also indicates which authority invoked the responding actor.Footnote 11 We did this primarily to distinguish the federal actors (“the military” and “the active-duty military”) from the state actors (the National Guard). Future work could further investigate the specific question of whether the public responds differently to state versus federal use of National Guard forces. We also believe it is important to include both “the military” and “active-duty military personnel” as the military is a more ambiguous term that includes a host of personnel engaged in distinct activities and with different designations (such as the reserve component and the National Guard). Including both conditions will provide more insight on what the public thinks of when they hear “the military.” The third treatment focuses on the type of intervention performed by the responding actor and has two levels: “provide transportation and distribute supplies” and “maintain order.” The former serves as our baseline. The final treatment focuses on whether the responding actor is armed and has two levels: “unarmed” and “armed.” We employ unarmed as the baseline here.
Measuring Outcomes of Interest
After reading each vignette, participants are asked a series of questions to gauge their approval of the intervention, as well as their perceptions of the legitimacy and effectiveness of the intervention. We measure each of these perceptions with multiple constructs, as this improves response reliability as well as external and internal validity (McDermott Reference McDermott2002). To this end, we purposely employ multiple DVs for each concept we measure. Furthermore, we derive each of our DVs from the literatures noted earlier. Work from studies in sociology and policing largely focus on perceptions of legitimacy, while studies from comparative politics instead examine questions of public confidence and perceptions of effectiveness. Accordingly, we include DVs that speak directly to these literatures. We measure each of our DVs on a 7-point scale, as they are more reliable and precise than 5-point scales (see Russo et al. Reference Russo, Tomei, Serra and Mello2021).
Regarding approval, we first ask participants whether they “approve” or “disapprove” of the intervention as a binary measure. We then follow this up by immediately asking their level of approval along a 7-point scale ranging from “strongly approve” to “strongly disapprove.” As an additional DV to measure participants’ approval, we ask participants how they “feel about this situation.” They are then able to rate their feelings on a 7-point scale ranging from “very warm or favorable” to “very cold or unfavorable.” The inclusion of this measure allows us to further gauge participants’ overall feelings toward the action.
In addition to approval, our main outcomes of interest focus on perceptions of effectiveness and legitimacy of the intervention. We measure effectiveness in two ways. First, participants are asked to indicate on a 7-point scale how “effective or ineffective” they think the action will be. Second, participants rate on a 7-point scale the extent to which they think the actor will do a “good or bad job in this situation.” Regarding legitimacy, we ask participants to directly rate on a 7-point scale how “legitimate or illegitimate” they think the action is. As a synonym for legitimacy, we also ask them to indicate on a 7-point scale how “appropriate or inappropriate” they think it is to deploy the actor in the given situation. These alternate wordings are used as a robustness check on sometimes difficult-to-interpret terms like “legitimacy” and “effectiveness.”
Additional Measures
In addition to measuring our primary outcomes of interest, we also include questions to gauge participants’ views on the government and civil liberties. We ask these after the treatments so as not to prime the participants. We also ask a standard battery of questions regarding ideology, partisanship, race/ethnicity, age, income, regional location, feelings toward Donald Trump, and whether the participant or an immediate family member has ever served in the armed forces or been a police officer. Research indicates that this number of decision tasks does not overwhelm participants or undermine response quality and response rate (Bansak et al. Reference Bansak, Hainmueller, Hopkins and Yamamoto2018; Jenke et al. Reference Jenke, Bansak, Hainmueller and Hangartner2021).
Participant Selection and Demographics
We administered our survey through Qualtrics and used their panel service for participant recruitment. Our survey was IRB approved prior to launch and preregistered with EGAP prior to data analysis. Our sample consists of 1,241 US respondents which Qualtrics quota-sampled to match the census on age, education, and sex.Footnote 12 We fielded the survey between 28 July and 14 August 2020. A small pilot began on 28 July, and we fully launched the survey on 3 August. Our nation-wide sample is highly reflective of the US adult population and closely matches census data on key demographics. For example, 50.8% of our sample identify as female. Regarding partisanship, 36.7% of our sample identify as Democrats, while 29.3% identify as Republicans. Just under two-thirds of our sample (63.1%) have at least some college education and 11.4% of the sample hold a graduate degree.
RESULTS
Following Hainmueller and Hopkins (Reference Hainmueller and Hopkins2015) and Hainmueller, Hopkins, and Yamamoto (Reference Hainmueller, Hopkins and Yamamoto2014), among others, the attributes presented to participants in the conjoint design were randomized. As is standard for conjoint design analyses, we estimate average marginal component effects (AMCEs). Each of the figures presented shows the point estimates and 95% confidence intervals of our regression analysis. As with other conjoint design analyses, the effects should be interpreted in relation to the reference levels shown in the figures. For each treatment, we chose what we believe to be the most neutral category as our baseline reference level.
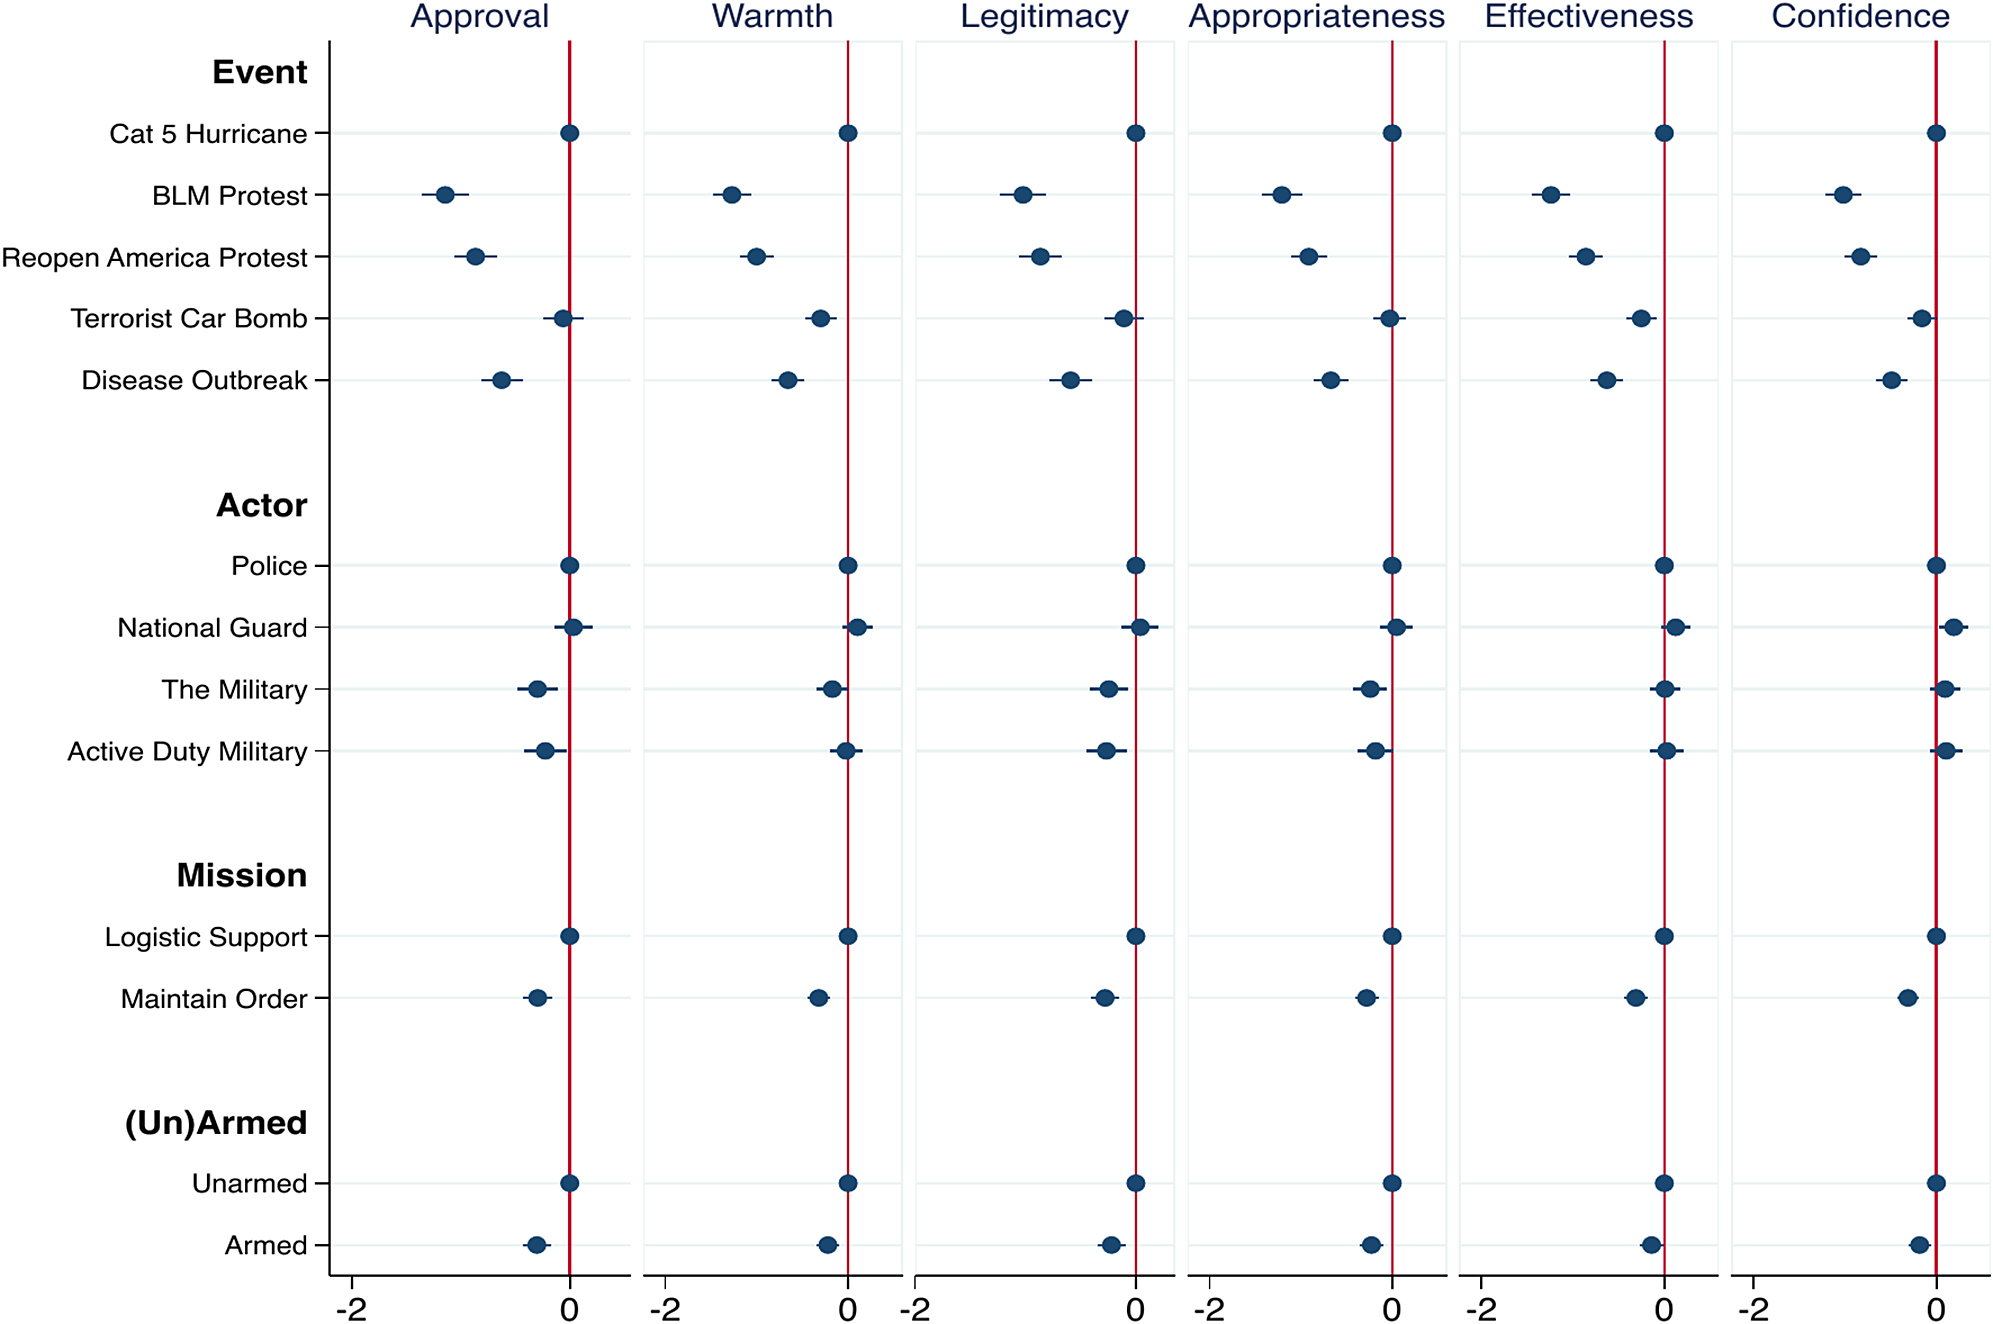
We begin by first examining the unconditional AMCEs across each of our DVs, as shown in Figure 1. In doing so, we find remarkably consistent results. Most notably, participants view interventions in response to a BLM protest, a Reopen America protest, and a disease outbreak more negatively than in response to a Category-5 hurricane (the baseline), with these effects being statistically significant across each of our six DVs. Thus, participants are skeptical of interventions into politically motivated situations, such as political protests, and these effects are particularly strong for the BLM protest treatment. We also find that participants are more skeptical of interventions focused on maintaining order (rather than providing logistic support) and that are armed (rather than unarmed), with these effects being negative and statistically significant when compared to the appropriate baseline across each of our six DVs. We also find some evidence that participants are more skeptical of interventions by the military, although these results are less consistent across our DVs.
Perceptions of DVs
Note: Dots represent OLS estimates with 95% confidence intervals. Coefficients reflect the change in approval and warmth for each attribute relative to the baseline category. Baseline categories are depicted as dots without confidence intervals. Full regression results available in Supplementary Table 1A.

These findings suggest that, even in a context of increased domestic uses of the military and significant negativity toward police forces, popular feeling is more skeptical of military versus police interventions. Furthermore, the public is rather skeptical of various types of militarized responses, including in that definition armed responses and order maintenance responses as well as intervention by a military actor. This raises questions about the direction in which policing has been moving for the last several decades, an issue we explore further in our concluding discussion. Overall, our findings thus far indicate that participants favor limited interventions, but that when interventions do occur, participants prefer: (i) authorities deploy local actors rather than military personnel, (ii) those actors be unarmed, and (iii) those actors provide logistical support rather than maintain order. Furthermore, the results of these analyses indicate that the substantive effects of event type are particularly strong, an issue which we explore in further detail below.
Disentangling the Role of Event Type
We expect that respondent’s views on the type of intervention will vary by event. In our experimental construct, we assigned participants to be evenly distributed across event types. We, in some ways, model our different scenarios along Jentleson and Britton’s (Reference Jentleson and Britton1998) three Principal Policy Objectives: a threatened terrorist attack is the most like a conventional and objective threat requiring some kind of policing response, à la their Foreign Policy Restraint. Protests of different political stripes are most like their Internal Political Change, involving valence issues and deeply subjective perceptions of threat, as well as less clarity about how useful or necessary coercive force will be. Natural disasters like hurricanes or pandemics are somewhat akin to their Humanitarian Interventions: clearly a need for some intervention but unclear who should do it.Footnote 13
Thus, it is likely that the effects of our treatments may vary based on the type of event instigating the intervention. Indeed, our analysis of unconditional AMCEs (presented in Figure 1) indicates that varying the event type had the largest substantive effect on participant attitudes. We have no expectation that these events are equally likely to occur in the real world. As a result, unconditional AMCEs may provide a misleading picture of the public’s overall attitudes toward interventions. For example, numerous analysts noted the incredible disparity in police presence, and activity, between BLM protests and the January 6 insurrection at the Capitol (Booker Reference Booker2021; Eligon Reference Eligon2021; Koerth Reference Koerth2021). Statistical evidence from the ACLED dataset shows that US police forces are more likely to intervene during left-wing protests than during right-wing protests and are more likely to use violence against the former, rather than the latter.Footnote 14
Accordingly, we next focus our analysis on disaggregating the influence of our actor and mission type treatments by event type across each of our DVs. In doing so, we believe we can provide further insight into how the public makes calculations about their support for intervention into different instigating events. To examine the influence of event type, we once again estimate AMCEs, but we now disaggregate these effects based on the intervening event. In the figures that follow, we present the point estimates and 95% confidence intervals of our regression analyses. To get a better understanding of the substantive effects of our results, we also report unadjusted marginal means in the text in terms of scale points (sp), following reporting recommendations by Leeper, Hobolt, and Tilley (Reference Leeper, Hobolt and Tilley2020).Footnote 15
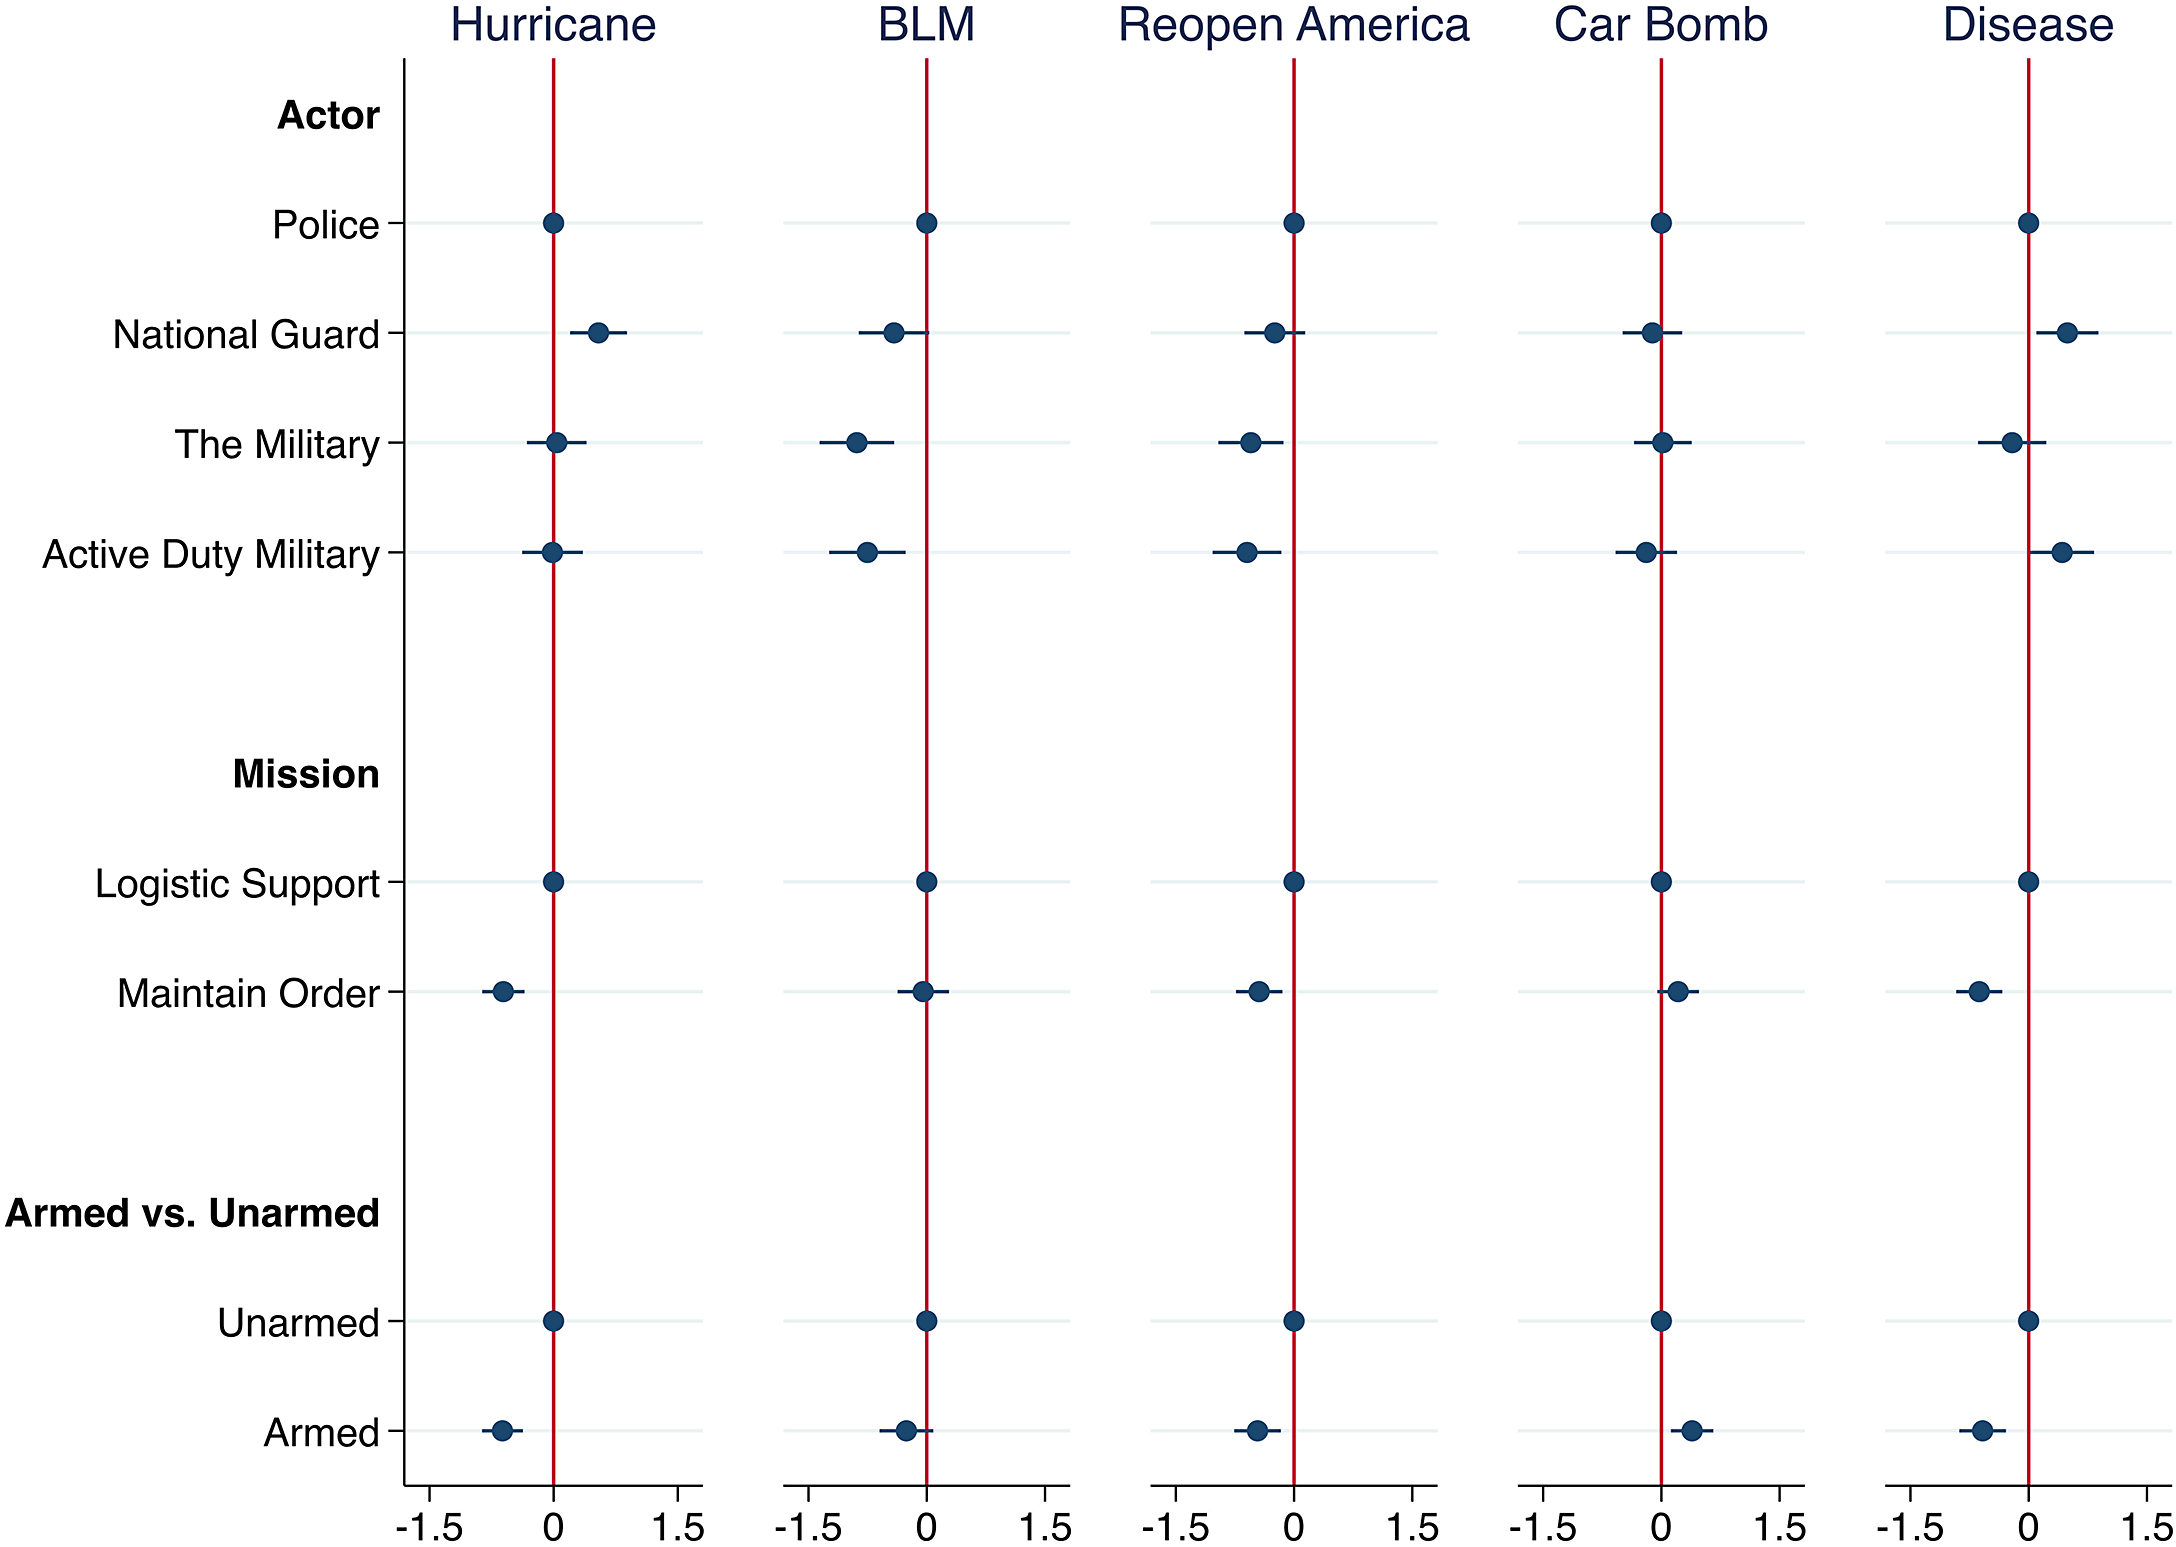
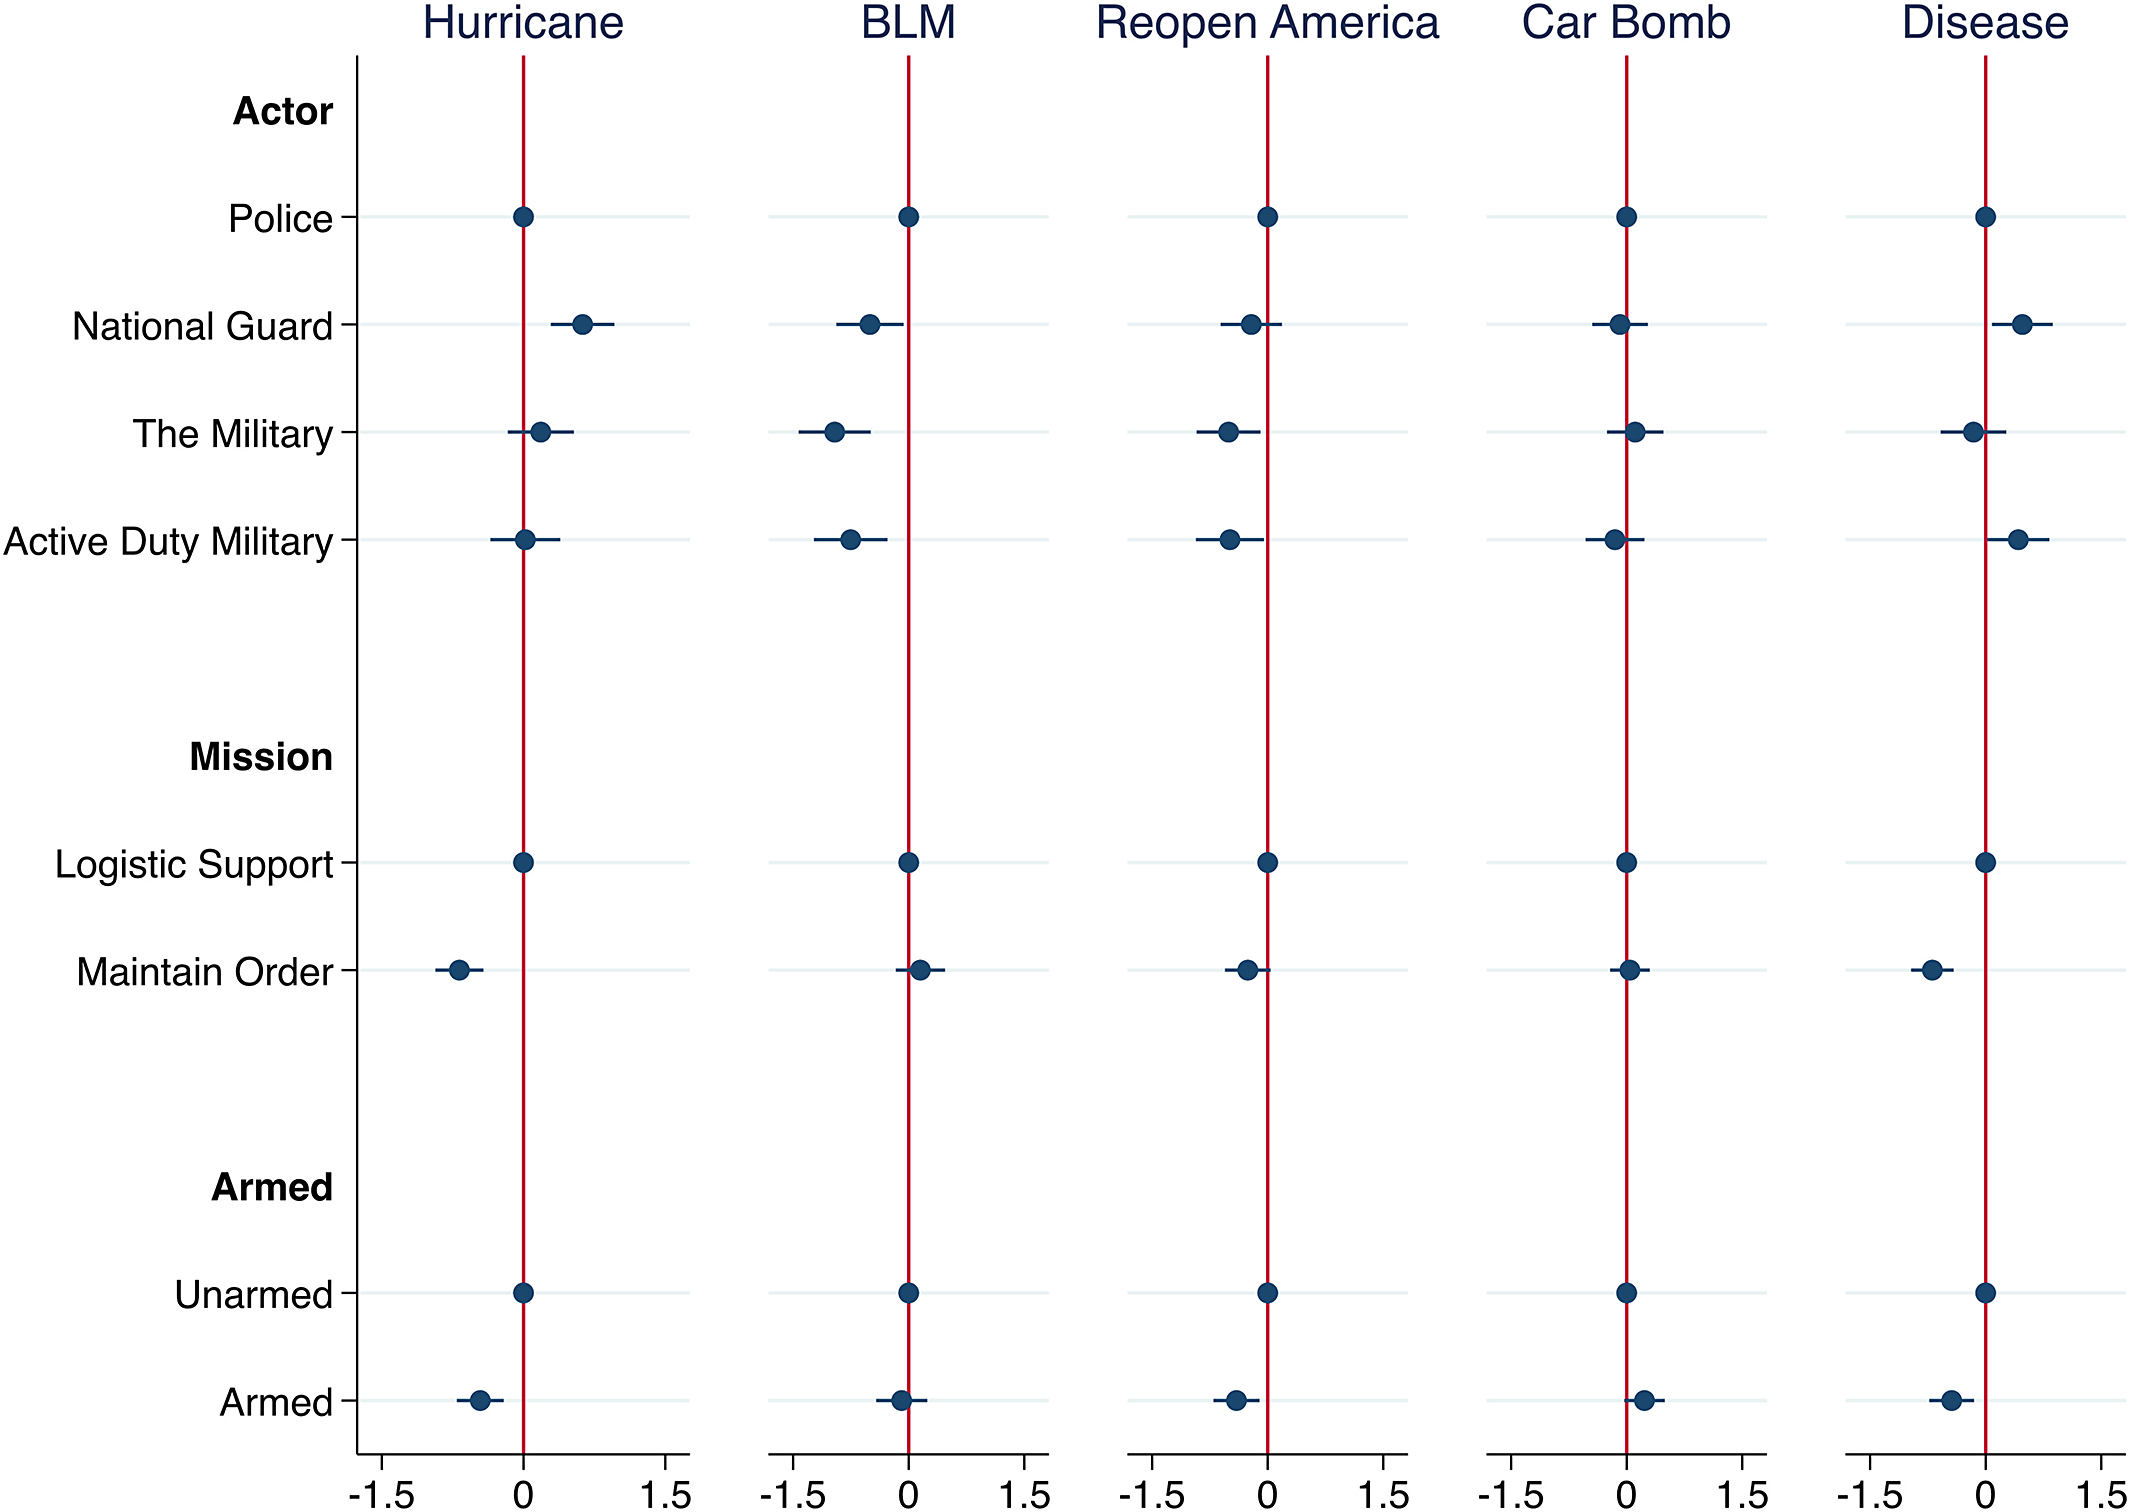
Beginning with perceptions of approval, and as shown in Figure 2, we find that participants’ approval of distinct types of intervention is correlated with the instigating event. Most notably, we see variation in approval based on the intervening actor. Use of the National Guard (as compared with the police) increases intervention approval by 0.54sp (CI: 0.58, 0.50; p: 0.002) in response to a Cat-5 hurricane, and by 0.49sp (CI: 0.51, 0.47; p: 0.014) in response to a disease outbreak. In contrast, use of the military reduces intervention approval by 0.89sp (CI: −0.89, −0.88; p: 0.000) in response to a BLM protest and by 0.55sp (CI: −0.61, −0.49; p: 0.009) in response to a Reopen America protest. Similarly, use of active-duty military personnel reduces intervention approval by 0.75sp (CI: −0.76, −0.75; p: 0.002) when deployed in response to a BLM protest and by 0.60sp (CI: −0.67, −0.53; p: 0.007) in response to a Reopen America Protest. Substantively, our results regarding BLM protests are particularly impactful here as this equates to a 23.4% reduction in approval when “the military” are deployed and a 19.9% reduction in approval when “active-duty military” are used. We also find that the use of such active-duty military personnel increases intervention approval by 0.42sp (CI: 0.43, 0.42; p: 0.040) when deployed during a disease outbreak.
Approval by Intervention Event
Note: Dots represent OLS estimates with 95% confidence intervals. Coefficients reflect the change in approval for each attribute relative to the baseline category. Baseline categories are depicted as dots without confidence intervals. Full regressions available in Supplementary Table 5A.

We next examine the effect of mission type and whether the intervening actor is (un)armed. We find that participants are more skeptical of missions focused on maintaining order (when compared with those focused on logistical support). Here, order maintenance operations reduce approval by 0.61sp (CI: −0.63, −0.58; p: 0.000) when used in response to a Cat-5 hurricane, by 0.44sp (CI: −0.45, −0.44; p: 0.003) when deployed in response to a Reopen America protest, and by 0.63sp (CI: −0.64, −0.61; p: 0.000) when used during a disease outbreak. Armed interventions (when compared with unarmed interventions) also reduce approval by 0.62sp (CI: −0.64, −0.59; p: 0.000) when used in response to a Cat-5 hurricane, by 0.46sp (CI: −0.49, −0.44; p: 0.000) when deployed in response to a Reopen America protest, and by 0.58sp (CI: −0.63, −0.54; p: 0.002) when employed during a disease outbreak. In contrast, armed intervention increases approval by 0.39sp (CI: 0.42, 0.36; p: 0.004) when used in response to a terrorist car bomb threat. It is important to note that participants are not less likely to reduce their approval for order maintenance or armed interventions toward BLM protests, despite these factors reducing their approval when used toward Reopen America protests.
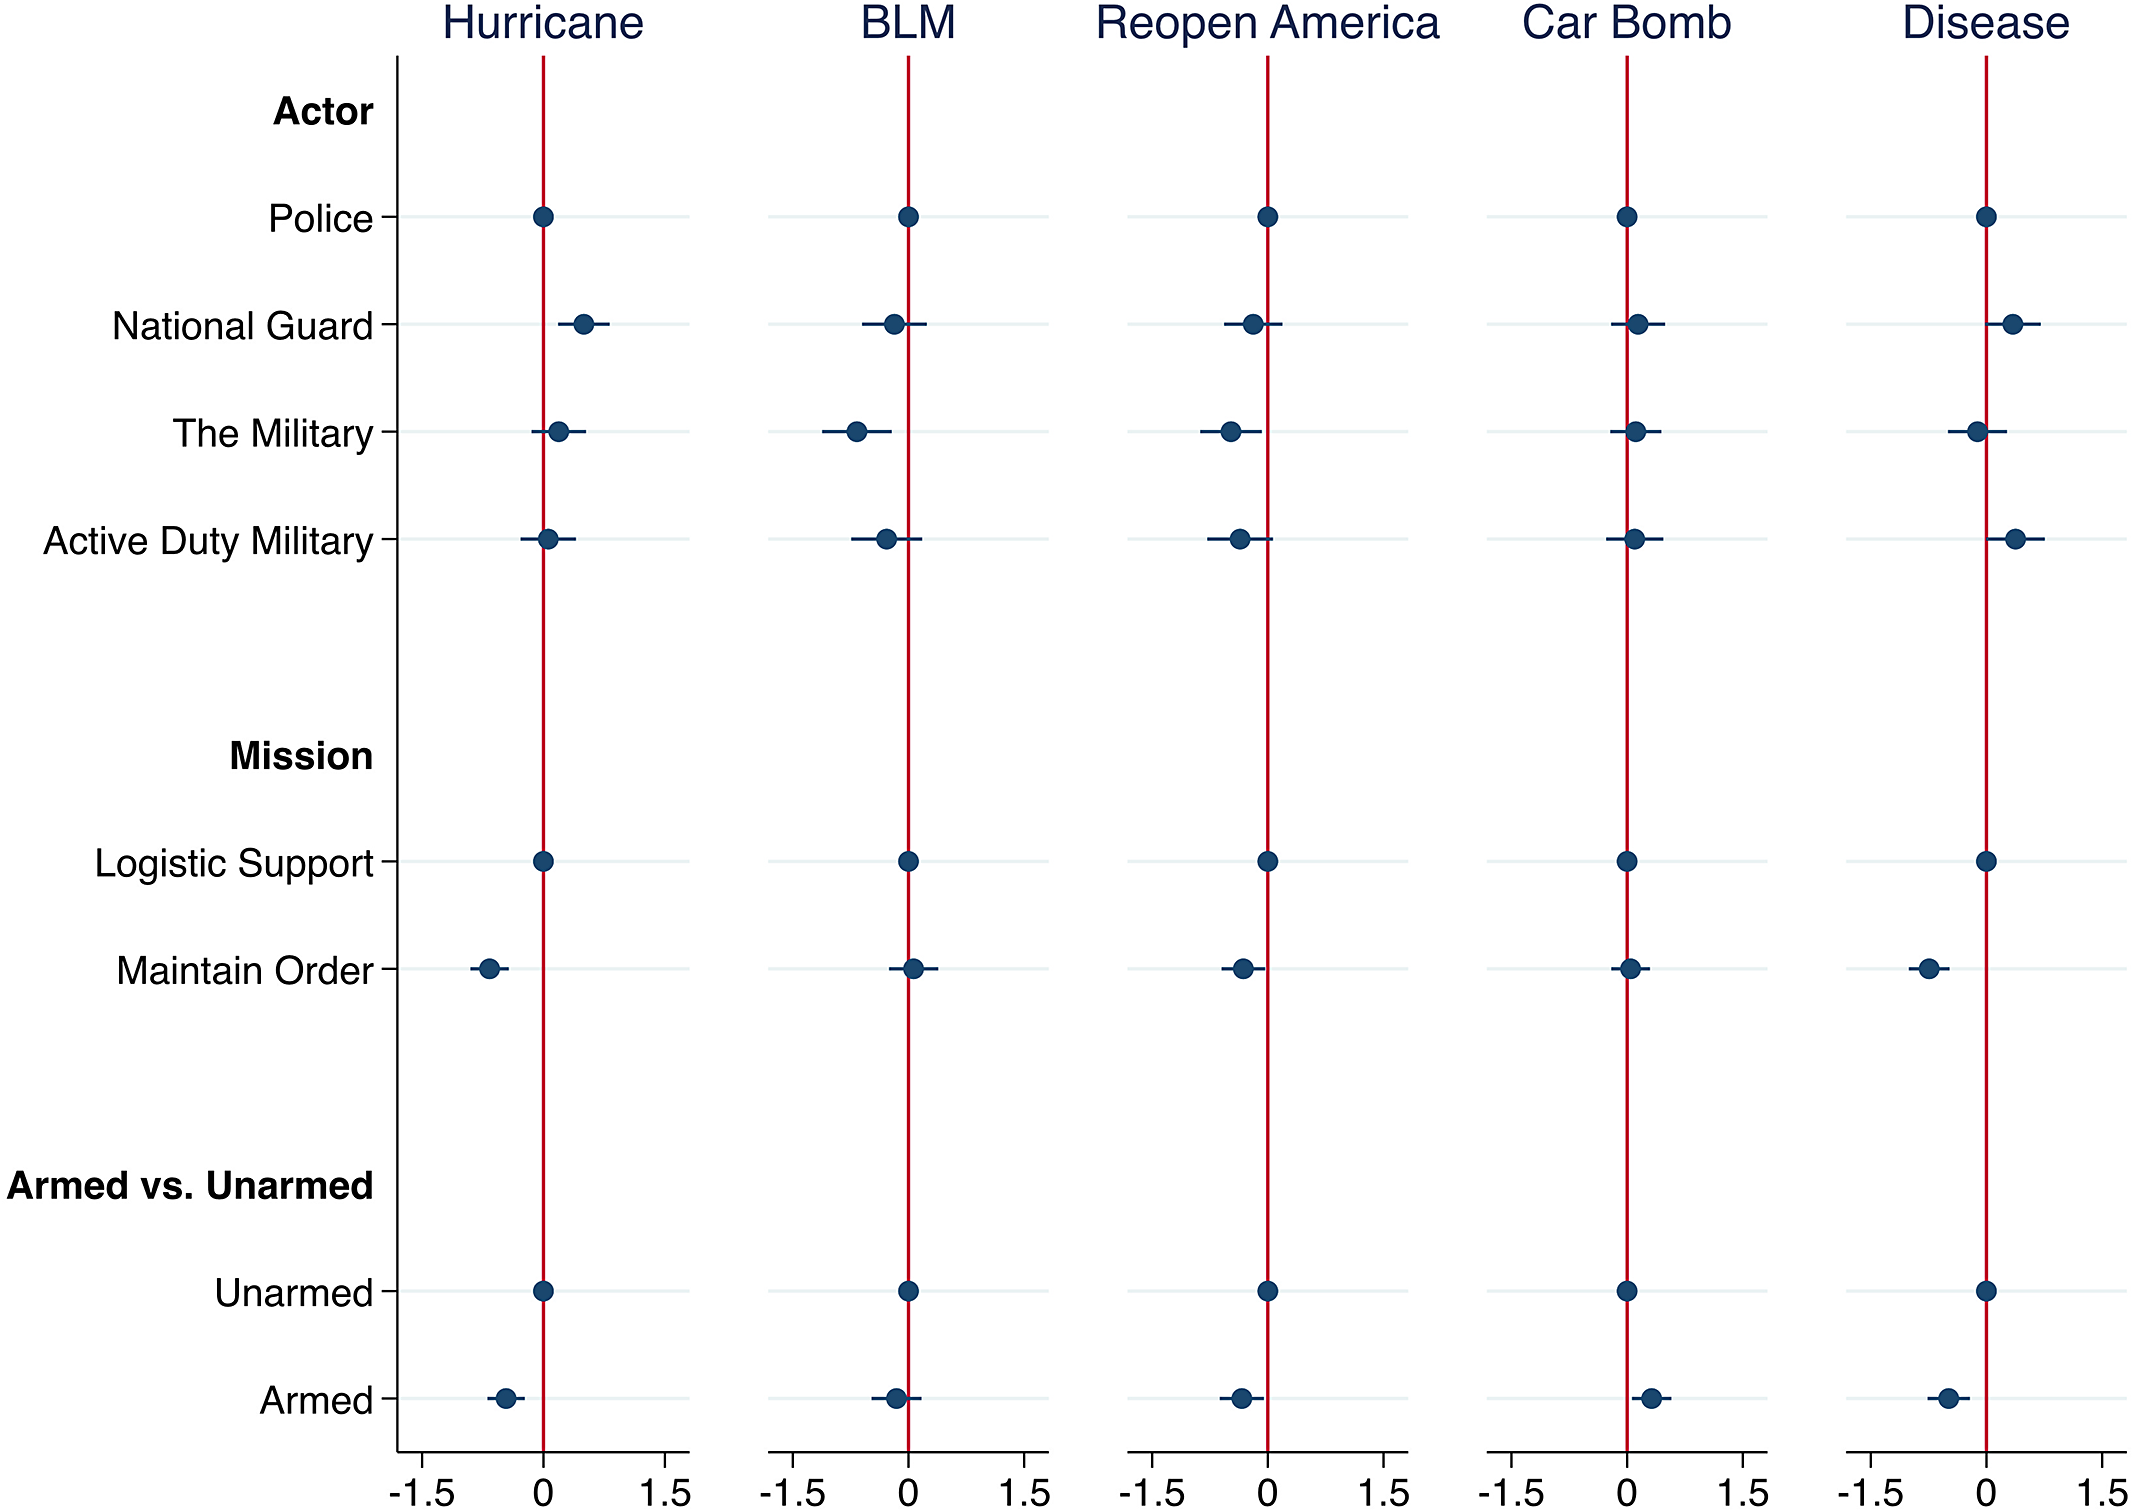
Our measure for warmth yields similar results, as shown in Figure 3. Here, we see that use of the National Guard in response to a Cat-5 hurricane increases feelings of warmth by 0.50sp (CI: 0.54, 0.46; p: 0.002). In contrast, use of the military reduces feelings of warmth in response to a BLM protest by 0.67sp (CI: −0.68, −0.66; p: 0.004) and to a Reopen America Protest by 0.47sp (CI: −0.53, −0.43; p: 0.019). We also find order maintenance operations reduce feelings of warmth by 0.67sp (CI: −0.69, −0.64; p: 0.000) when used in response to a Cat-5 hurricane, by 0.32sp (CI: −0.31, −0.32; p: 0.029) when deployed toward a Reopen America protest, and by 0.74sp (CI: −0.77, −0.72; p: 0.000) when used during a disease outbreak. Armed intervention increases feelings of warmth by 0.32sp (CI: 0.34, 0.30; p: 0.015) when used in response to a terrorist car bomb, but such armed intervention reduces feelings of warmth by 0.46sp (CI:-0.48, −0.44; p: 0.000) during a Cat-5 hurricane, by 0.33sp (CI: −0.36, −0.32; p: 0.021) when deployed in response to a Reopen America Protest, and by 0.49sp (CI: −0.53, −0.44; p: 0.000) during a disease outbreak. Note that there once again is no statistical difference from the unarmed baseline for responding to a BLM protest.
Warmth by Intervention Event
Note: Dots represent OLS estimates with 95% confidence intervals. Coefficients reflect the change in perceived legitimacy for each attribute relative to the baseline category. Baseline categories are depicted as dots without confidence intervals. Full regressions available in Supplementary Table 6A.

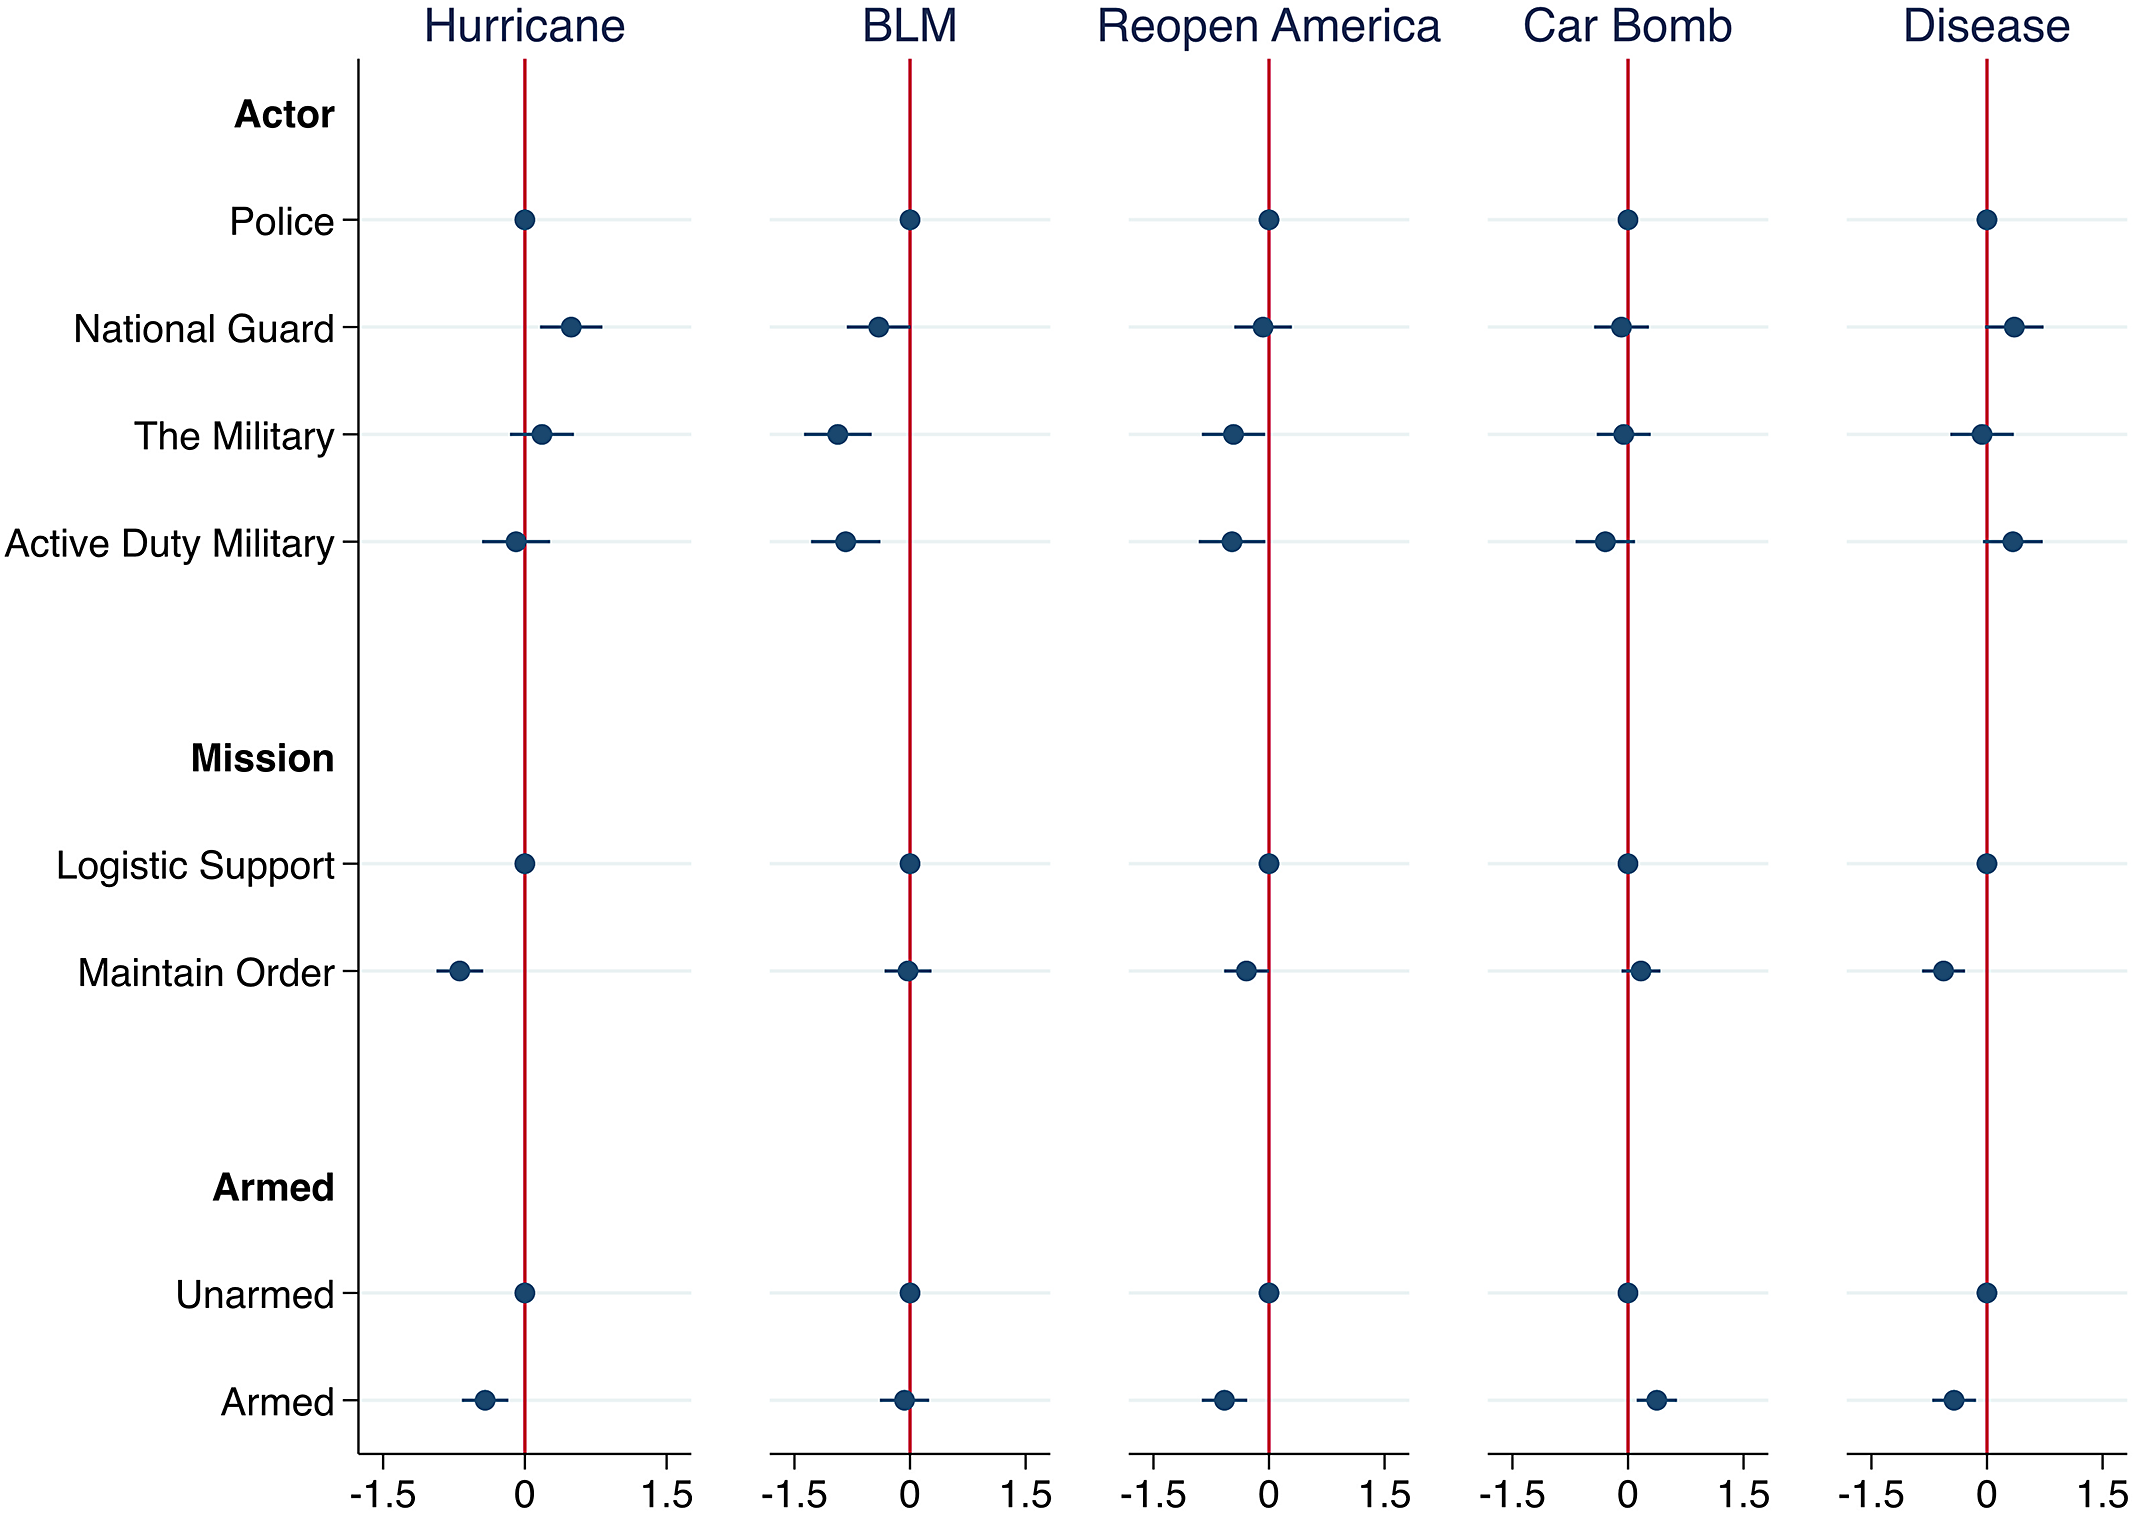
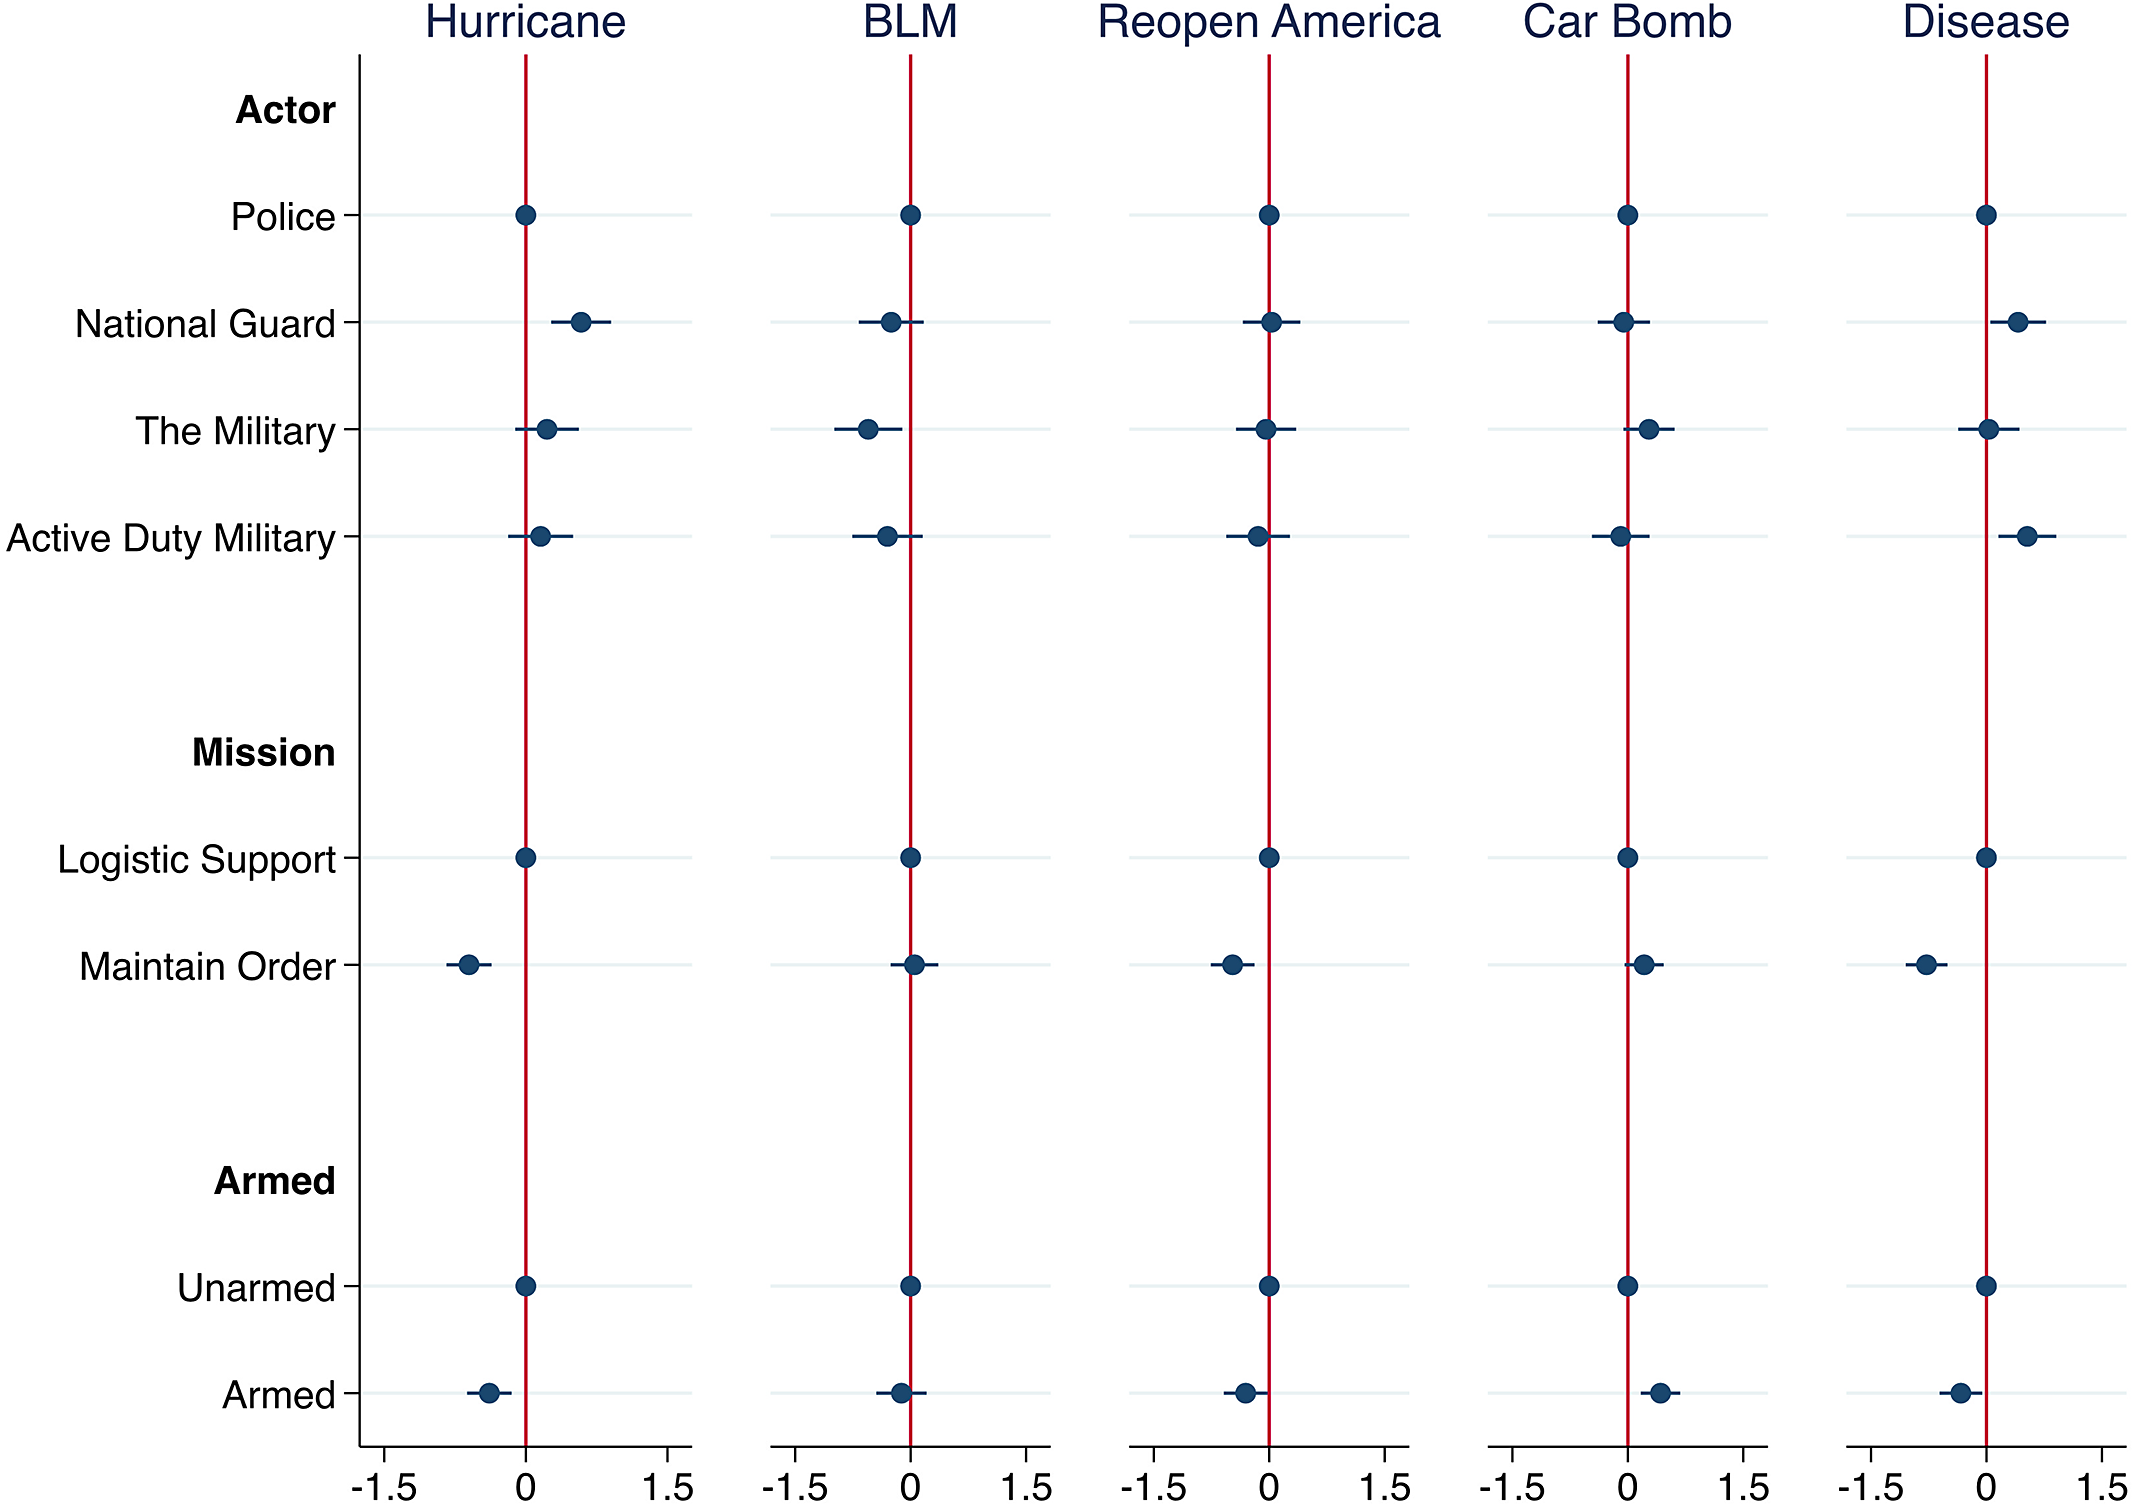
Similarly, in Figures 4 and 5, we see that responding to a BLM protest with the military reduces perceptions of legitimacy by 0.93sp (CI: −0.97, −0.91; p: 0.000) and appropriateness by 0.96sp (CI:-0.98, −0.94; p: 0.000), while responding with active-duty military personnel specifically reduces perceptions of legitimacy by 0.83sp (CI: −0.87, −0.80; p: 0.000) and appropriateness by 0.75sp (CI: −0.77, −0.74; p: 0.002). Substantively, these results are particularly impactful, as this equates to a 23.7% reduction in perceived legitimacy and a 25.5% reduction in perceived appropriateness when the military are deployed and a 21.1% reduction in perceived legitimacy and a 20.0% reduction in perceived appropriateness when active-duty military personnel are used. Likewise, responding to a Reopen America protest with the military reduces perceptions of legitimacy by 0.47sp (CI: −0.52, −0.40; p: 0.028) and appropriateness by 0.51sp (CI: −0.56, −0.45; p: 0.016), while responding with active-duty military personnel reduces perceptions of legitimacy by 0.48sp (CI: −0.55, −0.41; p: 0.030) and appropriateness by 0.49sp (CI: −0.56, −0.41; p: 0.030). In contrast, responding to a disease outbreak with the National Guard or active-duty military increases perceptions of appropriateness by 0.48sp (CI: 0.52, 0.43; p: 0.018) and by 0.43sp (CI: 0.45, 0.39; p: 0.039), respectively. We also find that employing the National Guard in response to a Cat-5 hurricane increases perceptions of legitimacy by 0.49sp (CI: 0.51, 0.47; p: 0.004) and appropriateness by 0.63sp (CI: −0.66, −0.59; p: 0.000).
Legitimacy by Intervention Event
Note: Dots represent OLS estimates with 95% confidence intervals. Coefficients reflect the change in perceived legitimacy for each attribute relative to the baseline category. Baseline categories are depicted as dots without confidence intervals. Full regressions available in Supplementary Table 7A.

Appropriateness by Intervention Event
Note: Dots represent OLS estimates with 95% confidence intervals. Coefficients reflect the change in perceived appropriateness for each attribute relative to the baseline category. Baseline categories are depicted as dots without confidence intervals. Full regressions available in Supplementary Table 8A.

In contrast, order maintenance interventions in response to a Cat-5 hurricane are viewed as 0.69sp less legitimate (CI: −0.70, −0.67; p: 0.000) and 0.68sp (CI: −0.70, −0.66; p: 0.000) less appropriate. Such interventions in response to disease outbreaks similarly are viewed as 0.56sp (CI: −0.58, −0.55; p: 0.000) less legitimate and 0.69sp (CI: −0.71, −0.68; p: 0.000) less appropriate. Similarly, order maintenance interventions in response to a Reopen America protest are viewed as 0.30sp less legitimate (CI: −0.30, −0.29; p: 0.000), but there is no statistically significant effect for appropriateness. Armed interventions reduce perceptions of legitimacy by 0.42sp (CI: −0.43, −0.42; p: 0.001) and appropriateness by 0.46sp (CI: −0.48, −0.44; p: 0.000) when used in response to a Cat-5 hurricane. They similarly reduce perceptions of legitimacy by 0.43sp (CI: −0.48, −0.37; p: 0.003) and appropriateness by 0.44sp (CI: −0.49, −0.40; p: 0.003) when deployed during a disease outbreak. Armed intervention in response to a Reopen America protest also reduces perceptions of legitimacy by 0.58sp (CI: −0.60, −0.55; p: 0.000) and appropriateness by 0.41sp (CI: −0.43, −0.38; p: 0.008). Notably, we find no such similar results for armed intervention into a BLM protest. Finally, such armed interventions increase perceptions of legitimacy by 0.38sp (CI: 0.40, 0.35; p: 0.005) when used in response to a terrorist car bomb.
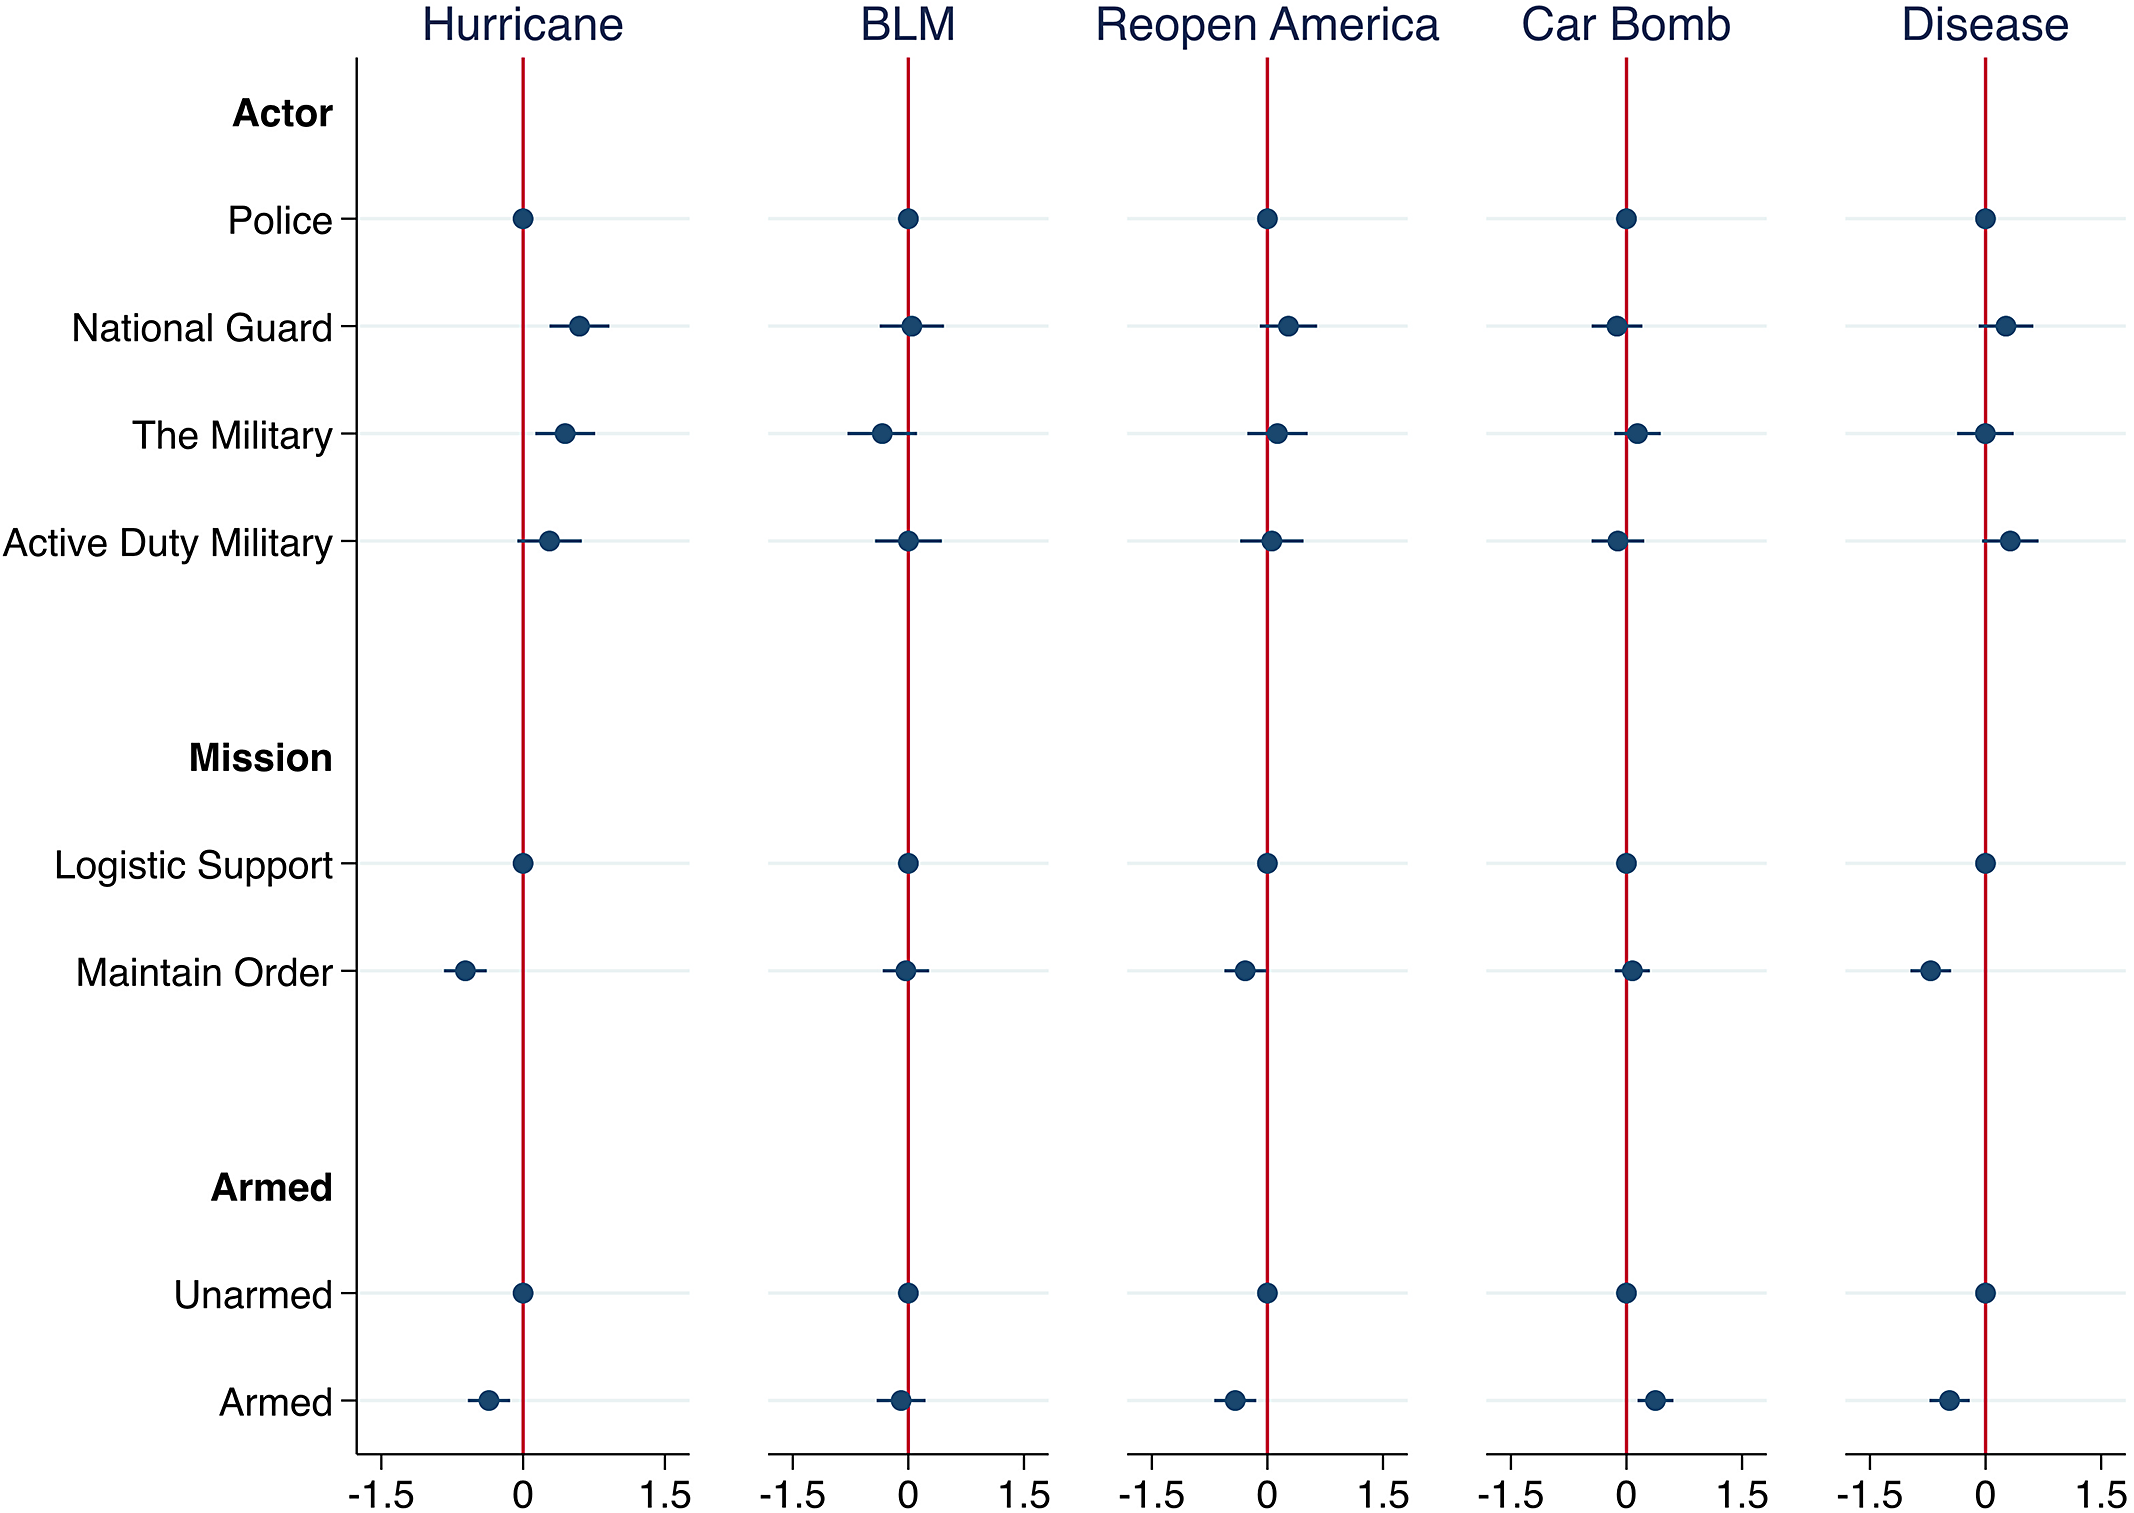
Finally, we turn to our results regarding perceptions of effectiveness and participants’ confidence that the intervening actor will do a good job, as shown in Figures 6 and 7. Here, we find that responding to a Cat-5 hurricane with the National Guard increases perceptions of effectiveness by 0.59sp (CI: 0.62, 0.55; p: 0.000) and increases confidence that the intervening actor will do a good job by 0.60sp (CI: 0.64, 0.55; p: 0.000). Responding to a Cat-5 hurricane with the military also increases such confidence by 0.45sp (CI: 0.47, 0.42; p: 0.006). Similarly, deploying the National Guard or active-duty military personnel in response to a disease outbreak increases perceptions of effectiveness by 0.41sp (CI: 0.44, 0.39; p: 0.026) and by 0.53sp (CI: 0.54, 0.53; p: 0.006), respectively, but is not statistically significant for confidence in job quality. Conversely, responding to a BLM protest with the military reduces perceptions of effectiveness by 0.55sp (CI: −0.56, −0.54; p: 0.015).
Effectiveness by Intervention Event
Note: Dots represent OLS estimates with 95% confidence intervals. Coefficients reflect the change in perceived effectiveness for each attribute relative to the baseline category. Baseline categories are depicted as dots without confidence intervals. Full regressions available in Supplementary Table 9A.

Confidence in Job Quality by Intervention Event
Note: Dots represent OLS estimates with 95% confidence intervals. Coefficients reflect the change in perception that the actor will do a good/bad job for each attribute relative to the baseline category. Baseline categories are depicted as dots without confidence intervals. Full regressions available in Supplementary Table 10A.

Regarding the influence of order maintenance operations, we find that employing such operations in response to a Cat-5 hurricane reduces perceptions of effectiveness by 0.60sp (CI: −0.63, −0.57; p: 0.000) and confidence in job quality by 0.61sp (CI: −0.64, −0.58; p: 0.000). Similarly, such operations reduce perceptions of effectiveness by 0.47sp (CI: −0.49, −0.46; p: 0.001) and confidence in job quality by 0.29sp (CI: −0.29, −0.29; p: 0.037) when deployed in response to a Reopen America protest. Participants are also skeptical of such operations when used during a disease outbreak, as effectiveness decreases by 0.77sp (CI: −0.81, −0.75; p: 0.000) and confidence in job quality decreases by 0.71sp (CI: −0.73, −0.69; p: 0.000) when compared to the baseline. Finally, we find that armed interventions significantly influence perceptions of effectiveness and confidence in job quality for each of the event types except for a BLM protest. Here, armed interventions reduce effectiveness by 0.39sp (CI: −0.40, −0.37; p: 0.001) in response to a Cat-5 hurricane, by 0.30sp (CI: −0.32, −0.29; p: 0.035) in response to a Reopen America Protest, and by 0.33sp (CI: −0.37, −0.29; p: 0.019) during a disease outbreak. Armed interventions also reduce confidence that the actor will do a good job by 0.36sp (CI: −0.39, −0.34; p: 0.002) when used in response to a Cat-5 hurricane, by 0.42sp (CI: −0.44, −0.39; p: 0.003) in response to a Reopen America Protest, and by 0.47sp (CI: −0.51, −0.42; p: 0.000) during a disease outbreak. In contrast, armed interventions increase perceptions of effectiveness by 0.43sp (CI: 0.44, 0.41; p: 0.001) and confidence in job quality by 0.37sp (CI: 0.39, 0.36; p: 0.002) when deployed in response to a terrorist car bomb.
As a whole, these results inform us about how the public views the role of the National Guard and other military actors. Most notably, our findings indicate that participants are most supportive of the use of the National Guard in response to humanitarian crises, like mass weather events and disease outbreaks. Our results also suggest that participants are indeed able to distinguish between different types of military actors and weigh the use of these actors based on the instigating event.Footnote 16 Participants are largely skeptical of the use of military actors in response to domestic political protests. Yet, it is troubling (if not disturbing) that participants are critical of the use of armed interventions in response to Reopen America protests, but not in response to BLM protests. Similarly, we find evidence (albeit less consistently so) that participants are less critical of order maintenance operations when used during BLM protests. We explore each of these findings and their policy implications further in the conclusion.
Additional Analyses
We next (briefly) explore the mechanisms that might be driving participants’ approval, beyond the conditioning effect of event type. As argued by Gelpi, Feaver, and Reifler (Reference Gelpi, Feaver and Reifler2005; Reference Gelpi, Feaver and Reifler2009), support for military operations depends on perceptions of legitimacy and, even more importantly, the likelihood of success (see also Eichenberg Reference Eichenberg2005).Footnote 17 Accordingly, we consider how participants’ perceptions of legitimacy and appropriateness as well as effectiveness and job quality may influence their approval and general feeling toward an intervention. As shown in Supplementary Figures 1A and 2A, we find that participants’ approval and warmth are indeed significantly associated with perceptions of legitimacy, appropriateness, effectiveness, and job quality. Participants who view the intervention as legitimate, appropriate, effective, or who think the intervening actor will do a good job have significantly higher approval and warmth ratings of the situation, even when controlling for treatment effects.Footnote 18 Conversely, participants who perceive the intervention to be illegitimate, inappropriate, ineffective, or who think the intervening actor will do a bad job exhibit significantly lower approval and warmth ratings of the situation, even when controlling for treatment effects.Footnote 19 While we cannot draw conclusions about the causal direction of these associations, our findings are consistent with the argument that the public makes a cost–benefit calculation with respect to supporting domestic operations, similar to the one they make for foreign operations. That is, they take into consideration legitimacy and likely effectiveness when weighing whether to approve, rather than simply approving or disapproving all such state actions.
We also consider how our results may vary based on two additional factors: the partisanship and race/ethnicity of participants. We believe that, given the politically sensitive nature of the treatments and the strong findings across the American politics literature regarding the effects of partisanship and race/ethnicity on political preferences, it is important to include these variables in our analyses. There is little reason to believe that participants’ responses to questions regarding their partisanship or race/ethnicity (which we asked post-treatment) will be influenced by the treatments or their responses to our dependent variables.Footnote 20
Our results, available in Supplementary Table 2A, show that there are indeed some distinctions between the perceptions of Republicans and Democrats. Republicans are significantly more likely than Democrats to approve of interventions into BLM protests (p: 0.000) and Reopen America Protests (p: 0.002). They are also significantly more likely to approve of interventions that employ the National Guard (p: 0.017) or the military (p: 0.000), as well as order maintenance (p: 0.001) and armed (p: 0.000) interventions. Additional analyses of each of the remaining primary outcomes of interest confirm these results. Regarding race/ethnicity, we find little evidence that white respondents exhibit distinct preferences in response to our treatments when compared to either Black respondents or all respondents of color, as shown in Supplementary Tables 3A and 4A.Footnote 21
CONCLUSIONS
Our study finds remarkably consistent evidence across our survey experiment that US participants prefer more limited uses of the state’s coercive apparatus domestically, apart from preferring armed responses to a threatened terrorist attack. Furthermore, we find consistent support for each of our preregistered hypotheses. First, compared to a hurricane, participants are overall less supportive of interventions in response to a BLM protest, to a Reopen America protest, or to a disease outbreak, demonstrating that the instigating event is important (H1). Second, there is clear evidence that respondents prefer that local police or the National Guard conduct these interventions, rather than federal military forces, indicating that the type of actor conducting the intervention matters (H2). These effects appear to be especially pronounced for responses to disease outbreaks, natural disasters (where participants prefer the use of the National Guard over the police), and for interventions into political protests (where participants prefer the use of the police over the military). Third, participants are further skeptical of interventions that focus on maintaining order, providing evidence that the mission type is a critical factor in public perceptions (H3). Furthermore, participants are particularly skeptical of order maintenance operations in response to natural disasters, disease outbreaks, or a Reopen America Protest. Fourth, and finally, we also find that participants prefer intervening actors be unarmed (with the exception of response to terrorist threats), indicating that the type of intervention also matters (H4). Additional tests reveal that partisanship can be an important factor influencing these perceptions. Republican respondents are more likely to support interventions during political protests (regardless of the political valence of the protest), order maintenance interventions, and armed interventions. However, we find little evidence that respondent race/ethnicity is associated with distinct perceptions (in contrast to Carey and Cisneros Reference Carey and Cisneros2023).
Our study carries critical implications for both scholars and policymakers. First, our argument and results speak to the broader questions of public trust and confidence in the military, particularly from an Americanist and IR perspective. We find that participants in our experiment viewed intervention by “the military” or “the active-duty military” as less desirable or legitimate than one conducted by the police. Yet most studies of public trust in the military across IR (and foreign policy analysis) or American politics fail to consider the domestic role the military plays, particularly in an era of heightened partisan polarization in the USA. This indicates a need for scholars to delve more deeply into the relationships between public beliefs about actor legitimacy and proper role conceptions and the public’s actual experiences with different actors in different scenarios. It will be important to untangle how the characteristics of such situational uses may influence public perceptions of the armed forces, or indeed, vice versa (Bradford, Milani, and Jackson Reference Bradford, Milani and Jackson2017).
While scholars have long recognized that the public is not monolithic in its support for the military institution, our study shows that we also need to consider the role of the context of military action in such public perceptions. Respondents generally viewed the National Guard as either equally legitimate/appropriate/effective as the police, or slightly better. This indicates that the public potentially do differentiate between “the military” and the National Guard, and that they recognize a distinction in their roles and missions. We do caveat, however, that in our survey the National Guard treatment stated that they were sent in by the governor, and participants may be responding to that prompt rather than, or in addition to, the National Guard prompt itself. More research is needed to understand what the public knows or believes about the National Guard. Still, our results point to support from participants for the use of the National Guard in response to natural disasters and disease outbreaks.
Second, our study speaks to current public debates regarding the influence of police militarization on public policy and domestic support of the police and other armed actors. In this regard, our research supports other work that indicates that the public generally objects to intrusive, armed, order maintenance interventions. Yet, we show that partisanship is a sharp divider of opinion, as Republicans are more accepting of this type of intervention than others. Furthermore, they are more accepting of these types of interventions in response to protests. Third, and relatedly, the results of our study lend a word of caution to future work on these issues. Our work reiterates the need for public opinion studies on civil-military and civil-police relations within the USA, as well as more work on the perceptions of and beliefs about the National Guard. We urge scholars to consider how the norms in each realm may differ. In particular, we see the need for more scholarship on how the public views the appropriate roles of each actor. One could argue that the increased use of the military in the US domestic context could lead to a “hollowing out” of civil-military relations (see Zaverucha Reference Zaverucha2000), which should be of keen interest to both scholars and policymakers. Yet, unlike work focusing on Latin American politics, our research indicates that the US public is less trusting of the use of military forces domestically. Thus, we encourage future work to consider how the state of civil-military relations across different countries (or regions) may influence perceptions of domestic uses of state force.
Finally, and relatedly, our study carries important policy implications, particularly regarding recent trends in police militarization as well as debates over the use of federal forces domestically and the professionalization of the National Guard (see Burbach, Cohn, and Lupton Reference Burbach, Cohn and Lupton2020; Lupton, Burbach, and Cohn Reference Lupton, Burbach and Cohn2020). Participants in our study clearly did not believe that military forces are an appropriate substitute for police forces, despite broad public trust in the military and despite concerns about police tactics more broadly. Even with suggestive evidence that domestic uses of the military or National Guard do not dampen public support of the military as an institution (Cohn Reference Cohn, Collins and Hall2022; Snyder Reference Snyder2020), our research shows that popular feeling is ex ante skeptical of both the appropriateness and effectiveness of such uses of military personnel. We find the public is skeptical of militarized responses, including armed responses, order maintenance responses, and responses by federal military personnel. Accordingly, this raises serious questions and intense doubt about the direction in which policing has been moving for the past several decades, and about the willingness of the executive to employ federal forces domestically.
SUPPLEMENTARY MATERIAL
To view supplementary material for this article, please visit http://doi.org/10.1017/S0003055424000339.
DATA AVAILABILITY STATEMENT
Research documentation and data that support the findings of this study are openly available at the American Political Science Review Dataverse: https://doi.org/10.7910/DVN/UY2GRM.
Acknowledgements
Thank you to the editors and reviewers for their comments on the manuscript. Thank you also to the audiences and discussants at the MIT Security Studies Program Seminar, the 2021 ERGOMAS, CDSN, & CSMS Total Defence Force Workshop, the 2021 IUS Meeting, and the 2021 and 2022 International Studies Association Annual Meetings. The project was preregistered with EGAP prior to analysis. All views are the authors’ own and do not represent the views of their employers.
AUTHOR CONTRIBUTIONS
All authors contributed equally to this work.
FUNDING STATEMENT
Funding for this project was provided by Colgate University’s Research Council and the American Political Science Association.
CONFICT OF INTEREST
The authors declare no ethical issues or conflicts of interest in this research.
ETHICAL STANDARDS
The authors declare the human subjects research in this article was reviewed and approved by Colgate University (#EM-S20-30). The authors affirm that this article adheres to the principles concerning research with human participants laid out in APSA’s Principles and Guidance on Human Subject Research (2020).




Comments
No Comments have been published for this article.