I. INTRODUCTION
According to the basic theory of color-light, any color can be obtained by mixing specific ratio of persistent phosphors with red, green, and blue primary colors. Green and blue phosphors have been commercialized. However, owing to low starting brightness and short afterglow time, red phosphors have not reached the practical requirements. Therefore, it is highly desirable for academic and business circles to develop efficient red-emitting phosphors.
CaTiO3-based materials doped with Pr3+ are known as potential red phosphors due to their chemical stability, weathering ability, and especially excellent chromatic coordinate (x = 0.68, y = 0.31) close to “ideal red” defined by CIE (Commission Internationale de l’Eclairage 1931).Reference Chadha, Smith, Vecht and Gibbons1 As such, CaTiO3 as red persistent phosphor has attracted appreciable attention in the past decades. It should be noted that the emission efficiency of CaTiO3:Pr3+ is still low in practical applications.Reference Diallo, Boutinaud, Mahiou and Cousseins2 In this context, many efforts have been done to enhance luminescent intensity and persistent efficiency of CaTiO3:Pr3+ phosphors. In general, there are two main ways to elevate luminescent properties of CaTiO3:Pr3+ phosphors. One way is to introduce different charge compensators into the matrix, e.g., Na+, Tl+, Ag+ substitution for Ca2+ (Ref. Reference Diallo, Boutinaud, Mahiou and Cousseins2) or Al3+,Reference Diallo, Jeanlouis, Boutinaud, Mahiou and Cousseins3,Reference Tang, Yu, Yang, Zhou and Peng4 Ln3+ (Ln = La, Lu, Gd),Reference Zhang, Zhang, Zhang, Chen, Lu and Wang5–Reference Kang, Byun, Kim, Suh and Kang7 Zr4+,Reference Zhang, Xu and Yao8 Nb5+(Ref. Reference Jiang, Wang and Gong9) substitution for Ti4+ could impart charge self-compensation to the matrix, consequently, suppressed Ca2+ and Ti4+ vacancies lead to remarkable increase of the red emission. The other way is to substitute equivalent cations [Zn2+, Mg2+,Reference Royce, Matsuda and Tamaki10 Ba2+, or Sr2+(Ref. Reference Wang, Xu and Yamada11)] for Ca2+. Royce et al.Reference Royce, Matsuda and Tamaki10 demonstrate that the emission intensity of CaTiO3:Pr3+ phosphors can be significantly enhance after Zn2+ substitution for Ca2+. Also, our results reported previously indicate that Zn-doped Ca0.8Zn0.2TiO3:Pr3+ phosphors synthesized by conventional solid-state reaction possess higher emission efficiency than that of pristine CaTiO3:Pr3+.Reference Lian, Lin and Su12 In addition, substituting Zn2+ for Ca2+ has been shown to be an efficient route to elevating persistent performance of CaTiO3:Pr3+ phosphors.Reference Royce, Matsuda and Tamaki10,Reference Haranath, Khan and Chander13,Reference Lian, Zuo, Yin, Li and Zhang14
Synthetic methodology appears to be another factor affecting luminescent properties of CaTiO3:Pr3+ phosphors. Usually, the phosphors prepared by conventional solid-state reaction have large particle size and limited homogeneity, which, in turn, lead to inferior luminescent properties.Reference Diallo, Jeanlouis, Boutinaud, Mahiou and Cousseins3,Reference Tang, Yu, Yang, Zhou and Peng4,Reference Pinel, Boutinaud, Bertrand, Caperaa, Cellier and Mahiou15 It has been reported that the addition of dopants, e.g., Zn species, during the synthesis of CaTiO3:Pr3+ would result in further aggregation of the phosphor particles.Reference Chung, Kang, Shin, Cheong, Hwang, Cho, Lee and Kim16,Reference Kim, Lee and Kim17 In this context, more sophisticated synthesis strategies, such as coprecipitation method,Reference Zhang, Zhang, Ren and Wang18,Reference Shang and Zheng19 sol–gel method,Reference Lian, Zuo, Yin, Li and Zhang14,Reference Pinel, Boutinaud, Bertrand, Caperaa, Cellier and Mahiou15 electro-spinning method,Reference Peng, Hou, Zhang, Li, Lian and Cheng20 spray pyrolysis,Reference Tan, Yang, Li, Wang, Wang, Zhang, Jing and Lin21 and hydrothermal method,Reference Kutty and Viveknandan22,Reference Dong, Zhao, Song, Xu, Zhou and Han23 as compared to solid-state reaction, have been invoked to produce CaTiO3:Pr3+ phosphors with relatively smaller and more uniform grain size. By using a hydrothermal method, Kutty and ViveknandanReference Kutty and Viveknandan22 synthesized CaTiO3 powder with hydrated titania gel and reactive CaO as starting materials in 1987. Afterward, Meng et al.Reference Wang and Meng24 synthesized red phosphors of CaTiO3:Pr, Al via hydrothermal method using CaCl2, TiCl4, and Pr6O11 as raw materials and found that the morphology of the phosphors can be tuned by adding adjuvant.Reference Yang, Zou, Wang and Meng25 We are aware of few papers reporting on the preparation of Ca0.8Zn0.2TiO3:Pr3+ phosphors by the hydrothermal method.
In continuation of our efforts to explore highly efficient CaTiO3-based phosphors, herein, Ca0.8Zn0.2TiO3:Pr3+ phosphors were prepared using Ca(NO3)2·4H2O, Zn(NO3)2·6H2O, Ti(OC4H9)4, and Pr6O11 as raw materials by the hydrothermal method. The results showed that the phosphors synthesized by the hydrothermal method possessed better luminescent properties than their counterpart prepared via solid-state reaction.
II. EXPERIMENTAL
Ca(NO3)2·4H2O (A.R.), Zn(NO3)2·6H2O (A.R.), citric acid (A.R.), CO(NH2)2 (A.R.), Ti(OC4H9)4 (C.P.), and Pr6O11 (99.99%) were used as raw materials. Ca(NO3)2·4H2O and Zn(NO3)2·6H2O were dissolved in deionized water to prepare 0.2 mol/L Ca2+ and Zn2+ solutions, respectively. Pr6O11 was dissolved in hydrochloric acid under vigorous stirring, and then excess acid was evaporated to prepare 5.0 × 10⁻³ mol/L PrCl3 solution.
According to the chemical formula of Ca0.8Zn0.2TiO3:0.2% Pr3+, 3.4036 g Ti(OC4H9)4, and 2.1014 g citric acid with mole ratio 1:1 were weighed in a beaker under continuous stirring for 0.5 h (labeled as A); 40 mL Ca(NO3)2, 10 mL Zn(NO3)2, and 4 mL PrCl3 solutions were mixed together to form metallic ions solution (labeled as B). Solution B was then added dropwise to solution A at room temperature with vigorous stirring until the transparent solution formed. Mineralizer of 1.2012 g CO(NH2)2 (the same mole of metallic ions) was added to the transparent solution, followed by stirring for 1 h, then the resultant mixture was transferred to a 28 mL Teflon autoclave (reaching 70 vol%). The autoclave was sealed and heated in an oven at 200 °C for 2 h and then cooled to ambient temperature. The obtained precipitate was centrifuged, washed with distilled water several times, and then dried. Finally, the hydrothermal precursor was calcined at 800–1200 °C for 3 h under air, yielding Ca0.8Zn0.2TiO3:0.2 mol% Pr3+ phosphors. For comparison purpose, a Zn-free phosphor of CaTiO3:0.2 mol% Pr3+ was prepared via the aforementioned process except for the addition of Zn(NO3)2. Also, an additional phosphor of Ca0.8Zn0.2TiO3:0.2 mol% Pr3+ was synthesized via conventional solid-state reaction (1150 °C, 5 h).Reference Haranath, Khan and Chander13
The crystalline phase of the samples was analyzed by a Rigaku D/MAX-2550VB + 18 kW x-ray diffractometer (XRD,Tokyo, Japan) with Cu Kα radiation at 40 kV and 30 mA. Quantitative phase analysis was performed by using WPF-Rietveld method. Micromorphology of the samples was observed on a JSM-5600 LV scanning electron microscope (SEM,Tokyo, Japan). Excitation and emission spectra were obtained on a Hitachi F-4500 luminescence spectrofluorometer (Tokyo, Japan) equipped with a 175 W xenon lamp as excitation source and UV 390 nm filter, operated at 400 V photomultiplier tube voltage. Fourier transformation infrared spectra (FTIR) were recorded in the region 4000–400 cm−1 on a Thermo Nicoleft Nexus 510P FTIR spectrophotometer (Boston, MA) using the KBr pellets technique. All measurements were performed at room temperature.
III. RESULTS AND DISCUSSION
A. Analyses of crystal phases
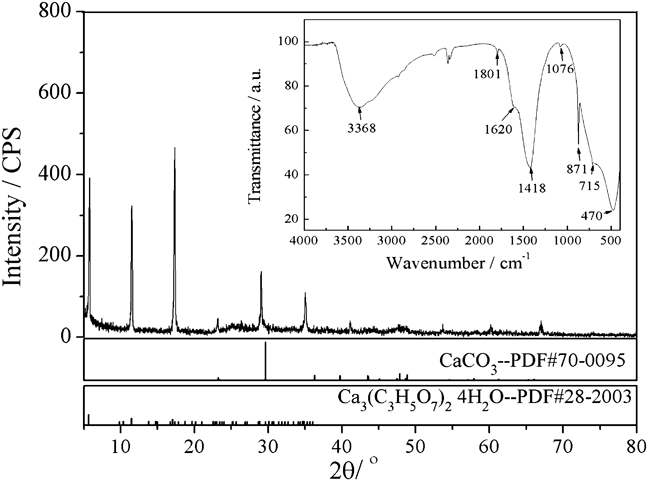
Figure 1 shows XRD pattern of the uncalcined sample prepared at 200 °C by the hydrothermal method. Earlandite Ca3(C3H5O7)2·4H2O (JCPDS No. 28-2003) and monoclinic CaCO3 phase (JCPDS No. 70-0095) may coexist. FTIR spectrum (inset in Fig. 1) shows a band around 3368 cm−1 and a weak dip at 1620 cm−1, assigned to antisymmetric stretching vibration of OH− ions and bending vibration of HOH, respectively. The bands centered at 1418, 1076, and 871 cm−1 can be assigned to asymmetric C–O stretching vibration v 3, symmetric C–O stretching vibration v 1, and CO3 out-of-plane deformation vibration v 2, respectively. The weak peak at 715 cm−1 can be assigned to OCO in-plane bending vibration v 4. Moreover, the weak dip at 1801 cm−1 may be due to the combinations v 1 + v 4.Reference Andersen and Brečević26 Strong absorption peak at 470 cm−1 is attributed to the stretching vibration of the Ti–O bond.Reference Last27 Combined with XRD results, C–O bond may be either in carboxylate ion or in CO32− ion, in which two ions are from citrate and urea, respectively. Therefore, it is logical to conclude that urea hydrolyzes to form OH− and CO32− ions in the sealed Teflon autoclave at 200 °C, and both ions are precipitants for Ca2+, Ti4+, and Zn2+ ions. It has been reported that high hydroxide concentration is conducive to the hydrothermal formation of CaTiO3.Reference Croker, Loan and Hodentt28 Indeed, Lencka and RimanReference Lencka and Riman29 have indicated that pH value higher than 14 is prerequisite to obtain high yield of CaTiO3 at hydrothermal temperature of 150–200 °C in the presence of CaCO3. According to our hydrothermal process conduced at relatively low pH value (<10), it is hard to form CaTiO3.
XRD pattern of the uncalcined sample prepared by the hydrothermal method. The inset is IR spectrum of the uncalcined sample.

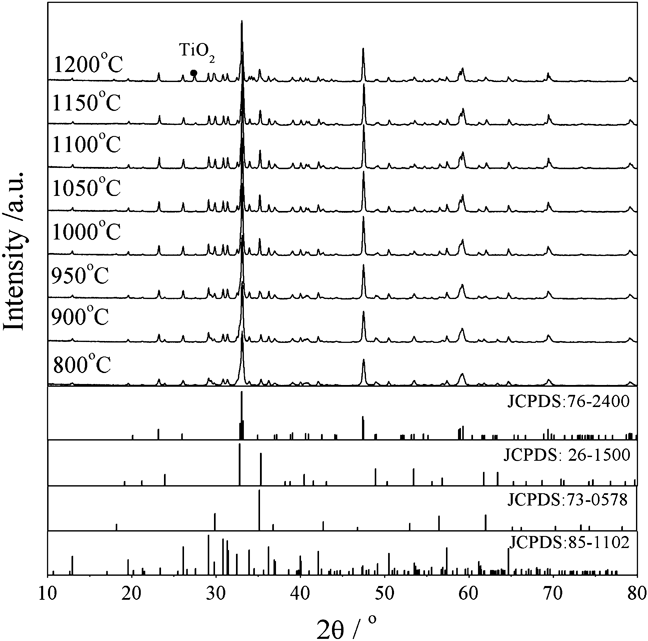
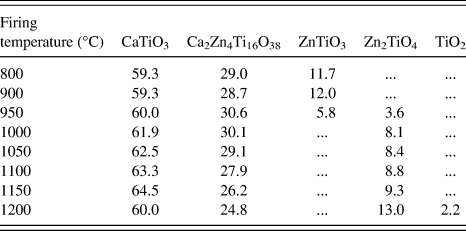
Figure 2 shows XRD patterns of the samples calcined at 800–1200 °C for 3 h, and the corresponding quantitative phase analyses are listed in Table I. All the calcined samples consist of orthorhombic CaTiO3 phase (JCPDS No. 76-2400) and rhombohedral Ca2Zn4Ti16O38 phase (JCPDS No. 85-1102), while CaTiO3 phase is dominant. Hexagonal ZnTiO3 phase (JCPDS No. 26-1500) is only observed for the samples calcined below 950 °C, since the phase is decomposed above 945 °C, forming Zn2TiO4 and TiO2.Reference Yang and Swisher30,Reference Wang, Hwang, Chang, Ko, His, Huang and Wang31 Thus, hexagonal ZnTiO3 phase and cubic Zn2TiO4 phase coexist in the sample calcined at 950 °C. Above 950 °C, cubic Zn2TiO4 (JCPDS No. 73-0578) originated from decomposition of ZnTiO3 can be observed and its amount increases with elevated calcination temperature. In the case of the sample calcined at 1200 °C, an additional TiO2 phase is observed aside from the other three phases. Note that the sample calcined at 1150 °C possesses the highest content of CaTiO3.
XRD patterns of Ca0.8Zn0.2TiO3:0.2 mol% Pr3+ calcined at different temperatures.
Phase content for samples calcined at different temperatures (wt%).
B. Micromorphology
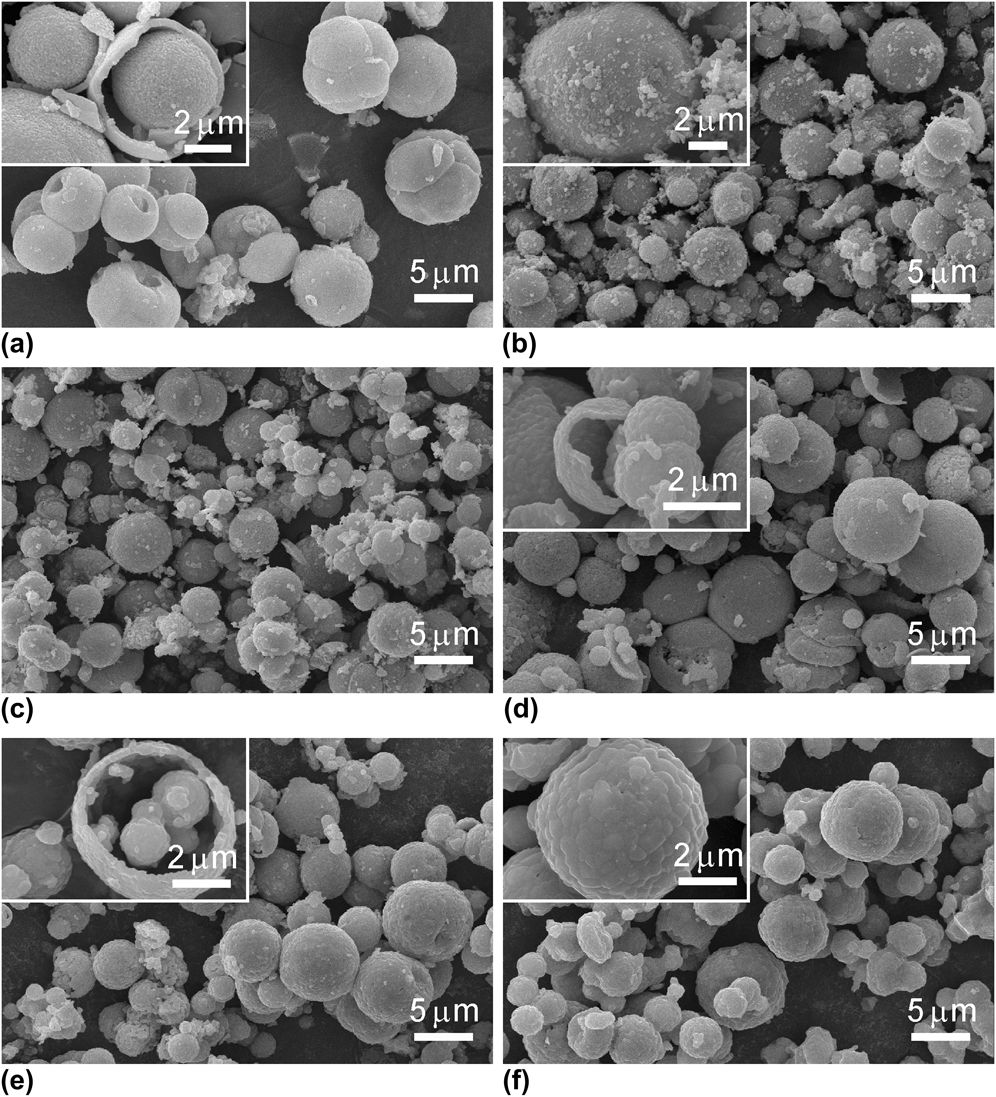
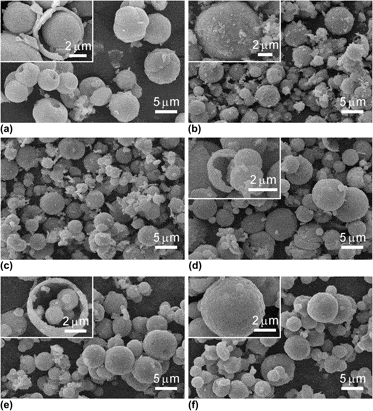
SEM micrographs of the samples calcined at different temperatures are shown in Fig. 3. Clearly, uncalcined sample consists of nonuniformed particles with a size range of 3–8 μm [see Fig. 3(a)]. It is interesting that there is a hole in the middle of the sphere for most of the particles, which may be caused by the hydrothermal process. The broken particles clearly show that they are hollow with a shell thickness of 210–480 nm and smaller particles are in the middle of larger ones [shown in the inset of Fig. 3(a)]. The shape of the calcined particles does not change as shown in Figs. 3(b)–3(f). However, elevated calcination temperature leads to increased particle size and simultaneously the surface of particles becomes more smooth. When calcination temperature reaches 1150 °C, tiny particles start to merge and most of them disappear. Note that the morphology of Ca0.8Zn0.2TiO3:Pr3+ presented here is different from the results reported previously, wherein, irregular acicular, rectangular,Reference Kutty and Viveknandan22 butterfly-like, flower-like microsphere,Reference Dong, Zhao, Song, Xu, Zhou and Han23 or microcube-shapedReference Moreira, Paris, Nascimento, Longo, Sambrano, Mastelaro, Bernardi, Andrés, Varela and Longo32 crystallites were obtained. In our case, citric acid is used as a chelator for Ti species and covers the reactants to form microspheres. During the hydrothermal and successive calcination processes, decomposition of organic substances perhaps results in broken particles, and the resultant gases in high temperature calcination further produce hollow spheres. Indeed, the hollow spheres with shell thicknesses of 160 nm [in the inset of Fig. 3(d)] and 230 nm [in the inset of Fig. 3(e)] are observed for the samples calcined at 1000 and 1050 °C, respectively. Nevertheless, the growth mechanism needs to be investigated in detail.
SEM micrographs of Ca0.8Zn0.2TiO3:0.2 mol% Pr3+ uncalcined (a) and calcined at (b) 800 °C, (c) 950 °C, (d) 1000 °C, (e) 1050 °C, and (f) 1150 °C for 3 h. The insets are SEM micrographs with higher magnification.
C. The luminescent properties of Ca0.8Zn0.2TiO3:0.2 mol% Pr3+
The excitation and emission spectra of Ca0.8Zn0.2TiO3:0.2 mol% Pr3+ synthesized at various temperatures are shown in Fig. 4. Upon excitation at wave lengths 330 and 380 nm, the sharp emission peaks located at 612 nm originates from 1D2 → 3H4 of Pr3+ ions for the sample calcined at 1150 °C, which is in the red spectral region [see Fig. 4(a)]. The inset of Fig. 4(a) displays the intensity evolution of emissions with the increase of calcination temperature, i.e., the higher the calcination temperature, the higher the intensity of emission. As evidenced by XRD results, elevated calcination temperature leads to increased crystallinity, which, in turn, would result in the stronger interaction between the matrix and Pr3+ energy levels and eventually the increase of red emission. As shown in Fig. 4(b), each excitation curve under monitoring at 612 nm mainly consists of two strong broad bands centered at about 330 nm (marked as A) and 380 nm (marked as B) and a weaker broad band ranged from 450 to 500 nm (marked as C). The band A can be related to the transition from the valence band to the conduction band of the host, which is from O2− 2p levels to Ti4+ 3d levels.Reference Diallo, Boutinaud, Mahiou and Cousseins2 The band B can be attributed to a low-lying Pr-metal intervalence charge transfer (IVCT), Pr3+/Ti4+ ↔ Pr4+/Ti3+, by which photoelectrons were nonradiative relaxation from the 3P0 state to the 1D2 state of Pr3+ ion. It is generally accepted that the band C are from the 4f → 4f transition of Pr3+.Reference Diallo, Boutinaud, Mahiou and Cousseins2,Reference Zhang, Xu and Yao8,Reference Boutinaud, Pinel, Dubois, Vink and Mahiou33,Reference Dereń, Pazik, Strek, Boutinaud and Mahiou34 Note that band A slightly shift to a longer wave length with the increase of the calcination temperature, resulting from the increased crystal size that often causes a large average optical path.Reference Chang, Xua, Jiang, Mao and Ying35
The emission (a) and excitation (b) spectra of samples fired at different temperatures. The inset a is the relationship between the emission intensity of Ca0.8Zn0.2TiO3:0.2 mol% Pr3+ (λex = 330 and 380 nm) and different calcination temperatures and the inset b is the ratio of band B to band A.
In addition, the excitation intensities of these three bands strongly depend on the calcination temperature. The variations of band A, band B, and the normalized excitation spectra are shown in Fig. 5. The intensities of band A and B increase more than three and five times with calcination temperature increasing from 800 to 1150 °C, respectively. From the inset, it is obvious that the intensity ratio of band B to band A passes through a maximum and then decreases with enhanced calcination temperature, and the sample calcined at 1150 °C has the highest intensity ratio.
Excitation intensities of peak at 330 nm (a), 380 nm (b) at different calcination temperatures. The inset is normalized excitation curves.
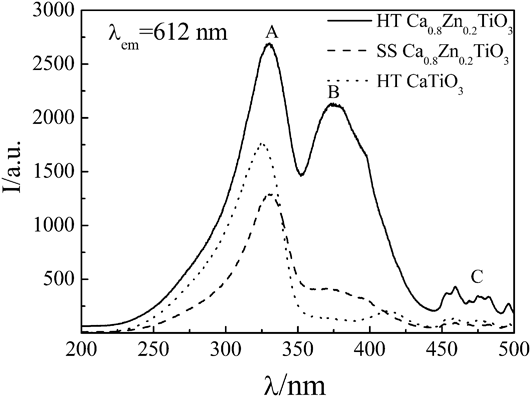
The excitation spectra of Ca0.8Zn0.2TiO3:0.2 mol% Pr3+ prepared at 1150 °C by the solid-state and hydrothermal method, as well as CaTiO3:Pr3+ phosphor prepared by the hydrothermal method at the same temperature, are illustrated in Fig. 6. Obviously, Ca0.8Zn0.2TiO3:0.2 mol% Pr3+ prepared by the hydrothermal method has stronger excitation intensity than that of its counterpart prepared by the solid-state method at the same calcination temperature, especially the intensity of band B. It has been reported that the relative intensities of the excitation bands and the peaks of the 4f states are dependent on the sample synthesis conditions.Reference Jia, Jia, Rodriguez, Evans, Meltzer and Yen36 Moreover, there are only strong band A and very weak band C in the excitation spectrum of CaTiO3:Pr3+, whereas band B is hard to detect.Reference Boutinaud, Pinel, Dubois, Vink and Mahiou33,Reference Pan, Su, Xu, Chen, Ge, Yang and Wu37 In this context, the IVCT band from Pr3+ to metal ions is dramatically enhanced by the hydrothermal method and Zn incorporation. It is believed that the thermodynamic conditions for IVCT could be attained by oxidizing certain amount of Pr3+ to Pr4+ and that the electronic charge transfer between Pr3+ and Ti3+ can readily occur at fairly low energy.Reference Boutinaud, Pinel, Dubois, Vink and Mahiou33 In other words, the relative concentrations of Pr3+, Pr4+, and Ti3+ in the host CaTiO3 vary with different synthesis methods.Reference Kim, Lee and Kim38 Therefore, it is speculated that the hydrothermal process presented here could partly promote IVCT, leading to the significant enhancement of band B.
Comparison of excitation intensities of samples prepared at 1150 °C by the solid-state (dashed line) method and hydrothermal method (solid line and dotted line), respectively.
In our work, there are four phases including CaTiO3, Ca2Zn4Ti16O38, ZnTiO3, and Zn2TiO4. As a major phase, the content of CaTiO3 increases with elevated calcination temperature, thus its variation results in the enhancement of band A, B, and C. From Ref. Reference Lian, Qi, Rong, Yu, Zhu, Yin and Liu39, the major excitation peak of Ca2Zn4Ti16O38: Pr3+, Na+ is located at 380 nm, and the peak at 330 nm often shrinks to undetectable levels. We note that the content of Ca2Zn4Ti16O38 has a maximum value at 950 °C. Thus, Ca2Zn4Ti16O38 is not the main reason for the remarkable enhancement of band B. Kang et al.Reference Kang, Chung, Kang, Lee and Kim40 have proven that the incorporation of ZnO would lead to the enhanced excitation band around 370 nm. The incorporated Zn species may form defect levels below the conduction band of the CaTiO3 host, which can capture excited electrons, leading to the red emission.Reference Lian, Lin and Su12 Indeed, similar results have been obtained in Mg2+- or Zn2+-doped SrTiO3:Pr3+ phosphors.Reference Ryu, Singh, Bartwal, Brik and Kityk41 Hexagonal ZnTiO3 is a thermodynamically stable compound between 800 and 945 °C, above which it transforms into cubic Zn2TiO4.Reference Yang and Swisher30 From the results of XRD, it is reasonable that the increased content of Zn2TiO4 is helpful for the improvement of band B. According to the density functional theory calculation,Reference Zhu, Wang, Du, Zhao and Gao42 the presence of Zn defects increases the multiple localized states of trap levels so as to favor the charge transfer transitions (i.e., band B) and 1D2 → 3H4 transition of Pr3+.
The decay curves for the samples prepared by the hydrothermal and solid-state method are shown in Fig. 7. The decay curves for the 1D2 → 3H4 emission of Pr3+ can be fitted by a double-exponential function: I(t) = A 1exp(−t/τ1) + A 2exp(−t/τ2), where I is the luminescent intensity, A 1 and A 2 are constants, t is the time, τ1 and τ2 are the decay time for the exponential components, respectively. The corresponding fitted results are listed in Fig. 7. The average lifetime values of the phosphors prepared by the solid-state and hydrothermal method for Pr3+ luminescence are 52.83 ms (a) and 77.03 ms (b), respectively, calculated by the formula τ = (A 1τ12 + A 2τ22)/(A 1τ1 + A 2τ2). It is evident that the phosphor of Ca0.8Zn0.2TiO3:0.2 mol% Pr3+ prepared by the hydrothermal method has longer afterglow.
Decay curve of the sample prepared by the solid-state method (a) and hydrothermal method (b) calcining at 1150 °C, monitoring at 612 nm, excited at 330 nm.
The red emission of Ca0.8Zn0.2TiO3:Pr3+ can further be confirmed by the CIE (Commission Internationale de l’Eclairage 1931) coordinations from their emission spectra. As shown in Fig. 8, upon excitation at 330 nm, the CIE chromaticity coordination of Ca0.8Zn0.2TiO3:0.2 % Pr3+ shifts from (x = 0.593, y = 0.399) to (x = 0.636, y = 0.360) with the increase of calcination temperatures. It is closer to the chromaticity coordinate of the standard red light,Reference Chadha, Smith, Vecht and Gibbons1 indicating that Ca0.8Zn0.2TiO3:0.2% Pr3+ calcined at 1150 °C is a potential red phosphor for the near-UV-pumped white LED.
The corresponding CIE chromaticity of diagram of sample calcinated at 800 °C (a), 900 °C (b), and 1150 °C (c).
IV. CONCLUSIONS
Red-emitting phosphor Ca0.8Zn0.2TiO3:0.2 mol% Pr3+ has been synthesized by the hydrothermal method with urea as mineralizer. The elevated calcination temperature does not change the shape of particles that are hollow spheres with a shell thickness of 210–480 nm, and smaller particles are in the middle of the larger ones. The increasing content of CaTiO3 phase is responsible for the enhancement of 612 nm emission. Typically, the red emission by near-UV (380 nm) excitation is enhanced dramatically by the hydrothermal method, and the excitation band in the blue region (450–500 nm) is also improved. Rhombohedral Ca2Zn4Ti16O38 and cubic Zn2TiO4 are both helpful for the enhanced intensity of band B. The intense broad excitation band around 380 nm suggests that Ca0.8Zn0.2TiO3:0.2 mol% Pr3+ calcined at 1150 °C is a potential red phosphor for near-UV-pumped white LEDs. In conclusion, the potential ideal red phosphor Ca0.8Zn0.2TiO3:Pr3+ prepared by the hydrothermal method has more excellent luminescence properties and more even grain size than the solid-state method.
ACKNOWLEDGMENTS
This work was supported by the National Natural Science Foundation of China (Grant No. 20971042), Hunan Provincial Natural Science Foundation of China (Grant No. 12JJ2029), Innovation Platform Open Foundation of Hunan Higher Education (Grant No. 12K030), and Aid Program for Science and Technology Innovative Research Team in Higher Educational Instructions of Hunan Province.