


1. Introduction
A knowledge of ice thickness is essential for the evaluation of geophysical potential field experiments (Reitmayr, 1998), for ice-dynamic modelling studies (Reference HuybrechtsHuybrechts, 1990,Reference Huybrechts1994) and for the interpretation of climate-relevant data obtained from ice-core analysis (Reference DansgaardDansgaard and others, 1993; Reference Grootes, Stuiver, White, Johnsen and JouzelGrootes and other, 1993). Unfortunately the ice-thickness maps covering central and western Dronning Maud Land (DML), Antarctica, provided by the only comprehensive folio (Reference DrewryDrewry, 1983) are based on a very sparse data base. Until now, only adjacent areas have been measured for ice thickness. The coastal region has been the subject of investigations by airborne radio-echo sounding (RES) by the former Soviet Union (personal communication from S.V. Popov, 1997 and the geophysical department of the Westfalische Wilhelms-Universität, Munster, Germany (Reference Thyssen and GrosfeldThyssen and Grossfeld, 1988), while the region at the southern border was investigated by the U. S. South Pole-Queen Maud Land traverses 1964-66 (Reference Beitzel and CraryBeitzel,1971).
An area around Novolazarevskaya has been the subject of a detailed helicopter-based RES survey (Reference Damm and EisenburgerDamm and Eisenburger, 1998) conducted along with the GeoMaud expedition of the German Federal Institute for Geoscience and Natural Resources, to enable a more detailed evaluation of gravity measurements carried out in the area during the 1995-96 expedition. The same area has also been covered by an Alfred Wegener Institute (AWI) airborne RES reconnaissance survey (Reference Meyer, Steinhage, Nixdorf and MillerMeyer and others, 1998).
As the experience of the two deep ice-core drillings at GRIP and GISP2 in central Greenland has shown, knowledge of the subglacial bed in the vicinity of the drill site is necessary to allow reliable interpretation of high-resolution paleoclimate data (Reference Alley, Gow, Johnsen, Kipfstuhl, Meese and ThorsteinssonAlley and others, 1995). In Antarctica, deep ice-core drilling has been carried out at Vostok station in order to study paleoclimate (Reference Kotlyakov and LoriusKotlyakov and Lorius, 1997). The European Project for Ice Coring in Antarctica (EPICA) has been designed to contribute to studies of paleoclimate by linking the knowledge gained from high-resolution data from deep Greenland ice cores with that from the deep Vostok drilling in Antarctica, the latter providing less detailed but far longer-time-scale climate information. To achieve this goal, two deep ice-core drillings will be carried out, one at Dome C which began in 1996-97, and the second at a place still to be determined in DML (Reference Jouzel, Orombelli and LoriusJouzel and others, 1996). To provide undisturbed layering within the ice core and a simple ice-flow regime, an ideal location for the drill site will be an area with a flat subglacial topography such as a summit position (Reference Dahl-JensenDahl-Jensen and others, 1997). Thus, knowledge of the subglacial topography in DML plays a key role in deciding where to locate the drill site for a deep ice core for climate studies.
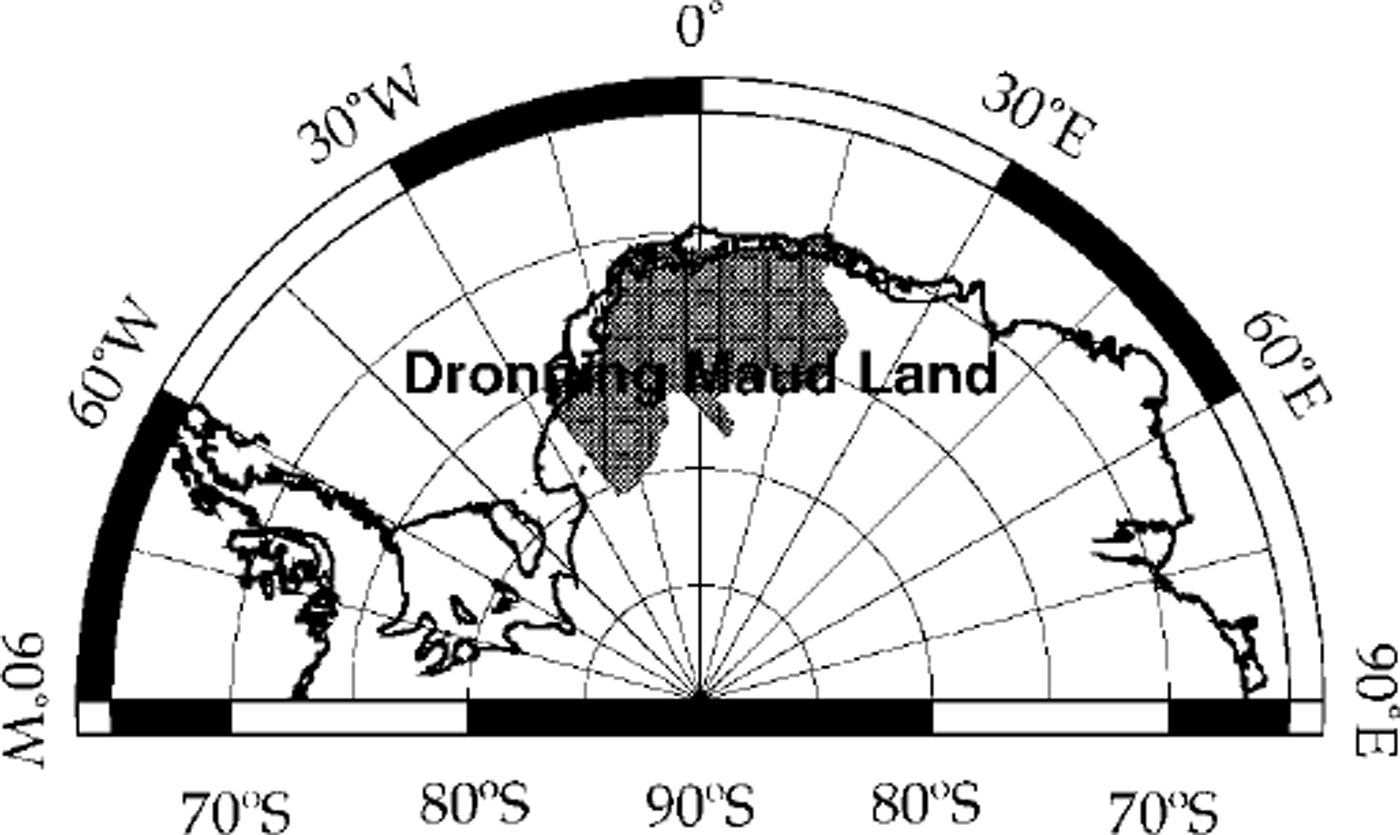
For the reasons mentioned above, the AWI is engaged in an ongoing pre-site RES survey for a drill site in DML. Figure 1 shows the area investigated in East Antarctica until 1996-97. This paper presents new maps of the ice thickness and subglacial topography determined by means of airborne RES for this region.
Location map.
2. Res Data Acquisition and Processing
Since 1994 the AWI has owned a RES system for use from its fixed-wing aircraft Polar2, specially designed for use in polar regions. This system is capable of transmitting two different bursts, one of 60 ns, the other of 600 ns duration, with a theoretical depth resolution of 5 and 50 m, respectively, using a centre frequency of 150 MHz to achieve an ice-penetration depth of up to 4000 m. The average trace increment is 3.25 m at a ground speed of 130 knots (240 km h−1). The RES data and other information such as global positioning system, navigation control data and other in-flight data are collected at a rate of approximately 1 GB h−1, and are stored on EXABYTE tapes with a capacity of 4 GB A more detailed description of the technical features of the AWI RES system is given by Reference NixdorfNixdorf and others (1999).
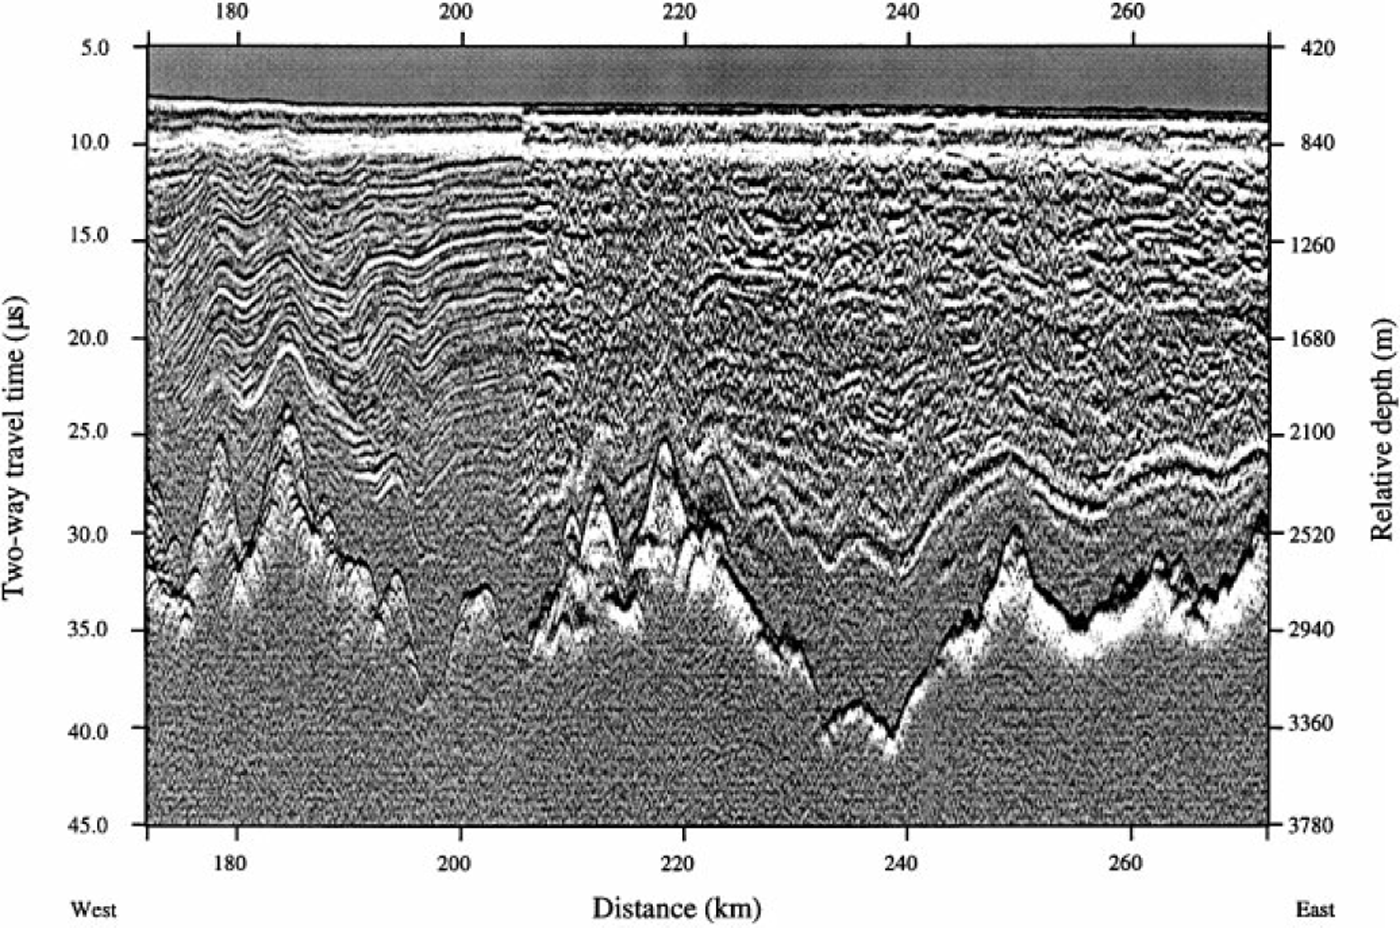
To obtain as much information as possible, the short 60 ns burst has been used to detect not only the bedrock but also internal layering. Only if the bottom reflection of the ice disappeared was the longer, more powerful 600 ns burst (with much lower resolution) used. The example in Figure 2 shows a RES section 100 km long with an average ice thickness of 2000 m. The surface in the west is located at 650 m (7.8 µs two-way travel time) and decreases by 65 m towards the east. The origin of the vertical time-scale is set to an arbitrarily chosen level in order to remove flight-level changes. The relative depth scale at the right side of the figure has been calculated using a two-way velocity of 168 m pf\ The shallowest point of the bedrock is located at the 185 km distance mark, with an ice thickness of 1180 m. The deepest reflection is observed at 240 km with an ice thickness of 2430 m. To the east of 205 km the short 60 ns transmission burst has been used, while west of it, in expectation of increasing ice thicknesses, the transmission burst has been switched over to 600 ns, revealing less detailed internal layering but more penetration depth. The first 2 μs below the surface are over-modulated due to the bright surface reflections and do not show any structure related to the ice. Since the 1996-97 field season the system has been able to toggle between the two bursts. Therefore, along a single track, two profiles are obtained providing high resolution and the largest penetration depth available from the AWI airborne RES system.
Section of a RES profile from 5.2° to 1.9° Wat 74.3° S; length approximately 100 km; position indicated as bold line in Figure 3. For further description see text.
For processing, field data recorded in flight are stripped of ancillary information, and the radar data are transformed into a format suitable for processing using seismic processing software (DISCO). This allows further processing using available industry-standard tools and has the additional advantage of ensuring data-base integration and long-term archiving and retrieval. This is necessary because of the huge amount of data collected. Figure 3 shows a compilation of all flight tracks with airborne RES carried out by AWI up till 1997-98 in DML, covering an area nearly as large as Egypt with more than 14 million unstacked traces.
Map of survey flight tracks. Bold line west of Kottas Camp indicates the position of the section shown in Figure 2

The processing procedure starts with a ten-fold stacking of the raw data to improve the signal-to-noise ratio and to reduce the amount of data. An up to ten-fold stacking has no visible effect on the horizontal resolution of the internal layering. Differentiation of the stacked traces, using a simple discrete differentiation scheme, leads to a signal structure resembling wavelets. The differentiation is necessary because applying a logarithmic amplifier rectifies the received signals, and only the envelope of the received signal is recorded. This step is followed by a mute which removes spikes at the beginning and end of traces, to avoid oscillations after filtering. Usually different filters, a band-pass and a low-pass filter, are applied due to the different bursts used.
For further signal enhancement and to compensate spherical divergence, an automatic gain control is enclosed in the processing scheme, especially to make weak subglacial reflections visible. Applying a static correction, using the recorded barometric elevation brings the ice surface in true position within the limited accuracy of this method, removes the influence of aircraft manoeuvres and eases the picking of the bedrock reflections. Both reflections, from surface and subglacial bed, have been picked interactively using a FOCUS™ marking tool (a seismic-processing software package by Paradigm Geophysical Ltd). The two-way travel-time difference of corresponding picks has been transferred into ice thicknesses using a velocity of 168 m µs 1 (Reference Bogorodsky, Bentley and GudmandsenBogorodsky and others, 1985), with an uncertainty of approximately ±30 m. A correction for the unconsolidated firn layer has been neglected, as the thickness and the velocity distribution in the firn is still unknown and the correction is expected to be small compared to the total ice thickness for the southern inland ice. Reference BlindowBlindow (1994) obtained a firn correction of 8.8 m from common midpoint measurements for the central part of the Filchner-Ronne Ice Shelf. A crossing-point analysis revealed errors within the range of uncertainty for most profiles; a typical value for crossing-point differences was < 30m. Just above the mountains of Heimefrontfjella, Kirwanveggen and Mühlig-Hofmannfjella some larger errors occurred, mainly due to side reflections.
3. Results
For this overview the data were gridded with a spacing of 0.36° in the east-west direction and 0.09° in the north-south direction using a special minimum-curvature algorithm (Reference Smith and WesselSmith and Wessel, 1990). The grid spacing is 10 km in each direction at 75.5° S. The gridding process is comparable to an extreme low-pass filtering. Therefore deviations between the original picked ice thicknesses and those from the grid along the same profile may reach 500 m, in some rare cases even more, especially in the mountainous areas of Heimefrontfjella, Kirwanveggen and Mühlig-Hofmann Gebirge.
On the basis of the measured data and additional information on outcrops (Reference Thomson and CooperThomson and Cooper, 1993), an ice-thickness grid has been produced which is presented in Figure 4 as a grey shaded contour map. The map covers >7% of the Antarctic continent, and includes large areas with no prior ice-thickness measurements. The map shows a highly variable ice-thickness distribution. The mountains, striking east-west, are recognizable as having the banana-like shape of a region with ice thicknesses of < 1000 m. Due to the still relatively large grid spacing of ≈ 10 km, the ice-free outcrops are not visible in this map. The large Jutulstraumen ice stream, located near the Greenwich meridian, and in the west the eastern parts of Bailey Ice Stream and Slessor Glacier are associated with large thicknesses, in general approximately 500 m thicker then the surrounding areas. A region around 5° W, 76° S, south of Jutulstraumen, revealed ice thicknesses nearly 1000 m greater than known before, with a maximum detected ice thickness of 3643 m. The mean ice thickness in the recently investigated area in DML is slightly more than 1570 m. Compared to the ice-thickness map published 15 years ago (Reference DrewryDrewry, 1983), it is evident that the ice is 100-150 m thicker in western and central DML than had previously been thought, and that there is no such smooth distribution as previously mapped. These results are not surprising, bearing in mind the sparse dataset on which the old map was based. Reference DrewryDrewry (1983) gave the mean ice thickness for the entire ice sheet as 2160 m. This is 590 m greater than that calculated previously for DML, and reflects the fact that DML is a mountainous region, not a homogeneous basin.
Grey shaded contour map of the ice thickness; contour interval 250 m.

Using Polar2 sensing systems, until the last season the surface topography could not be resolved to sufficient accuracy to control the satellite-derived topography data and to combine both datasets. The surface elevation data published by Reference BamberBamber (1994; see also Reference Bamber and HuybrechtsBamber and Huybrechts, 1996) have now been used to calculate the subglacial relief (see Fig. 5) based on the newly derived ice-thickness dataset. The subglacial topography displays deep trenches 500m or more below sea level beneath Bailey Ice Stream and Slessor Glacier, as well as a shallower trench beneath Jutulstraumen. South of the latter, between 75° and 77° S and 2° and 10° W, is a large region with bedrock below sea level. Because of their small size, compared to the grid spacing, the peaks of the mountains are not individually discernible, but the mountain chain is still clearly recognizable.
Grey shaded contour map of the subglacial topography, outcrops included; contour interval 250 m.
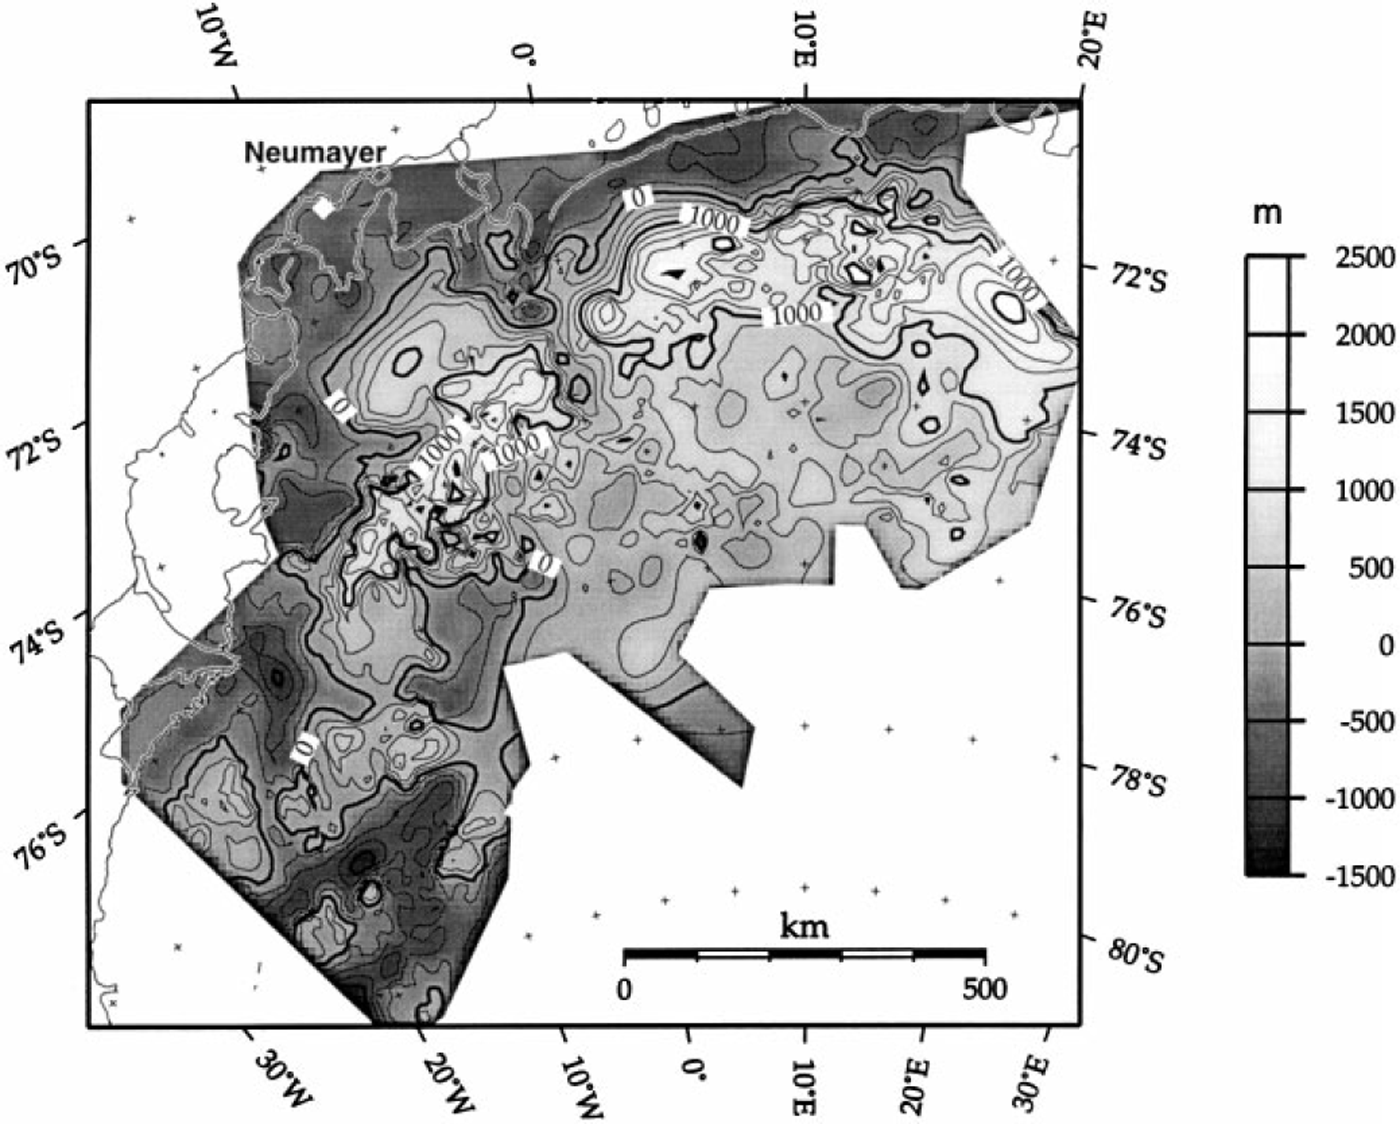
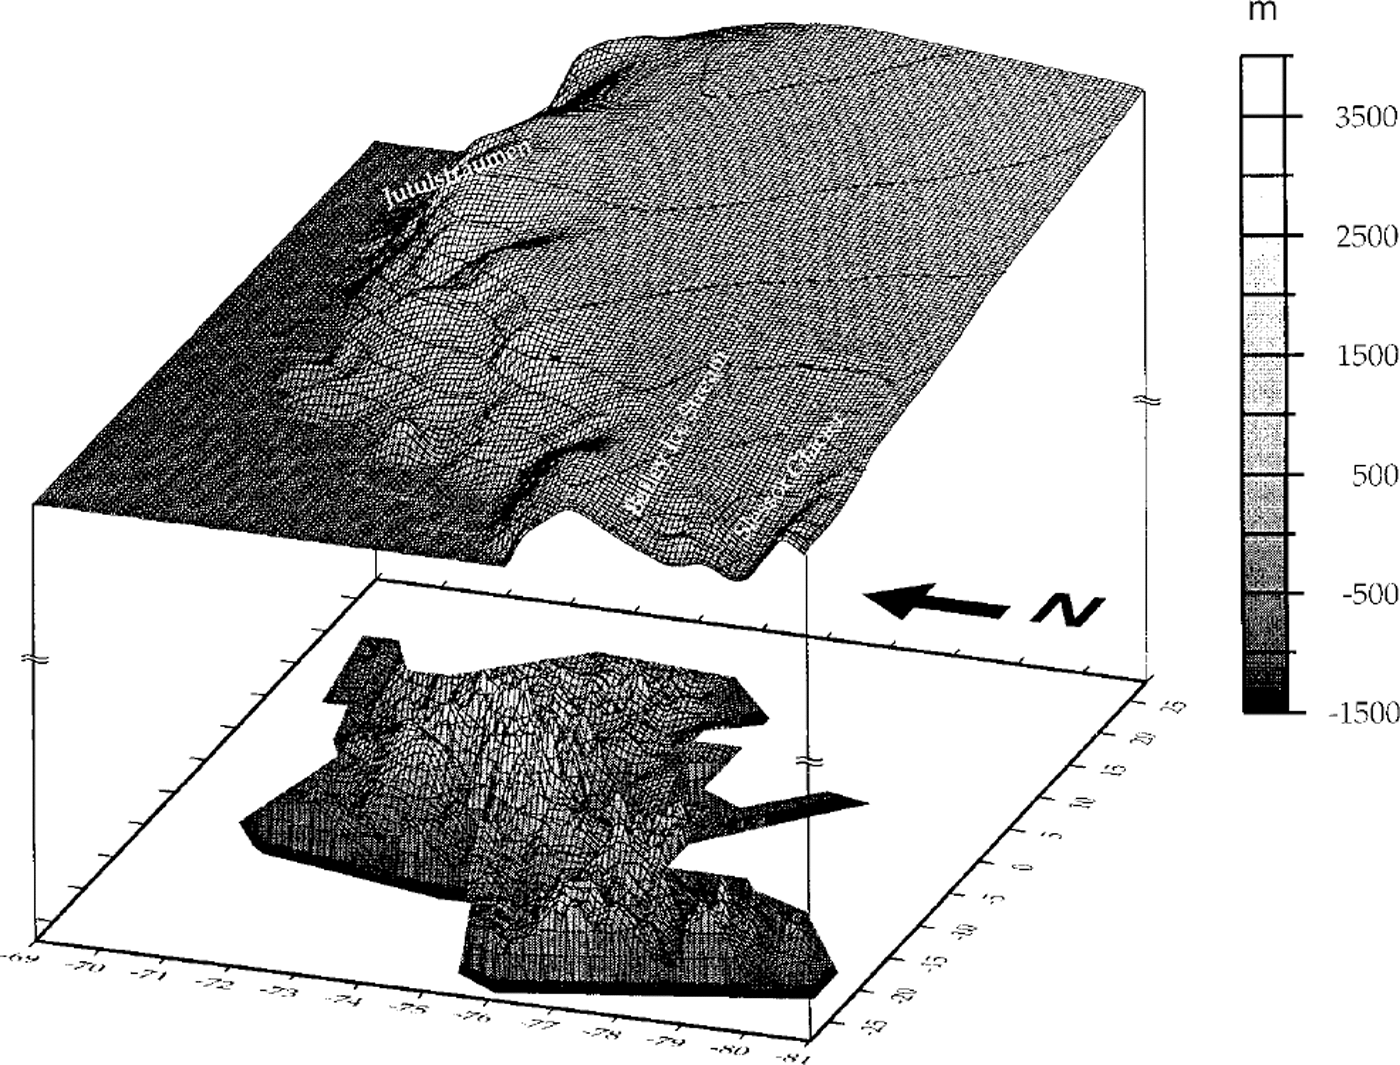
Figure 6 shows a three-dimensional view of the surface and subglacial topography, with vertical exaggeration approximately 1667 times, seen from the west and with an azimuth of 22.5°. The view provides a good look at the bed of Bailey Ice Stream and Slessor Glacier, at the front of the sketch, as well as the roughly east-west-striking mountains and the flat areas north and south of them. The beds of both glaciers are >500 m below sea level, and extend further inland than shown before. There is also a large area below sea level between 10° Wand 0° and from 75.5° S to the southern border of the covered area.
Three-dimensional view of surface and subglacial topography, outcrops included; surface topography courtesy J. L. Bamber (Reference BamberBomber, 1994; Reference Bamber and HuybrechtsBamber and Huybrechts, 1996); the contour interval is 500 m, the grey scale is valid for both surface and subglacial topography; the viewer’s azimuth is 250°, the elevation is 22.5°; for better visibility the surface is uplifted approximately 8000 m.
4. Conclusions
The basic processing of the RES data has been completed, but still more processing has to be carried out in order to interpret and discuss the nature of the internal reflectors of the ice and the subglacial topography. The RES data obtained from operations carried out from Halley Bay, Kottas Camp, Neumayer and Novolazarevskaya resolve for the first time the structure, with high spatial resolution, of the Antarctic ice sheet in central and western DML as well as the adjacent Wegenerisen. From the data it is clear that the mountain chains stretch east-west through DML and do not extend further south of Wegenerisen. The mountain peaks reach heights of >2800m. The valleys to the north are >500 m below sea level, and to the south, 1000 m higher.
These data will be used as basic information required for potential field computations and interpretation, as well as to compute a more reliable dataset for three-dimensional modelling of the recent Antarctic ice sheet and detailed modelling studies of ice movement in DML. Last but not least, the ice-thickness dataset will contribute to discussion about the location of the drill site in DML within EPIC A. Given the newly exhibited roughness of the bedrock, the drill site for a deep ice core in DML should not be chosen before a detailed RES survey is carried out in some potential regions to reveal the local ice-thickness distribution at higher resolution.
Acknowledgements
We would like to thank everyone who supported the measurements at the different skiways of Halley Bay, Kottas Gamp, Neumayer and Novolazarevskaya, especially by bringing fuel and supplies in and out. The teams of Polar2 and Polar4 as well as the engineers of Aerodata are thanked for mastering all the problems that emerged during the operations and thus guaranteeing successful work.
This work is a contribution to the "European Project for Ice Coring in Antarctica" (EPICA), ajoint European Science Foundation (ESF)/European Commission (EC) scientific program, funded by the EC under the contract ENV4-CT95-0074 and by national contributions from Belgium, Denmark, France, Germany, Italy, The Netherlands, Norway, Sweden, Switzerland and the U.K. This is Alfred Wegener Institute contribution No. 1611 and EPICA publication No. 4.



