Introduction
The concept of unmet need for contraception, which refers to the discrepancy between a fecund woman's (aged 15–49) desire to delay or stop childbearing and her practise of contraception, has been a subject of interest since the 1960s (Casterline et al., Reference Casterline, Perez and Biddlecom1997; Stash, Reference Stash1999). Though Bhushan (Reference Bhushan1997) noted that studies have concentrated on the definition and measurement of the concept, factors underlying unmet need have been receiving more attention in the 21st century. Studies such as Pasha et al. (Reference Pasha, Fikree and Vermund2001), Korra (Reference Korra2002), Bhandari et al. (Reference Bhandari, Premarajan, Jha, Yaday, Paudel and Nagesh2006), Igwegbe et al. (Reference Igwegbe, Igboaja and Monago2009) and Anand (Reference Anand, Singh and Mohi2010) have examined correlates of unmet need, the most prominent being age, education, number of children and place of residence (Chaudhury, Reference Chaudhury2001).
Ethnicity has of late been considered to be a significant measure of social position (Macassa et al., Reference Macassa, Hallquist and Lynch2011). It is defined as a group of people who have a common genealogy or ancestry and who share a language and culture (Fenton & May, Reference Fenton, May, Fenton and May2002; Culley, Reference Culley2005). Addai (Reference Addai1999) and Bauni et al. (Reference Bauni, Gichuhi and Wasao1997) asserted that ethnicity is an important factor that influences an individual's daily life in sub-Saharan Africa. Furthermore, Bauni et al. (Reference Bauni, Gichuhi and Wasao1997) confirmed that most Africans value their ethnic identity more highly than their national identity. Hence it can be assumed that, as in other parts of sub-Saharan Africa, ethnicity plays an important role in shaping an individual's behaviour in Zambia, including contraceptive behaviour.
Zambia, like other sub-Saharan countries, has a high level of unmet need (27%) because of high fertility and low contraceptive use (Bayer, Reference Bayer2002; Gribble & Haffey, Reference Gribble and Haffey2008). According to the Zambian Central Statistical Office (CSO et al., 2009), Zambia's Total Fertility Rate (TFR) stands at 6.2. The TFRs according to regions are as follows: Central (6.4), Copperbelt (4.8), Eastern (7.1), Luapula (7.2), Lusaka (4.1), Northern (7.9), North-Western (7.3), Southern (6.7) and Western (6.2). Lusaka has the lowest TFR whereas Northern has the highest. The Contraceptive Prevalence Rate (CPR) is 41%. The proportions of women using contraceptives by region is as follows: Central (33%), Copperbelt (48%), Eastern (53%), Luapula (16%), Lusaka (46%), Northern (38%), North-Western (32%), Southern (46%) and Western (33%). Thus Luapula has the lowest percentage of contraceptive users and Eastern has the highest.
Zambian census reports have revealed the existence of major variations in regional fertility (CSO, 1974, 1985, 1991, 2003). Using data from the 1950 Demographic Sample Survey of Northern Rhodesia, the 1963 Census of Africans and the 1969 Census of Population, the Central Statistical Office (CSO, 1975) confirmed that fertility was high in Northern and Copperbelt Provinces, whereas North-Western and Western Provinces had low fertility. They concluded that these variations were due to differentials in ethnic fertility. Similar conclusions were reached by two earlier studies. Mitchell's (Reference Mitchell1965) study of the urban population in towns along the railway (excluding Livingstone) confirmed the existence of ethnic variations in fertility. The Bemba and Mambwe had high fertility, whereas the Lozi and Tonga had low fertility. The Nyanja and Tumbuka belonged to the moderate fertility category. Furthermore, results of a study conducted in the capital city, Lusaka, also revealed the existence of variations in fertility among the different ethnic groups (Ohadike & Tesfaghiorghis, Reference Ohadike and Testafaghiorghis1975). According to this study, the Tumbuka had the highest fertility followed by the Mambwe (mean number of children ever-born of 4.2 and 3.9 respectively). The Nkoya had the lowest fertility (2.5) whereas the Tonga and Lozi had low fertility (3.2 and 3.1, respectively).
A recent study by Wotela & Moultrie (Reference Wotela and Moultrie2008) also provides further evidence of the existence of regional variations in fertility due to ethnic differentials. Taking into consideration the role that pre-colonial migrations played in shaping the customs and traditions of various ethnic groups in Zambia, they used multivariate cluster analysis to come up with four traditional reproductive regimes. These are based on three sets of attributes determining reproduction in traditional societies, namely economic and political organization, social and community arrangements and features governing courtship and sexual relations. The regimes are as follows: low traditional fertility (Cluster 1), medium traditional fertility (Cluster 2), high traditional fertility patrilineal (Cluster 3) and high traditional fertility matrilineal (Cluster 4). They further noted that Cluster 1's economic and political organization is advanced compared with that of the others. In addition, features governing social and community arrangements, as well as courtship and sexual relations, are strictly adhered to in this cluster. The Barotse fall under Cluster 1, whereas the Tonga belong to Cluster 2. The Mambwe and Tumbuka belong to Cluster 3 whereas the Bemba and North-Western fall under Cluster 4. Therefore, most of the ethnic groups in Zambia can be placed in clusters with high fertility.
The Zambia 2000 Census Report reveals that among the nine administrative provinces in Zambia, the Barotse is the main ethnic group (about 75% of the total) found in Western, whereas the Bemba ethnic group is the main group in Central (about 40%), Copperbelt (about 55%), Luapula (100%) and Northern (70%). The main ethnic group in North-Western is the North-Western (referred to as the Lunda, Luvale and Kaonde in this study). This comprises about 80% of the population in the region. The Tonga is the main ethnic group in Southern (about 85%) whereas the Nyanja-speaking group represents about 80% in Eastern and about 30% in Lusaka. The figures reveal that ethnic groups other than the main one are found in all the regions except for Luapula. Furthermore, among the seven broad ethnic groups (Bemba, Tonga, Barotse, North-Western, Nyanja, Mambwe and Tumbuka) identified in the 2000 Census of Population and Housing, the Mambwe and Tumbuka are not the main ethnic groups in any of the regions.
The seven broad ethnic groups are a combination of several ethnic groupings with similar histories of migration and geographical locations (Wotela, Reference Wotela2010). For example the Tonga ethnic group includes the Ila, Gowa, Lenje, Leya, Soli and Toka whereas the Lunda, Luvale and Kaonde includes the Chokwe, Kaonde, Luchazi, Lunda and Luvale. Similarly, the Mambwe ethnic group is a combination of the Lungu, Mambwe and Namwanga, whereas the Tumbuka is a combination of Tumbuka and Senga. Some of the groups included in the Barotse category are the Kwanga, Lozi, Luyana, Mashi, Nkoya and Nyengo.
According to oral tradition and archaeological findings, much of present-day Zambia was occupied by Bantu-speaking people by 1500 AD (Langworthy, Reference Langworthy and Davies1971). These people migrated from three areas: the Great Lakes Region, Luba/Lunda Kingdoms and South Africa. The Tonga and Mambwe related ethnic groups are believed to have migrated from the Great Lakes Region. However, not much is known about the migrations of these ethnic groups. This is confirmed by Watson (Reference Watson1958, p. 13), who observed that ‘there is no reliable evidence concerning the origins and previous movements of the Mambwe’. Moreover, these people came before the written recording of oral tradition, so there is a lack of information about their migrations into Zambia (Wotela, Reference Wotela2010). This could be the reason Langworthy's (Reference Langworthy and Davies1971) study on pre-colonial migrations in Zambia is silent on the migrations of the Tonga, Ila, Mambwe, Lungu and Namwanga. Despite the lack of reliable evidence about the Mambwe migrations, Watson (Reference Watson1958) noted that the Bemba found the Mambwe already settled on the northern plateau of present-day Zambia when they migrated from Congo. The Tonga settled in Southern Zambia. Most of the ethnic groups in Zambia originated in the Luba/Lunda migrations. These took place between AD 1500 and 1800 (Jaeger, Reference Jaeger1981). Examples of such groups are the Bemba who settled in Northern Zambia, the Lala, Lamba and Swaka in Central Zambia, the Aushi, Chishinga, Lunda and Ngumbo in Luapula, the Kaonde, Lunda and Luvale in North-Western Province and the Kunda, Nsenga, Tumbuka and Senga in Eastern Zambia. Notable among the groups that migrated from South Africa in the nineteenth century are the Lozi and the Ngoni (Langworthy, Reference Langworthy and Davies1971). The Lozi settled in the Western part of Zambia whereas the Ngonis settled in Eastern Zambia.
Many studies have established that ethnicity is a significant determinant of contraceptive use (Raine et al., Reference Raine, Minnis and Padian2003; DeBroe et al., 2005; Saxena et al., Reference Saxena, Copas, Mercer, Johnson, Fenton and Erens2006; McNamee, Reference McNamee2009; Upson et al., Reference Upson, Reed, Prager and Schiff2010; Laanpere et al., 2011; Mishra, Reference Mishra2011; Shih et al., Reference Shih, Vittinghoff, Steinauer and Dehlendorf2011). Most of the studies on ethnicity and contraceptive use have focused on the difference between contraceptive use among minority and major ethnic groups or indigenous and non-indigenous groups. For example, Saxena et al. (Reference Saxena, Copas, Mercer, Johnson, Fenton and Erens2006) revealed that sexually active women from minority ethnic groups in the United Kingdom were less likely to use effective methods of contraception than their White counterparts, whereas De Broe et al. (Reference De Broe, Hinde, Matthews and Padmadas2005) demonstrated that Ladino women (non-indigenous) in the Guatemalan town of Jocotan were more likely to use contraceptives than their indigenous counterparts. The results revealed that ethnicity remained a significant predictor of contraceptive use after controlling for selected socioeconomic and demographic characteristics.
However, there is a paucity of studies on the role of ethnicity on unmet need for contraception. To the authors' knowledge only three studies on correlates of unmet need have established that ethnicity was among the strongest predictors of unmet need. Korra's (Reference Korra2002) study demonstrated that total unmet need was significantly higher among women belonging to the Oromo and ‘Others’ ethnic groups than the reference group (Amharas). Unmet need for spacing was significantly higher among women belonging to all the other four ethnic groups in Ethiopia compared with the Amharas. However, only Sidamo and Tigraway women were significantly less likely to have an unmet need for limiting than the Amharas. Similarly, Wafula & Ikamari (Reference Wafula and Ikamari2007) confirmed that the Kisii were significantly more likely to have total unmet need than the Kikuyu (reference). On the other hand, the Luhya were significantly less likely to have an unmet need for spacing than the Kikuyu. Furthermore, unmet need for limiting was significantly higher among the Kamba, Luhya and Luo compared with their Kikuyu counterparts. In addition, Omwago & Khassakhala (Reference Omwago and Khasakhala2006) revealed that ethnicity was a significant predictor of total unmet need among couples in Kenya. These studies confirm that ethnicity remains a significant determinant of unmet need after controlling for other predictors.
While the aforementioned studies established that there were ethnic variations in unmet need for contraception, their objective was not to examine the association between unmet need and ethnicity. In addition, no study has yet examined the association between ethnicity and unmet need in Zambia. The objective of this study was to examine whether ethnicity is indeed an important predictor of unmet need in Zambia after adjusting for other predictors. Examining this relationship in a purposively designed study would greatly assist policymakers in making informed decisions.
Methods
Data
Data for this cross-sectional study came from the 2007 Zambia Demographic and Health Survey (ZDHS). As a nationally representative sample survey of women and men of reproductive age, the ZDHS included all the ethnic groups in Zambia. It included information on fertility and the use of family planning methods. The 2000 Census of Population and Housing of the Republic of Zambia (CPH) was used as the sampling frame comprising 16,757 standard enumeration areas (SEAs) made for the 2000 CPH. A total of 8000 households were selected using a systematic, two-stage stratified sampling procedure. All women aged 15–49 and men aged 15–59 were eligible to be interviewed. This resulted in the final sample consisting of 7146 women and 6500 men.
Sexually active never-married and formerly married women can have an unmet need for contraception, but the former were not included in this study as it includes variables related to the partner and marriage. An unmarried woman is considered to be sexually active if she had had sexual intercourse within 30 days prior to the survey (Bradley et al., Reference Bradley, Croft, Fishel and Westoff2012). Close to three-quarters (5203) of the interviewed women were either currently (4189) or formerly (732) married. Since currently married women are presumed to be sexually active whereas the formerly married are not, all of the former (4189) were included in the sample and only sexually active ones in the latter category (154) were included. Therefore, the analysis was restricted to the 4343 currently married and sexually active formerly married women who constituted the sample for this study. This study uses the term ‘ever-married’ women to refer to currently married and sexually active formerly married women.
A major limitation of the study is that since it is a cross-sectional study, data were collected at a single point in time. Therefore, it tells us only about associations not causal relationships. Nonetheless, various credible explanations for the association can be offered.
The study was based on a secondary analysis of data from the 2007 Zambia DHS which had no participant identifiers. Ethical approval was not required for the study's data analysis. Permission to use the data set was obtained from MEASURE DHS, ICF International.
Variable measurements
Outcome variable
The outcome variable was unmet need for contraception. Its measurement was based on a DHS-constructed variable. Thus, unmet need for contraception refers to the condition of a fecund currently married and sexually active unmarried woman who reported not wanting any more children or wanting to wait for at least 2 years before having the next child, but not using any contraceptives. A pregnant woman whose pregnancy was mistimed or unwanted due to non-use of contraceptives at the time she became pregnant is also considered to have an unmet need for contraception. The same applies to an amenorrhoeic woman whose last birth was mistimed or unwanted. The variable is both dichotomous and polychotomous and it was categorized as unmet need (met need, total unmet need) and unmet need (met need, unmet need for spacing, unmet need for limiting).
Independent variable
Ethnicity is the independent variable. The ZDHS has seven categories, but this study has six. This is because the Mambwe and Tumbuka were combined. Therefore the categories are as follows: Bemba=1; Tonga=2; Lunda, Luvale and Kaonde=3; Barotse=4; Nyanja =5; and Mambwe and Tumbuka=6.
Control variables
The selected socioeconomic and demographic characteristics that were included to control for compositional differences among the six ethnic groups were as follows. Demographic factors: age (15–24, 25–34, 35–49); age at first marriage (<18, 18 and above); number of living children (0, 1–2, 3–4, 5 and above); number of children ever-born (0, 1–2, 3–4, 5 and above). Geographical factors: residence (rural, urban); region (Central, Copperbelt, Eastern, Luapula, Lusaka, Northern, North-Western, Southern, Western). Partner factors: age (15–24, 25–34, 35–49, 50–59); education (no education, primary, secondary/higher); desire for children (don't know, same, more, fewer). Socioeconomic factors: education (no education, primary, secondary/higher); occupation (no work, professional/clerical, sales/services, agriculture, manual); wealth index (poor, middle, rich).
The DHS uses the wealth index to ascertain the standard of living in households. Information on indicator variables such as type of flooring, water supply, sanitation facilities, electricity, radio, refrigerator, television and telephone was collected. Principal Component Analysis (PCA) was employed to assign weight to each indicator. Factor analysis was used to achieve standardized scores and factor coefficient scores (FCS). Thereafter the household index value was generated by summing the products of indicator values and FCS or factor loadings. This sum was a standardized score with a mean of zero and a standardized deviation of one. Quintiles were then created to act as break points in the wealth index (Rutstein & Johnson, Reference Rutstein and Johnson2004). Thus each individual received a quintile of the household they belonged to.
Analysis
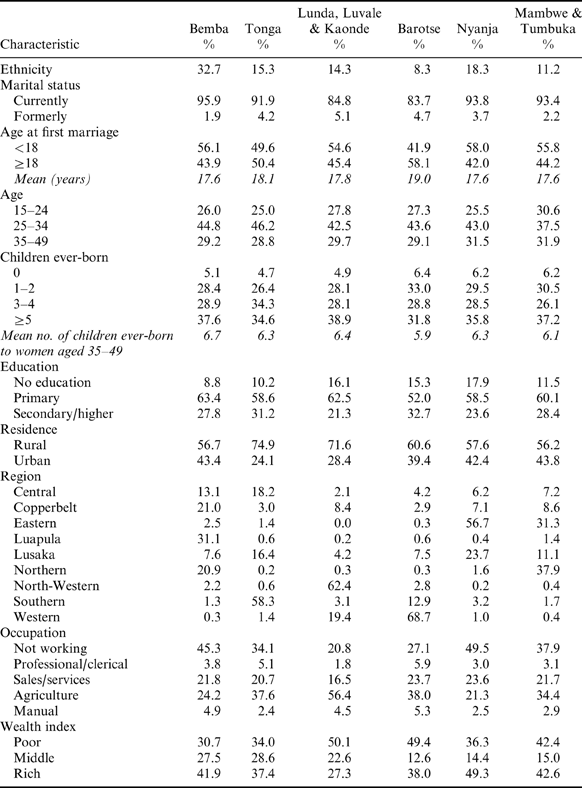
Both descriptive and inferential statistics were used to analyse the data at three levels. Selected demographic, socioeconomic and geographical characteristics of the women by ethnicity are presented in Table 1. Chi-squared tests were used to examine differences in the distribution of unmet need for contraception among the ethnic groups by the selected characteristics. Finally, five binary logistic regression models were employed to examine the association between selected characteristics and ethnic variations in total unmet need, whereas five multinomial regression models were employed to examine the association between selected characteristics and ethnic variations in unmet need for spacing and limiting. The initial model includes ethnicity only. The next model controls for demographic variables (age, age at first marriage, number of living children and number of children ever-born). The third model also adjusts for geographical factors (residence and region). The fourth model includes partner variables (age, education and desire for children). The final model adds the socioeconomic variables (education, wealth index and occupation).
Percentage distribution of selected background characteristics of women aged 15–49 according to ethnic groups, Zambia DHS 2007

The binary logistic model was employed to distinguish factors related to total unmet need because the outcome variable in this case had two categories, i.e. unmet need and no unmet need. The model was thus fitted by classifying the data into two categories: met need and total unmet need, coded 0 and 1, respectively. Therefore, the logistic regression equation employed is of the form:
 $${\rm log\ it}(p)=\alpha + \beta_1 X_1 + \beta_2 X_2 \cdots \beta_n X_n$$
, where logit(p) is the log (to base e) of the odds ratio that the outcome variable (unmet need) is 1, α is a constant (analogous to the y-intercept of the simple linear regression model); β 1, β 2 and βn are regression coefficients for each explanatory variable and X 1, X 2 and Xn represent the values of each variable for a particular woman (Lin et al., Reference Lin, Purcell and McPheeters2008). Multinomial logistic regression was employed to distinguish factors associated with unmet need for spacing from those related to unmet need for limiting. This is because in this case the outcome variable has three categories: spacing, limiting and met need. Therefore, two dichotomies had to be compared (unmet need for limiting to no unmet need and unmet need for spacing to no unmet need) instead of one. The multinomial equation was expressed as:
 $$\displaystyle {\rm log\ it}\left({j\over j^\prime}\right)=\alpha + \beta_1 X_1 + \beta_2 X_2 \cdots \beta_k X_k$$
, where j is the identified category of unmet need and j′ is the reference category (no unmet need), α is the intercept, β 1, β 2 and βk are regression coefficients of the explanatory variables and X 1, X 2 and Xk are the explanatory variables (Moutinho & Hutcheson, 2011). Data were analysed using Stata 11.1 software.
Results
Descriptive analysis
Table 1 shows the distribution of selected background characteristics of the ever-married women aged 15–49 by ethnicity. The Bembas were the majority (32.7%) followed by the Nyanja, and the Barotse were the minority (8.3%). The Mambwe and Tumbuka had the highest percentage (30.6%) of ever-married women belonging to the youngest age group, whereas the Tonga had the lowest (25.0%). Half of the Lunda, Luvale and Kaonde women (50.1%) belonged to poor households. The Lunda, Luvale and Kaonde had the highest proportion (38.9%) of women having given birth to five or more children, whereas the Barotse had the lowest (31.8%). The Barotse had the highest (32.7%) proportion of women with secondary/higher education followed by the Tonga (31.2%), and the Lunda, Luvale and Kaonde had the least (21.3%). All except the Barotse (19.0%) and Tonga (18.1%) women had a mean age at first marriage of below 18. Furthermore, the Barotse had the lowest (5.9%) mean number of children ever-born to women who had completed or were almost completing childbearing (35–49 years), whereas the Bemba had the highest (6.7%). The Nyanja had the highest percentage of women who were not working whereas the Lunda, Luvale and Kaonde had the lowest. The Tongas had the highest proportion of rural dwellers followed by the Lunda, Luvale and Kaondes, and the Mambwe and Tumbuka had the least. With reference to region of residence, the Barotse were the most homogenous whereas the Bembas were the most heterogeneous.
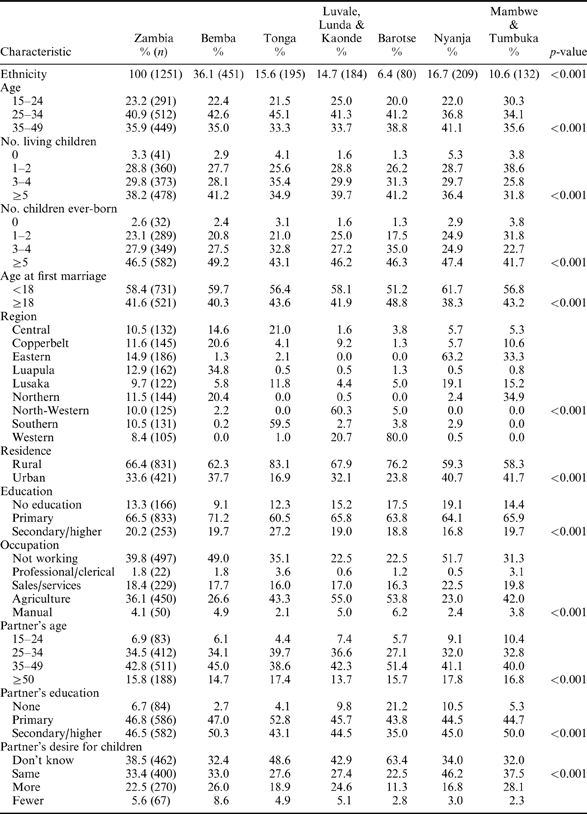
The distribution of ever-married women's unmet need for contraception according to selected characteristics by ethnicity is presented in Table 2. Pearson's Chi-squared tests revealed that the bivariate association between unmet need for contraception and all the selected characteristics was significant. Ever-married women aged 25–34 were the most likely to have unmet need for contraception; those aged 15–24 were the least likely. The Tonga had the highest proportion of these, followed by the Bemba. The Mambwe and Tumbuka had the least. Ever-married women who had given birth to five or more children had the highest unmet need for contraception, whereas those with no children had the least. The Bemba had the highest proportion of such women and the Mambwe and Tumbuka had the least. Women who had married before their 18th birthday had higher unmet need for contraception than those who married at 18 or above. The highest proportion of women with unmet need for contraception resided in Eastern Province, with most of them belonging to the Nyanja ethnic group. On the other hand, Western Province had the lowest percentage of women who had unmet need for contraception. The majority of these women belonged to the Barotse ethnic group. Unmet need for contraception was highest among women with primary education compared with those with no education and those with secondary/higher education. Most of them were Bemba by ethnicity, whereas the Barotse were the least. Those who were not working were more likely to have unmet need for contraception than those in employment. The Nyanja had the highest percentage of such women followed by the Bemba. In relation to a partner's desire for children, unmet need was highest among the women whose response was ‘don't know’. The percentage was highest among the Barotse and lowest among the Mambwe and Tumbuka.
Percentage distribution of women aged 15–49 with unmet need according to selected characteristics by ethnic groups, Zambia DHS 2007
Multivariate analysis
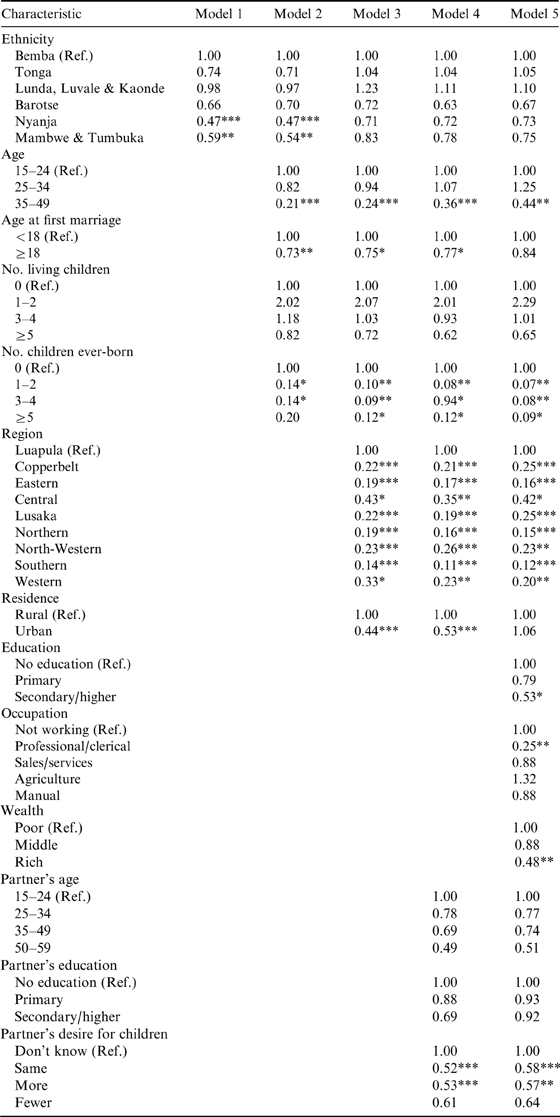
Table 3 presents the logistic regression estimates of odds ratios for selected variables of ever-married women on unmet need for spacing in Zambia. Model 1 reveals that the Nyanja and Mambwe and Tumbuka women's odds of having unmet need for spacing were significantly lower than those of Bemba women. After adjusting for demographic factors in Model 2, the effect of ethnicity on unmet need for spacing among the two ethnic groups was still significant. Women who married at age 18 and above were 27% less likely to have unmet need for spacing compared with their counterparts who married before their 18th birthday. Women aged 35–49 were significantly less likely (79%) to have unmet need for spacing than those aged 15–24. Women who had given birth to 1–2 and 3–4 children were significantly less likely (0.14 each) to have unmet need for spacing than those with no children. The inclusion of geographical factors in Model 3 eliminated the significant association between ethnicity (Nyanja; Mambwe and Tumbuka) and unmet need for spacing. The pattern of the influence of the other demographic factors on unmet need for spacing was similar to that in Model 2. Urban women were less likely (56%) to have unmet need for spacing than their rural counterparts. Women from all the regions were significantly less likely to have unmet need for spacing than those in Luapula. In Model 4, which added partner factors, the pattern of the influence of demographic and geographical factors on unmet need for spacing was still the same as in Model 3. Women whose desire for children was the same as or greater than their partner's desire were significantly less likely to have unmet need for spacing than those who did not know their partner's desire. The final model (Model 5) added the socioeconomic factors. The inclusion of these factors eliminated the significant association between age at first marriage and unmet need for spacing. The model revealed a similar pattern of the influence of the other demographic, partner and geographical factors on unmet need for spacing. Women in professional/clerical occupations were significantly less likely (75%) to have unmet need than their counterparts who were not working. Unmet need among women with secondary/higher education was significantly lower (0.53) compared with those with no education.
Odds ratios from multinomial logistic regression analyses assessing the association between selected characteristics and unmet need for spacing among women aged 15–49, Zambia DHS 2007
Ref., reference category.
*p<0.05; **p<0.01; ***p<0.001.
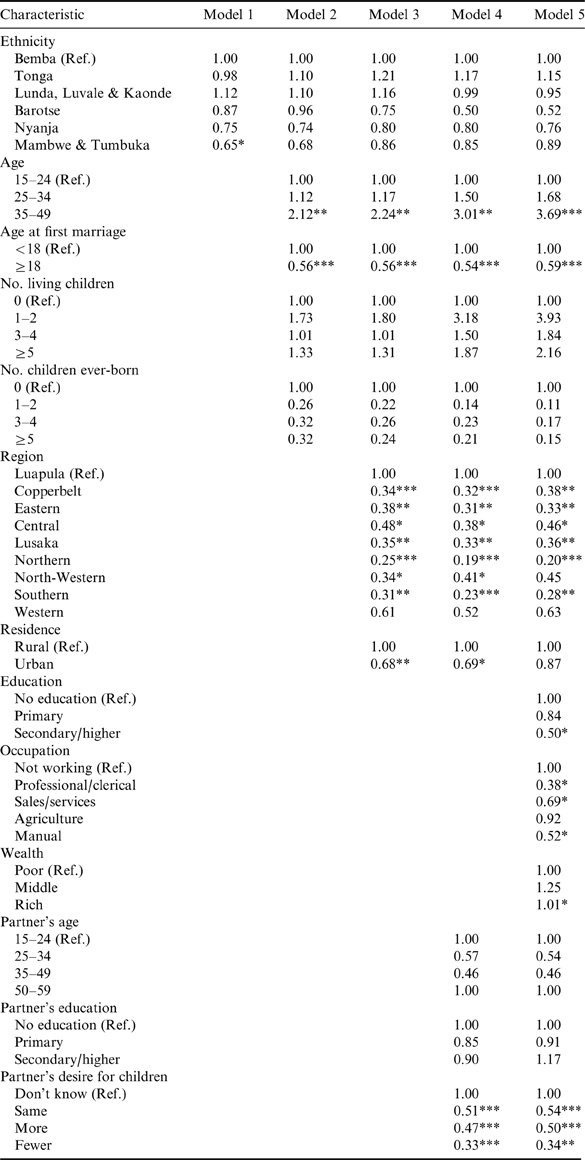
The odds of unmet need for limiting childbearing among the ever-married women belonging to different ethnic groups are presented in Table 4. In Model 1, unmet need for limiting was significantly lower (35%) among the Mambwe and Tumbuka compared with the Bemba. When demographic factors were added in Model 2, unmet need among women belonging to the Mambwe/Tumbuka ethnic group ceased being significantly lower than that of the Bemba. In addition, those who married at age 18 or more were significantly less likely (44%) to have unmet for limiting than those who married before their 18th birthday. Women aged 35–49 were significantly more likely (2.1 times) to have an unmet need for limiting than those who were 15–24. The inclusion of geographical factors in Model 3 reveals that the pattern of influence of ethnicity and demographic factors on unmet need for limiting was similar to that in Model 2. Women residing in urban areas were negatively associated with unmet need for limiting (0.68). Women who resided in all the regions were significantly less likely to have unmet need for limiting than those in Luapula, except those in the Western region. Although they were less likely to have unmet need for limiting than those in Luapula, the association was not significant. After adding partner factors in Model 4, the pattern of the influence of ethnicity, demographic and geographical factors on unmet need for limiting was similar to that in Model 3. The only difference was that women belonging to the Lunda, Luvale and Kaonde ethnic groups were now less likely to have unmet need for limiting compared with the Bemba. The association was still insignificant. Partner's desire for children was significantly associated with unmet need for limiting. In the final model (Model 5), which included socioeconomic factors, the pattern of the influence of ethnicity, demographic, geographical and partner factors on unmet need for limiting was similar to that in the preceding model. The exception is that though women residing in North-Western were significantly less likely to have unmet need for limiting, the association was not significant. Among the added factors, unmet need was significantly lower (50%) among women with secondary/higher education than those with no education. Furthermore, women in the professional/clerical, sales/services and manual occupations were significantly less likely (62%, 31% and 48%, respectively) to have unmet need for limiting than those not working.
Odds ratios from multinomial logistic regression analyses assessing the association between selected characteristics and unmet need for limiting among women aged 15–49, Zambia DHS 2007
Ref., reference category.
*p<0.05; **p<0.01; ***p<0.001.
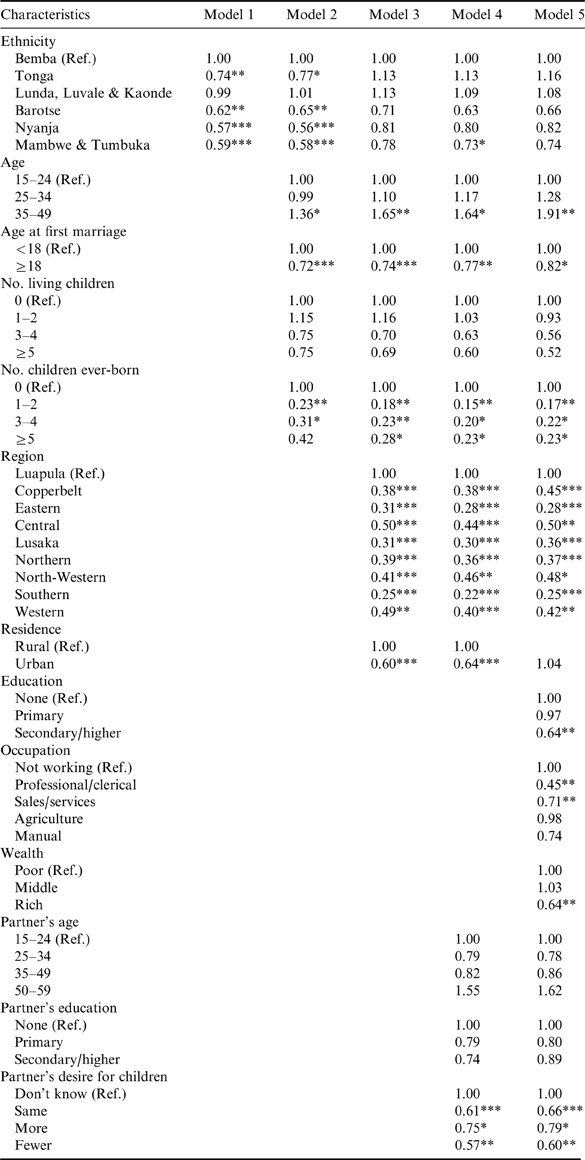
Table 5 shows the odds of having total unmet need among ever-married women belonging to various ethnic groups while adjusting for the selected characteristics. Model 1 reveals that total unmet need was significantly lower among all the ethnic groups compared with the Bemba except for the Lunda, Luvale and Kaonde. After controlling for demographic factors in Model 2, the pattern of the influence of ethnicity on total unmet need was almost the same as in Model 1. The only exception is that total unmet need among the Lunda, Luvale and Kaonde was this time slightly higher than among the Bemba, but still insignificant. Women who married at age 18 or above were significantly less likely (28%) to have total unmet need than those who married before their 18th birthday. Additionally, women aged 35–49 were 1.4 times more likely to have total unmet need than those aged 15–24. Women who had given birth to 1–2 and 3–4 children were significantly less likely (77% and 69%, respectively) to have total unmet need compared with those who had no children. The inclusion of geographical factors in Model 3 eliminated the significant association between ethnicity and total unmet need. The number of children ever-born was significantly associated with total unmet need. The pattern of the influence of the other demographic factors on total unmet need was the same as in Model 2. Women residing in urban areas were negatively associated with unmet need for limiting (0.60). Furthermore, women residing in all the other regions were significantly less likely to have total unmet need than those residing in Luapula. Model 4, which includes partner factors, reveals that the pattern of the influence of ethnicity, demographic and geographical factors on total unmet need is the same as in Model 3. The only difference is that women belonging to the Mambwe and Tumbuka ethnic groups were significantly less likely to have total unmet need than the Bemba women. Among the added variables, only partner's desire for children was significantly associated with total unmet need. When socioeconomic factors were added in Model 5, women who belong to the Mambwe and Tumbuka ethnic groups were no longer significantly less likely to have total unmet need than the Bemba women. The pattern of the influence of demographic, geographical and partner factors on total unmet need was similar to that in Model 4. Among the added socioeconomic factors, women with secondary/higher education were less likely to have total unmet need than those with no education. Women in professional/clerical and sales/service occupations were significantly less likely to have total unmet need than those not working. In addition, women from rich households were 0.6 times significantly less likely to have total unmet need than those from poor homes.
Odds ratios from binary logistic regression analyses assessing the association between selected characteristics and total unmet need among women aged 15–49, Zambia DHS 2007
Ref., reference category.
*p<0.05; **p<0.01; ***p<0.001.
Discussion
This study examines the relation between ethnicity and unmet need for contraception in Zambia. The patterns of unmet need are as expected in a high-fertility country. Unmet need was highest among those who had borne five or more children, in the most fertile age group of 25–34 years and among those married before the age of 18. Unmet need was also strongly associated with the partner's desire for children, with those whose husbands desired fewer children having the least unmet need by far compared with those with husbands who desired more, the same or who signified that they were not sure.
The Barotse had the lowest fertility (mean number of children ever-born of 5.9), which was matched by the lowest level of unmet need. This was less than the country's TFR of 6.2. A plausible explanation for Barotse women having the lowest fertility levels is their high levels of education; they have the highest percentage of women with secondary/higher education. Educated women tend to have educated children, particularly daughters (Schultz, Reference Schultz2001; Baxter, Reference Baxter2002; Korupp et al., Reference Korupp, Ganzeboom and Lippe2002). This is because educated women are role models to their daughters (Amin et al., Reference Amin, Lundborg and Rooth2011). This is in line with the classic statement made by the renowned Ghanaian scholar Dr Aggrey: ‘If you educate a man you educate an individual, but if you educate a woman you educate a nation.’
Although ethnicity (Nyanja; and Mambwe and Tumbuka) was significantly associated with unmet need for spacing in Models 1 and 2, it ceased being significant in the last three models, which included geographical, partner and socioeconomic factors. Ethnicity (Mambwe and Tumbuka) was only significantly associated with unmet need for limiting before demographic and other factors were controlled for. Ethnicity ceased to be significantly associated with total unmet need when geographical, partner and socioeconomic factors were controlled for. This suggests that cultural values and behaviour regarding contraception do not directly influence unmet need, which is contrary to the findings of Omwago & Khasakhala (Reference Omwago and Khasakhala2006).
Number of children ever-born and region of residence were the most important predictors of unmet need for spacing, whereas age at first marriage and partner's desire for children were the most important predictors of unmet need for limiting. The most important determinants of total unmet need were the number of children ever-born, region of residence, age at first marriage and partner's desire for children. Thus total unmet need combines the most important predictors of unmet need for spacing and unmet need for limiting. Unmet need for spacing and total unmet need were negatively associated with number of children ever-born. Women who had given birth to 1–2, 3–4 and 5 or more children were less likely to have unmet need for spacing and total unmet need than those with no children. This could be because women who already have children are more likely to use contraceptives to prevent pregnancy than those who have no children. On the other hand, unmet need for limiting and total unmet need were negatively related to age at first marriage. Women who married at the age of 18 or older had a lower level of unmet need for limiting and total unmet need compared with those who married before the age of 18. This is to be expected as women who marry later are more likely to negotiate the use of contraceptives with their partners than those who marry earlier. Additionally, Hogan et al. (Reference Hogan, Berhanu and Assefa1999) confirmed that women who married at the age of 18 or older were more likely to talk about family size with their partners as well as to have knowledge of at least one method of contraception compared with their younger counterparts. Furthermore, partner's desire for children was significantly associated with unmet need for limiting and total unmet need. Women whose partner's desire for children was the same as, greater than or less than their own were less likely to have unmet need for limiting and total unmet need than those who did not know. This is as expected; it can be assumed that women who do not know their partners' desire for children do not discuss family size with their partners. Hence, such women are less likely to use contraceptives. This is especially true considering that men in sub-Saharan Africa are reported to have a greater influence on reproductive decisions than their female counterparts (Dodoo et al., Reference Dodoo, Luo and Panayotova1997; Dudgeon & Inhorn, Reference Dudgeon and Inhorn2004).
The results also revealed that unmet need for spacing and total unmet need among women living in all the regions were significantly lower than among those in Luapula. In addition, unmet need for limiting among women residing in all the regions except North-Western and Western was significantly lower than among women in Luapula. A possible explanation is that Luapula has the lowest proportion of contraceptive users of all the regions. This suggests that the region is lagging behind in the provision of family planning services. Studies elsewhere also showed a significant relationship between unmet need and region of residence (Kekovole, Reference Kekovole1999; Omwago & Khasakhala, Reference Omwago and Khasakhala2006). Older women (aged 35–49) were less likely to have unmet need for spacing compared with those aged 15–24. However, unmet need for limiting and total unmet need were positively related with age. Thus, unmet need for limiting and total unmet need increased with an increase in women's age. This is expected in that older women have reached their desired fertility (Chaudhury, Reference Chaudhury2001). Women in professional/clerical occupations were significantly less likely to have unmet need for spacing than their non-working companions, whereas all occupation categories except agriculture were significantly less likely to have unmet need for limiting than the non-working ones. This indicates that there are variations in the use of contraceptives among the different occupational categories. A possible explanation could be that women in paid employment requiring certified qualifications (formal) are more motivated to use efficient contraceptive methods than those in the informal category. The study further shows an inverse relationship between all the categories of unmet need and education. Thus, unmet need decreased with increasing level of women's education. The difference was significant among those with secondary/higher education. This is supported by evidence from other studies, which show that unmet need is lower among women with better education (Kekovole Reference Kekovole1999; Kaushik, Reference Kaushik2000; Chaudhury, Reference Chaudhury2001; Wafula & Ikamari, Reference Wafula and Ikamari2007). The findings thus underscore the fact that education enhances women's ability to access information about available contraceptive methods; as a result, they are able to fulfil their desire to delay or stop childbearing by practising contraception.
Conclusion
The findings of this study reveal that despite ethnicity being a significant factor in determining unmet need for contraception in Zambia, it ceases being a significant predictor when other factors are controlled for. Number of children ever-born and region of residence are the most important predictors of unmet need for spacing, whereas age at first marriage and partner's desire for children are the most important predictors of unmet need for limiting. Other predictors are age, education and occupation. Therefore, interventions to reduce unmet need should be aimed at enhancing the socioeconomic status of women. Women should be given more access to education, especially beyond primary schooling, as it helps them make informed decisions about contraceptives. Education in turn increases their access to formal employment and thus they become motivated to use effective and efficient methods of contraception. Family planning programmes should be designed in such a way that they take into consideration the geographical variations in unmet need. Priority should be given to all the regions of Zambia except Copperbelt and Lusaka, which are the only regions with a fertility level (TFR) that is below the national average of 6.2.
Acknowledgment
The authors would like thank the University of the Witwatersrand Strategic Planning and Resource Allocation Committee (SPARC) for its support for this study. The authors also thank MEASURE DHS and ICF International for permission to use the 2007 Zambia DHS data set.