





Introduction
In democracies, elections are the central mechanism through which citizens exercise political control and democratic governments establish their legitimacy. Yet, despite the importance of elections for democratic governance, elections do not have unequivocally positive effects on all citizens; instead, elections are frequently documented to result in a gap in attitudes between winners and losers of elections, creating increasing polarization with long-term implications (Blais and Gélineau Reference Blais and Gélineau2007; Hansen, Klemmensen, and Serritzlew Reference Hansen, Klemmensen and Serritzlew2019). However, studies directly investigating whether and how being on the winning or losing side of elections affects institutional trust yield mixed results. Esaiasson (Reference Esaiasson2011) argues that elections – when conducted fairly – should increase trust overall, with any winner – loser gap primarily driven by winners adjusting their trust upwards, a finding supported by Van der Meer and Steenvoorden (Reference Van der Meer and Steenvoorden2018). Other contributions, however, point to more complex dynamics. Devine and Valgarsson (Reference Devine and Valgarsson2024) show that both winners and losers adjust their attitudes following elections, while several other studies document a more general gap between the two groups (Anderson and LoTempio Reference Anderson and LoTempio2002; Martini and Quaranta Reference Martini and Quaranta2019; Moehler Reference Moehler2009). Focusing on longer-term patterns, Kern and Kölln (Reference Kern and Kölln2022) demonstrate that repeated electoral losses can have particularly detrimental effects on trust, whereas Hooghe and Stiers (Reference Hooghe and Stiers2016) find no significant relationship between winner-loser status and electoral trust.
Such mixed findings warrant further investigation. We contribute to this debate by testing these competing expectations using a quasi-experimental ‘unexpected event during survey design’ approach (Muñoz, Falcó-Gimeno, and Hernández Reference Muñoz, Falcó-Gimeno and Hernández2020), which approximates causal inference. In contrast to prior studies that primarily rely on cross-sectional or panel data, we exploit the quasi-random timing of the fourth and fifth waves of the European Quality of Government Index (EQI) surveys (Charron et al. Reference Charron, Lapuente, Bauhr and Annoni2022, Reference Charron, Lapuente and Bauhr2024), where the fieldwork took place during elections in several European countries.
Additionally, we posit that individuals who vote for populist parties react more strongly to winning or losing than voters of other parties. While recent work by Schäfer and Wenker (Reference Schäfer and Wenker2025) shows that individuals with stronger populist attitudes respond more negatively to electoral defeat due to their antipluralist worldview, we advance a distinct but complementary argument by focusing on the narratives and cues that voters of populist parties are exposed to. Specifically, we argue that these voters are systematically exposed to anti-elite and anti-system narratives and interpret electoral outcomes through expectations formed prior to the election. Consequently, we anticipate that the winner-loser effects are amplified among populist supporters − losing can be interpreted by populist party supporters as confirmation that the system is rigged against them, while winning may be seen as overcoming systemic barriers and enabling ‘the people’ to prevail over corrupt elites (Kołczyńska Reference Kołczyńska2023).
Empirically, we employ individual-level survey data collected during 2020/21 and 2023 as part of the EQI data collection efforts (Charron et al. Reference Charron, Lapuente, Bauhr and Annoni2022, Reference Charron, Lapuente and Bauhr2024). In the 2023 round of the data collection, the fieldwork took place during several national (Poland, Luxembourg, and Slovakia) and two regional elections (Hessen and Bayern), and in round 4, the fieldwork coincided with the Romanian national elections in December of 2020. Respondents were quasi-randomly interviewed before and after elections, and we leverage this variation before and after this cut-off point to estimate whether winning or losing affects institutional trust. A causal design is particularly helpful in studying the effect of winning and losing on political trust, as voters with low levels of trust and satisfaction with democracy might vote for parties that tend to be excluded from government. Hence, it is plausible that low trust determines the choice of people’s votes and, by doing so, turns them into losers. Given that one of our theoretical arguments concerns voters of populist parties (which tend to be excluded from government), our design is particularly relevant in ruling out concerns of such reverse causality.
In addition to exploring effects in a quasi-experimental design using novel survey data, we also add to the debate on what constitutes a ‘winner’ and a ‘loser’ in elections. Previous research mainly focused on whether a party sits in the government or opposition based on the past election (Chang, Chu, and Wu Reference Chang, Chu and Wu2014; Esaiasson Reference Esaiasson2011; Singh, Karakoç, and Blais Reference Singh, Karakoc and Blais2012) or on changes in seat (or vote) shares between two consecutive elections (Hooghe and Stiers Reference Hooghe and Stiers2016; Stiers, Daoust, and Blais Reference Stiers, Daoust and Blais2018; Van der Meer and Steenvoorden Reference Van der Meer and Steenvoorden2018) or a combination of both of these operationalizations (Kern and Kölln Reference Kern and Kölln2022). In addition, we argue that individuals also update their attitudes towards institutions based on a comparison of the expected performance of a party pre-election, based on electoral polls, and the actual performance of the party, which also helps mitigate concerns of reverse causality by capturing electoral disappointment independent of voters’ prior trust levels. A similar reasoning that recent expectations matter for voters’ reactions to winning and losing has been presented by Plescia (Reference Plescia2019), who leveraged beliefs on whether a party would clear an electoral threshold or not and whether a party was expected to (and became) the largest party post-election. Our measurement in comparison is more broadly applicable to all parties, as we do not focus only on smaller or larger parties but on voters’ expectations of all parties’ performance measured through polls. As pre-election polling is gaining more media attention in Western democracies over recent years (Daoust, Durand, and Blais Reference Daoust, Durand and Blais2020) and voters often base their expectations on electoral performance on electoral polls (Barnfield Reference Barnfield2023; Blais and Bodet Reference Blais and Bodet2006; Dahlgaard et al. Reference Dahlgaard, Hedegaard Hansen, Hansen and Larsen2016; Irwin, Reference Irwin2002; Morwitz and Pluzinski Reference Morwitz and Pluzinski1996), a change in this expectation due to an over or underperformance of a party should result in a particularly strong update in attitudes, as it also affects the expectations voters might have formed about the seat share a party would achieve or their chance to enter government. We thus test the effects of elections on trust using three ‘winner-loser’ operationalizations.
Our results suggest that while in most cases, elections lead to a significant uptick in trust in national institutions overall, there is a gap between winners and losers of elections in institutional trust. This effect is not mainly due to winners adjusting their attitudes upwards but rather winners gaining and losers losing trust in several cases. Moreover, the effects found are also most pronounced among voters of populist parties on average.
In sum, this paper thus makes three key contributions to the literature. First, by employing a quasi-experimental design, we have greater causal leverage in estimating the immediate effect of winning and losing, while previous research mainly relied on cross-sectional and panel designs. Second, beyond contributing to previous research by investigating whether there is a connection between winning or losing an election, we also contribute theoretically by arguing that voters of populist parties are particularly susceptible to these effects. While previous research has argued that ideological distance moderates the effect of winning or losing, to the best of our knowledge, no research has investigated if voters of specific parties are more strongly affected by winning or losing post-election. Third, our study also contributes to the ongoing debate of what actually defines winning or losing by operationalizing the concept in three different ways and whether this matters for the results. While we follow the literature’s focus on government/opposition and relative share of votes or seats, we also go beyond previous research by evaluating the effect of winning or losing dependent on the predicted performance in election polls.
The following section reviews the literature on the winner-loser gap, which to this point has largely focused on satisfaction with democracy. While our study focuses on the gap in political trust, we argue that both satisfaction with democracy and trust can be perceived as measures of support for a system at large (Easton Reference Easton1965). Additionally, the two are highly correlated (Zmerli and Newton Reference Zmerli and Newton2007), as trust has also been argued to be, instead, an evaluation of a regime in practice, as opposed to support for a rather abstract principle of democracy (Norris Reference Norris1999, Reference Norris2017). Hence, in this study, we see trust as complementary to satisfaction with democracy, rather than a completely distinct concept. We then continue to outline our arguments on how winning and losing should affect institutional trust and why we anticipate this effect to be particularly pronounced for supporters of populist radical-right parties. Following the presentation of our data and methods, we present our research design and data, followed by the results of our causal estimation procedure, demonstrating that winning and losing elections affect trust and that the effect is particularly pronounced for voters of populist radical-right parties.
The winner-loser gap
Research consistently documents an attitudinal gap between electoral winners and losers and investigates varying contextual factors that affect the size of said gap. For instance, at the country level, institutions such as electoral systems moderate the extent to which a winner-loser gap manifests (Anderson and Guillory Reference Anderson and Guillory1997; Martini and Quaranta Reference Martini and Quaranta2019). To simplify a complex debate, under proportional systems, losers typically retain some representation, while in majoritarian systems, losing candidates have no such buffer and often result in a ‘the winner takes it all’ situation. In other words, in proportional systems, losers tend to lose less harshly, as their preferred party or an ideologically proximate party will still hold some seats and influence (Anderson Reference Anderson2005; Anderson and Guillory Reference Anderson and Guillory1997; Bernauer and Vatter Reference Bernauer and Vatter2012; Rich and Treece Reference Rich and Treece2018), while voters of a losing candidate in a majoritarian election do not benefit from such a buffer. Related to this, winning margins moderate the relationship: winners report greater satisfaction when victories are narrow, though margins of defeat do not affect losers (Howell and Justwan Reference Howell and Justwan2013).
Beyond electoral systems, the quality of democracy (Nadeau, Daoust, and Dassonneville Reference Nadeau, Daoust and Dassonneville2023), electoral fairness (Fortin-Rittberger, Harfst, and Dingler Reference Fortin-Rittberger, Harfst and Dingler2017; Magalhães Reference Magalhães2016; Moehler Reference Moehler2009), and the level of government on which the election happens, shape the size of the winner-loser gap. In higher-quality democracies, elections provide stronger signals of legitimacy, reducing losers’ discontent (Nadeau, Daoust, and Dassonneville Reference Nadeau, Daoust and Dassonneville2023), while fairly conducted elections lead to smaller attitude gaps as losers are more willing to accept their loss if elections are conducted fairly (Fortin-Rittberger, Harfst, and Dingler Reference Fortin-Rittberger, Harfst and Dingler2017; Magalhães Reference Magalhães2016; Moehler Reference Moehler2009). Notably, Daoust et al. (Reference Daoust, Nemčok, Broniecki and Loewen2024) find no significant winner-loser effects on democratic satisfaction immediately following elections in Norway, Iceland, and the Netherlands, all considered to have comparatively well-functioning institutions. However, perceptions of electoral fairness themselves are often affected by winning or losing elections, as losers have a higher likelihood of evaluating the conduct of elections as less fair compared to winners (Cantú and García-Ponce Reference Cantú and García-Ponce2015; Kernell and Mullinix Reference Kernell and Mullinix2019; Schnaudt Reference Schnaudt2023). Finally, evidence on spillovers from subnational elections is mixed: Singh, Karakoç and Blais (Reference Singh, Karakoc and Blais2012) find that winning or losing in subnational elections has an effect on national-level outcomes, while Daoust, Ridge, and Mongrain (Reference Daoust, Ridge and Mongrain2023) find no such spillover effect of subnational elections.
Focusing more directly on the mechanisms underlying the attitudinal differences between winners and losers of elections, two mechanisms are often cited to explain the gap, focusing on policy (Anderson and Tverdova Reference Anderson and Tverdova2001; Singh, Karakoç, and Blais Reference Singh, Karakoc and Blais2012) and psychology (Anderson Reference Anderson2005; Blais and Gélineau Reference Blais and Gélineau2007; Howell and Justwan Reference Howell and Justwan2013; Singh Reference Singh2014), respectively. The policy mechanism holds that losers expect fewer preferred policies to be enacted, as their preferred party has less influence over policy, lowering satisfaction, while winners expect the opposite (Anderson and Tverdova Reference Anderson and Tverdova2001; Singh, Karakoc, and Blais Reference Singh, Karakoc and Blais2012). As such, losers will be less satisfied with the policies and outputs of the system and will be less satisfied with democracy overall. Winners, in contrast, assume that more of their policy interests will be implemented and adjust their attitudes upwards.
The psychological mechanism assumes a less rational cost-benefit calculation of winners and losers of elections and rather builds on the idea of an emotional response. Like fans of a losing sports team, supporters of defeated parties experience negative emotions, leading to diminished political attitudes (Anderson Reference Anderson2005; Blais and Gélineau Reference Blais and Gélineau2007; Dalton Reference Dalton2018).
However, while the above-outlined mechanisms are argued to apply to both winners and losers of elections, several studies argue that the gap in attitudes is not driven by both winners and losers adjusting their attitudes. Instead, it is argued that winners adjust their attitudes upwards, while losers’ attitudes are assumed to remain stable (Esaiasson Reference Esaiasson2011; Nadeau, Daoust, and Dassonneville Reference Nadeau, Daoust and Dassonneville2023). Specifically, both groups may benefit cognitively from elections, which signal democratic functioning and provide voters with voice, offsetting negative emotions of defeat (Blais and Gélineau Reference Blais and Gélineau2007; Esaiasson Reference Esaiasson2011; Nadeau, Daoust, and Dassonneville Reference Nadeau, Daoust and Dassonneville2023; Van der Meer and Steenvoorden Reference Van der Meer and Steenvoorden2018).Footnote 1 This positive boost should not only raise satisfaction with democracy but also translate into higher levels of trust toward systemwide institutions, as the conduct of an election signals to voters that political institutions continue to function properly and fairly. Accordingly, based on previous investigations, we expect that elections increase institutional trust overall (Esaiasson Reference Esaiasson2011; Van der Meer and Steenvoorden Reference Van der Meer and Steenvoorden2018):
H1: Elections increase institutional trust.
However, since the resulting parliaments are filled with representatives of winning parties, their supporters should express higher institutional trust, as more trusted politicians now occupy the institution. Following Van der Meer (Reference Van der Meer2010), voters’ trust is based on four key dimensions: competence (belief in politicians’ ability to perform in line with voter expectations), commitment (intrinsic, based on shared values; or extrinsic, based on accountability), and predictability (consistency with past behavior). It is reasonable to argue that voters of a party evaluate their party higher on each of these traits compared to other parties, leading them to place higher trust in their party. Hence, if an individual’s preferred party wins, voters will place higher trust in an institution that they believe to be occupied by individuals in which they place higher trust. However, voters whose party loses an election may not experience the same upward adjustment of trust (Leiter, Clark, and Clark Reference Leiter, Clark and Clark2019).
H2: Elections increase institutional trust to a larger extent for winners of elections compared to losers.
At the individual level, research highlights several factors that shape attitudinal gaps after elections, such as valence perceptions (Leiter, Clark, and Clark Reference Leiter, Clark and Clark2019), whether a strategic or ideological vote was cast (Singh Reference Singh2014), and whether an individual is a first-time loser or has experienced electoral losses repeatedly (Delgado Reference Delgado2016). Reactions also depend on the ideological distance to the winning party: under proportional systems, defeats are softened when ideologically proximate parties win (Best and Seyis Reference Best and Seyis2021; Curini and Jou Reference Curini and Jou2016).
We argue that there is an additional factor beyond mere ideological distance that can affect voters’ reactions to winning or losing an election, namely, the ideological orientation of their preferred party.Footnote 2 Particularly, voters of populist parties should react more strongly to losing or winning compared to voters of other parties. Recent work by Schäfer and Wenker (Reference Schäfer and Wenker2025) emphasizes that individuals with stronger populist attitudes react more negatively to electoral defeat due to the anti-pluralist and conflict-oriented nature of populist ideology, and so we advance a complementary argument by focusing on voters of populist parties and the mechanisms shaping their responses. Specifically, we argue that these voters are systematically exposed to anti-elite and anti-system narratives and therefore interpret electoral outcomes through this lens. Populist parties frequently employ narratives of a corrupt elite that is dominating political systems and that these elites are purposefully keeping anti-establishment, populist parties, from left or right, out of office (Holcombe Reference Holcombe2021), referring to negative polling results and even election results as ‘rigged’ and promoting conspiracy theories to explain results (Hameleers Reference Hameleers2021; Pirro and Taggart Reference Pirro and Taggart2023). Candidates of populist parties also express lower satisfaction with democracy and more negative attitudes towards elections in general (Gaio e Silva and Lisi Reference Gaio e Silva and Lisi2024), which finds expression in messages on alternative social media that denote an ‘us vs. them’ rhetoric during elections (Hameleers Reference Hameleers2020). Exposure to such messages, in turn, increases the populist attitudes of voters of populist parties (Hameleers Reference Hameleers2021) and likely further undermines perceptions of electoral integrity (Goldberg and Plescia Reference Goldberg and Plescia2024) and creates lower trust (Dahlberg and Linde Reference Dahlberg and Linde2016). Thus, the rhetoric to which voters of such parties are exposed should result in them interpreting electoral wins and losses through the lens of an ‘us vs. them’ and ‘corrupt elite’ narrative. Evidence from Central and Eastern Europe shows that populist supporters report higher trust when their party governs and significantly lower trust when it is in opposition (Kołczyńska Reference Kołczyńska2023).
Given this, an electoral loss should be perceived as a confirmation of negative attitudes towards the system and a decrease in expressed trust in the institution, as expectations of the ‘corrupt elite’ hindering ‘the political will of the masses’ are reinforced, further undermining the trust that individuals have in institutions. Indeed, research on, e.g., electoral fairness shows that voters of populist parties in general believe elections to be less fair (Goldberg and Plescia Reference Goldberg and Plescia2024) and that voters of such parties are more likely to believe in and consume so-called ‘fake-news’ or ‘alternative news’ in which narratives of rigged elections are more often presented (Schulz, Wirth, and Müller Reference Schulz, Wirth and Müller2020; Van Kessel, Sajuria, and Van Hauwaert Reference Van Kessel, Sajuria and Van Hauwaert2020).Footnote 3
In contrast, a win could be interpreted as finally having overcome the prejudice and hurdles that the corrupt elites have put into place and a perception that the opinions of the ‘true people’ will finally find expression in parliaments. This positive effect could be funded both in emotions (i.e., the emotion of winning after a long fight) and policy-related thoughts – most voters of populist parties might hold fundamentally different beliefs than the ones expressed by governing parties and might believe that only their preferred party can bring about policy change in the desired direction. To exemplify, populist radical-right parties often hold issue ownership on migration issues, and voters of populist parties believe their party to be the only one able to address these issues appropriately (Down and Han Reference Down and Han2020). An electoral win should thus lead to an even stronger effect on the attitudes of supporters of populist parties compared to voters of other parties.
Moreover, populist actors emphasize majoritarian understandings of democracy over consensus oriented or pluralist approaches. Their claim to represent ‘the will of the people’ (Mudde and Kaltwasser Reference Mudde and Rovira Kaltwasser2017) is often linked to calls for more direct democratic instruments and a weakening of intermediary institutions such as representative legislatures and administrative bodies (Mansbridge and Macedo Reference Mansbridge and Macedo2019). As a result, election outcomes potentially carry particularly high symbolic and political significance for populist voters in comparison to voters of parties supporting democratic pluralist parties and can be interpreted as validations or rejections of popular sovereignty by them.
H3: The effect of winning and losing is stronger for voters of populist parties.
Although lower-trust individuals are more likely to support populist parties (Doyle Reference Doyle2011; Hooghe, Marien, and Pauwels Reference Hooghe, Marien and Pauwels2011), our design mitigates concerns about reverse causality. The quasi-random timing of survey fieldwork before and after elections allows us to isolate electoral effects on trust. While the arguments we develop here pertain to populist parties at large, independent of their ideology, in our design, right-leaning parties are dominant (eight right-leaning parties, three left-leaning parties).
While we, so far, mainly discussed the theoretical underpinnings of the winner-loser gap after elections as well as the potential moderating effect of populist ideology, our study also addresses two empirical shortcomings in the literature. First, most previous research leverages observational data, either cross-sectional data with outcomes measured far after an election, which could introduce confounding effects, or panel surveys (e.g., several contributions from the ‘Making Electoral Democracy Work’ project by Blais (Reference Blais2010)) conducted before and after an election to investigate potential winner/loser gaps. While valuable, these cross-sectional and panel designs limit causal inference. By contrast, we leverage the quasi-random implementation of the European Quality of Government Index survey, which enables causal estimation of short-term electoral effects, an approach that we detail below. This focus on causality is crucial, as individuals with lower prior political support may be more likely to vote for parties that are systematically excluded from government, thereby making it unclear whether losing reduces support or low support leads individuals to become electoral losers in the first place.
Second, the definition of electoral winners and losers remains contested. Many studies define winning as government entry, yet voters may still feel like winners when their party gains votes or seats, even without joining government (Kern and Kölln Reference Kern and Kölln2022; Stiers, Daoust, and Blais Reference Stiers, Daoust and Blais2018; Van der Meer and Steenvoorden Reference Van der Meer and Steenvoorden2018). Our design allows us to explore the idea that winning and losing seats matters and extends these approaches by also considering whether parties outperform or underperform relative to pre-election polls, i.e., whether a party outperforms what electoral polls predict or underperforms in comparison to polling. Voters rely on polls to form their expectations about a party’s performance (Barnfield Reference Barnfield2023; Irwin Reference Irwin2002; Morwitz and Pluzinski Reference Morwitz and Pluzinski1996; Blais and Bodet Reference Blais and Bodet2006; Dahlgaard et al. Reference Dahlgaard, Hedegaard Hansen, Hansen and Larsen2016), and therefore, any change in the expected performance should also be reflected in the update of attitudes towards institutions. Particularly, as polls will shape voters’ expectations before election day on how many seats their party will gain and how likely they are to enter government afterward, a change in performance compared to expectations should result in a change in attitudes. Hence, we argue that voters are more myopic than previous research argues and update attitudes not only based on government entry or seat share but also on short-term performance relative to polls. By defining winning and losing based on expectations, we also build directly on Plescia (Reference Plescia2019), who operationalized winning and losing based on whether a small party was expected to clear an electoral threshold and whether voters’ expectations that a party would become the largest party after an election were confirmed. Our measure of winning and losing based on poll measures follows the same logic of disappointed or surpassed expectations but is applicable to the entire set of parties in a party system. Leveraging different operationalizations is also relevant in the context of causality: voters with low levels of trust might tend to vote to a larger extent for parties that tend to be excluded from government. It is, hence, imaginable that low support determines people’s vote choice and, by doing so, turns them into losers – our measure of under- and over-performing in combination with our causal design allows us to address this concern. Using three operationalizations of winning and losing provides robustness, though we believe our theoretical elaboration of different measures of winning and losing is valuable, we do not have strong priors regarding which effect will be strongest and instead remain agnostic regarding effect magnitudes.
Research design
Our research design relies on survey data from the latest two rounds of the European Quality of Government Index (‘EQI’; see Charron et al. Reference Charron, Lapuente and Bauhr2024, Reference Charron, Lapuente, Bauhr and Annoni2022).Footnote 4 The survey, fielded roughly every three years, inquires about citizen attitudes, perceptions, and experiences, with a focus on corruption, impartiality, and quality of local/regional public services. It also includes a set of questions on trust in national institutions, political attitudes and partisanship, and demographic information, inter alia. Crucially for this study, both rounds contain a respondent-level indicator of the exact day on which the survey was administered and completed.
Identification strategy
To identify the effect of winner-loser status on trust in national institutions, we elect to employ a quasi-experimental ‘Unexpected Event during Surveys Design’ (‘UESD’) (see Muñoz, Falcó-Gimeno, and Hernández Reference Muñoz, Falcó-Gimeno and Hernández2020). The design takes advantage of an event ‘e’ that occurs while the fieldwork of a survey is ongoing. To estimate a causal effect, respondents that were interviewed prior to the event (t i < t e ) are ‘control’ cases, while those interviewed post-event (t i > t e ) are ‘treatment’ cases. Common events used by researchers in this setup are assassinations of leaders (Boomgaarden and De Vreese Reference Boomgaarden and De Vreese2007), terror attacks (Balcells and Torrats-Espinosa Reference Balcells and Torrats-Espinosa2018), political scandals (Solaz, De Vries, and De Geus Reference Solaz, De Vries and De Geus2019), or elections (Minkus, Deutschmann, and Delhey Reference Minkus, Deutschmann and Delhey2019). A recent study of the winner-loser gap in democratic satisfaction also applied this design (Daoust et al. Reference Daoust, Nemčok, Broniecki and Loewen2024).
Like other ‘natural experiment’ and quasi-experimental designs, such as regression discontinuity (RD), the UESD is used by researchers when controlled experiments are not a viable alternative. Like other designs, the UESD also relies on a set of assumptions for causal identification. First, the excludability assumption states that any differences observed in the outcome variable between the control and treatment groups are due to the event in question, not other factors during the time frame in question. Second, the temporal ignorability assumption requires that the dependent variable is not related to the timing of the interview (e.g., whether it took place pre/post the event). In other words, the selection of a respondent into control or treatment groups is assumed to be ‘as random’. In our case, being assigned to an interview prior to or after a given election was not determined based on political views, attitudes, perceptions of institutions, or socio-demographic features. Thus, any difference in the dependent variable between the two groups of respondents can be viewed as a consequence of the election. We evaluate this assumption empirically via balance tables of key covariates in the subsequent section and account for systematic differences in the two groups accordingly. Finally, the event (or resulting outcome of the event in our case) is presumed to be unexpected, such that the respondents in the control group do not anticipate it and adjust their responses to the outcome questions accordingly. We address this assumption in the section Sample, data, and variables, in which we present balance tables.
Sample, data, and variables
Due to the design, the sample employed in this study relies on respondents from a subset of EQI countries and regions where an election took place during the fieldwork. In round 5 (2023), the fieldwork took place during elections in three countries − Poland, Slovakia, and Luxembourg, along with the regional elections in two German Länder − Hessen and Bavaria. Previously, in round 4 (2020), the fieldwork was done during parliamentary elections in Romania. Thus, in total, there are 19,059 individual respondents in these four countries and two regions used in the analyses. Leveraging cases from diverse electoral contexts, our sample enables investigation of the winner-loser gap under different conditions: for instance, Luxembourg implements compulsory voting, which may moderate the gap (Singh Reference Singh2023), while the two German regional elections allow further exploration of subnational dynamics (Daoust, Plescia, and Blais Reference Daoust, Plescia and Blais2023; Singh, Karakoc, and Blais Reference Singh, Karakoc and Blais2012).Footnote 5 More details on the EQI survey and sample, along with summary statistics of all variables, are found in the online Appendix section 1.
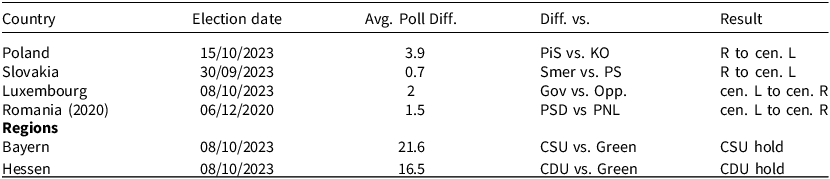
Table 1 summarizes the sample cases, along with election dates and number of observations by country/region, and hence provides information relevant to the ‘unexpected event’ assumption. In all countries, polls suggested highly uncertain election outcomes between the top two projected contenders (parties or coalitions) in the latest national polls prior to the election, whereby the differences between the two largest contenders were essentially within the margins of error. For example, in Poland, experts stressed that the high-stakes election was highly uncertain,Footnote 6 while in Luxembourg, the incumbent government was predicted to hold a slim majority but ultimately did not. In Slovakia, the polls were extremely narrow, leading to high uncertainty of any electoral winners,Footnote 7 and also in Romania (2020), polls predicted just a 1.5% difference between the two largest contenders, PSD (Partidul Social Democrat, Social Democratic Party) and the incumbent PNL (Partidul Național Liberal, National Liberal Party), the latter of which was predicted by polls to be the largest party yet finished second. Thus, while the elections themselves were expected, the results were not. By contrast, results in the two German Länder largely matched pre-election polls, meaning the assumption of ‘unexpectedness’ is less plausible there; we return to this issue later.
Sample and observations

Table 1. Long description
A table comparing election dates, poll differences, and results across countries and regions. The table has 7 rows and 5 columns. The columns are labeled Country, Election date, Avg. Poll Diff., Diff. vs., and Result. The rows are as follows: Row 1: Country, Election date, Avg. Poll Diff., Diff. vs., Result; Row 2: Poland, 15/10/2023, 3.9, PiS vs. KO, R to cen. L; Row 3: Slovakia, 30/09/2023, 0.7, Smer vs. PS, R to cen. L; Row 4: AQ20 ourg, 08/10/2023, 2*, Gov vs. Opp., cen. L to cen. R; Row 5: Romania (2020), 06/12/2020, 1.5, PSD vs PNL, cen. L to cen. R; Row 6: Regions Bayern, 08/10/2023, 21.6, CSU vs. Green, CSU hold; Row 7: Regions Hessen, 08/10/2023, 16.5, CDU vs. Green, CDU hold. The table provides information on the average poll differences and the results of elections in various countries and regions, highlighting the uncertainty and variability in election outcomes.
Note: ‘Avg. poll diff.’ refers to the mean difference in the two largest groups, highlighted under ‘diff vs.’, according to the three opinion polls in each country/region closest to the election date. In the case of Luxembourg, the difference refers to the projected seat difference between the previous government and the opposition, where the government was predicted to hold its majority in Parliament (31 to 29). ‘L’ and ‘R’ stand for ‘left’ and ‘right’ broadly speaking, according to EU parliament affiliation. The ‘result’ column shows whether there was a shift in government and in what direction or an incumbent hold.
Regarding how country-sample selection might affect the results, previous research shows that party volatility is generally higher in Eastern and Central Europe (Powell and Tucker Reference Powell and Tucker2014), implying that partisan loyalty – and partisan gains or losses – may be less salient, especially in the three former communist countries. However, political polarization has been rising in countries such as Poland, Slovakia, and Romania (Coppedge et al. Reference Coppedge, Gerring, Knutsen, Lindberg, Teorell, Marquardt, Medzihorsky, Pemstein, Fox, Gastaldi, Pernes, Rydén, Römer, Tzelgov, Wang and Wilson2024; Haughton et al. Reference Haughton, Pomorska, Malová and Deegan-Krause2024; Horonziak Reference Horonziak2022), which could amplify the trust gap between winners and losers. It is therefore an open empirical question whether winner-loser effects will be stronger or weaker in these former communist states compared to elections in Luxembourg and the German Länder.
Our main outcome of interest is trust (or confidence) in the national parliament. Respondents were asked to indicate their level of confidence on a 1–10 scale, with higher values reflecting greater confidence (see online Appendix for exact question formulation).Footnote 8 This outcome differs somewhat from many studies in the literature, which mainly rely on questions concerning democratic satisfaction, an outcome not measured in the EQI survey. On the one hand, we view both confidence in parliament and democratic support as indicators of greater latent ‘systems support’, as opposed to ‘specific support’ (Easton Reference Easton1965), and studies have shown that the two indicators are strongly correlated at the individual level (Zmerli and Newton Reference Zmerli and Newton2007). On the other hand, as Norris (Reference Norris1999, Reference Norris2017) notes, trust and confidence in parliament are evaluations of regime institutions in practice, rather than abstract democratic principles, through which citizens express broader ideals about the democratic system. We therefore treat our outcome as complementary to existing measures of system support, while distinct enough to offer a novel angle in the literature.
With regard to the explanatory variables, a key question is how to operationalize electoral ‘winners’ and ‘losers’, as previously this has been shown to be subject to the perceptions of voters rather than purely objective (Plescia Reference Plescia2019; Stiers, Daoust, and Blais Reference Stiers, Daoust and Blais2018). In most observational studies, these categories are typically clear because enough time has elapsed to form a government. In our case, however, respondents were surveyed immediately after the elections, when the status of winners and losers may have been less obvious. Due to this uncertainty, we categorize parties as winners, losers, or ‘other’ via three different approaches: First, using the power of hindsight to code what eventually became the government (‘winner’) and opposition (‘loser’) parties in each case post-election, we categorize winners and losers as those who enter government or serve in the opposition, respectively, with ‘winners’ having at least one cabinet position, which previous research has shown to be a highly salient predictor of democratic satisfaction (Singh, Karakoç, and Blais Reference Singh, Karakoc and Blais2012). Second, given that this might not have been clear to voters in all cases just days/weeks after the election, we use a simple categorical measure of seats gained (or lost) in parliament. In other words, under this operationalization, all parties that gained any seats are ‘winners’, those that lost any are ‘losers’ (regardless of eventual government status), and we also distinguish those with no difference and non-voters. In addition, we also show the continuous effects of seat gains/losses in the Appendix. Finally, it might be difficult for some voters to recall their party’s relative gains/losses compared to the previous election; thus, they rely on more recent heuristics to assess their party’s success in an election. Hence, we take data from the most recent ‘poll of polls’ published by Politico Footnote 9 before each election and create a three-category variable, whereby ‘1’ equals underperforming, ‘2’ equals over-performing, and ‘3’ equals election results that match the polls. Hence, ‘winners’ in this case are those parties that outperformed the polls, while ‘losers’ are those that underperformed in terms of the percentage of the vote.Footnote 10
Although the winner-loser measures correlate in the expected direction, they do not perfectly overlap. The seat and government winner variables demonstrate the strongest correlation, while the polling and government party measures show the lowest degree of correspondence.Footnote 11 For example, in the Polish election, supporters of Lewica (Left) are ‘winners’ in government formation yet lost seats and underperformed relative to the polling, while supporters of Konfederacia are winners in the seat measure yet ‘losers’ in government formation and also underperformed in polling. Therefore, we argue that using several different measures of this variable will provide a more robust empirical understanding of the effects of elections on political trust. For each of these three measures, we code individuals based on their self-reported vote choice.Footnote 12 Specific codings of each measure by party for each election are found in Appendix Table A3, and polling predictions and sources by party are provided in Appendix Table A4.
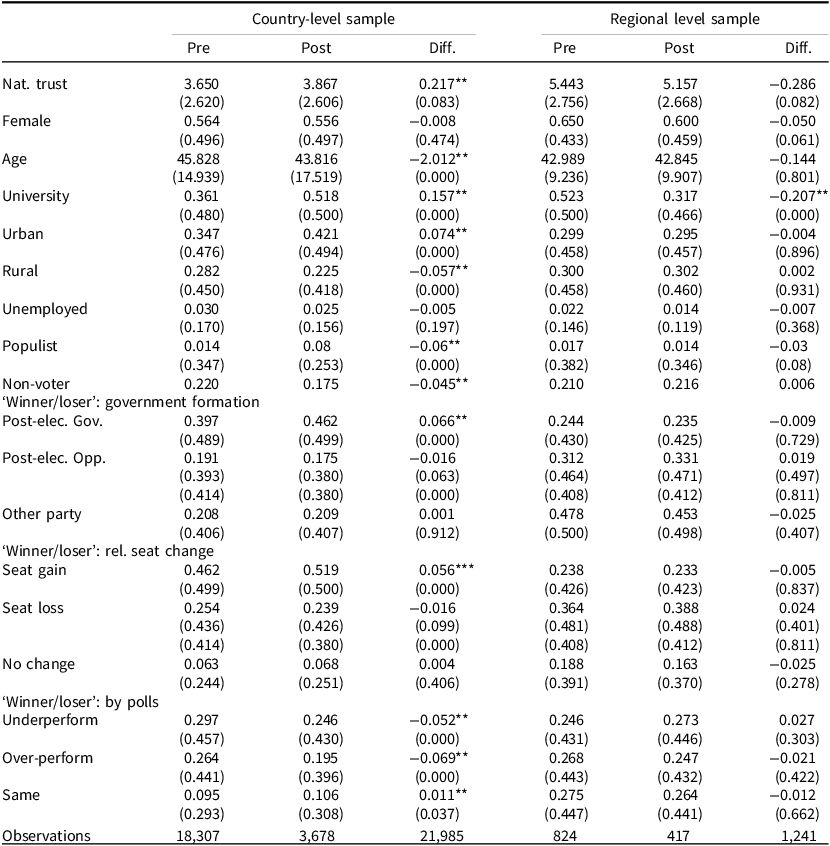
Table 2 presents a pooled balance table to assess the ‘as if’ random criterion of the design, highlighting differences in means across a number of commonly used covariates along with the dependent variable (trust) and several other perceptions of institutions.Footnote 13 First, in terms of the country-level sample, we observe that there is overall empirical support for the notion that elections enhance political support (i.e., Esaiasson Reference Esaiasson2011; Van der Meer and Steenvoorden Reference Van der Meer and Steenvoorden2018), whereby we observe (slightly) higher national trust and we see less economic dissatisfaction. In terms of relevant covariates, there is a balance among some covariates (gender and unemployment), yet the treatment group is on average two years younger, more educated, more urban, and less rural compared with the pre-election control group. In addition, there is a higher proportion of ‘winners’ and non-voters in the treatment group than in the control group, though the ‘loser’ and ‘other’ groups are statistically balanced. Following recommended practice (Muñoz, Falcó-Gimeno, and Hernández Reference Muñoz, Falcó-Gimeno and Hernández2020), we adjust for these imbalances by including the relevant covariates in our models. Finally, we note that the distribution of the number of observations across groups is skewed, with roughly 82% and 18% of the respondents falling into these categories, respectively. This imbalance varies by country – Slovakia and Luxembourg, in particular, contribute relatively few post-election observations (see Appendix section 2 for individual country tables). While not necessarily a problem for the validity of the results per se, this imbalance will lead to less statistical power in these cases, resulting in higher standard errors and more conservative inferences.
Pooled balance table − country and regional level samples

Table 2. Long description
The table presents a comparison of country-level and regional-level samples across various covariates. It includes pre-election and post-election data, highlighting differences in means. The table has 21 rows and 10 columns. The columns are labeled as Pre, Post, and Diff. for both Country-level sample and Regional level sample. The rows are labeled with different covariates such as Nat. trust, Female, Age, University, Urban, Rural, Unemployed, Populist, Non-voter, and several others related to government formation and election outcomes. Each row provides values for Pre, Post, and the difference (Diff.) between these values for both country-level and regional-level samples. Notable trends include changes in national trust, age, education level, urban and rural populations, and political affiliations. The table also includes the number of observations for each category.
Note: Pooled means of respondents pre (‘control’) and post (‘treatment’) national and regional elections, respectively. See Appendix for balance tables by each country and region. ***p < 0.01, **p < 0.05, *p < 0.1.
In the regional subsample from Hessen and Bavaria, balance is generally stronger, with the only statistical differences being among gender and education, whereby the treatment groups are less female and have less tertiary education. We thus control for these variables in the regional analysis. All other covariates are balanced, along with the control and treatment groups being closer in overall sample size than the country-level sample. Interestingly, we observe a loss in overall national-level trust as well as an increase in economic dissatisfaction immediately following the election, which suggests that perhaps the positive electoral effects on political support apply to national elections only.
Results
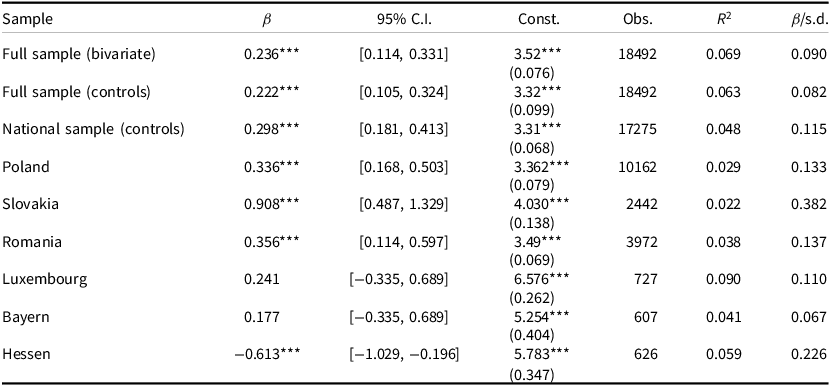
We first assess H 1 − that elections per se have a positive causal effect on citizens’ trust in political institutions. Table 3 presents the findings from linear estimation,Footnote 14 showing the pooled effects with and without control variables, country-pooled effects, along with the effects by country and region. The overall electoral effects are quite clear, particularly for national elections. There is a consistent positive effect on trust, which supports H 1 . The pooled effect with control variables is 0.22, with respect to the magnitude, which constitutes roughly 8% of a standard deviation in the dependent variable. The effects are more pronounced in the pooled, national sample (0.298), which equates to 11.5% of a standard deviation in the trust variable. Examining individual countries, the effect is considerably larger in Poland, Slovakia, and Romania, where the effect is significant at the 99% level of confidence, and also positive in Luxembourg, yet statistical power is lower in this case due to substantially fewer observations.
Effect of elections on trust − Test of H 1

Table 3. Long description
A table showing the effects of elections on trust in political institutions across different samples and countries. The table has 10 rows and 7 columns. The columns are labeled Sample, Beta, 95% C.I., Const., Obs., R-squared, and Beta/s.d. The rows are labeled with different samples and countries. The values in the Beta column range from -0.613 to 0.908. The 95% C.I. column shows the confidence intervals for the Beta values. The Const. column shows the constant values for each sample. The Obs. column shows the number of observations for each sample. The R-squared column shows the R-squared values for each sample. The Beta/s.d. column shows the Beta values standardized by the standard deviation for each sample.
Note: Effect of elections (β) on trust in national institutions reported with 95% confidence intervals (t-values in parentheses for model constant). Model 1 reports the baseline effect with country/regional fixed effects only. Subsequent models control for demographic factors (age, gender, education, unemployment, population, and survey administration). ‘β/s.d.’ is the relative effect of the election over the standard deviation of the national trust variable for the full sample and each country/region, respectively. All models adjust for post-stratification and design weights. ***p < 0.01, **p < 0.05, *p < 0.1.
Interestingly, the effects are not consistent across the two German regional elections. While the effects of elections are positive in Bayern (yet insignificant), they are negative in Hessen. This could be due to the mismatch between levels in the trust variable and elections (regional vs. national) (Daoust, Ridge, and Mongrain Reference Daoust, Ridge and Mongrain2023) or due to the fact that these are ‘second order’ elections, classified by lower turnout, poor performance by the sitting federal government parties, and stronger performance by more extreme parties (Reif and Schmitt Reference Reif and Schmitt1980; Müller Reference Müller2018). Hessen, in particular, showed significantly lower turnout in these regional elections than in the previous national election (64.9% vs. 76%) and relatively poor performance for the sitting Social Democratic Party (Sozialdemokratische Partei, SPD), along with an increase in vote/seat share for the opposition parties CDU and the far-right AfD. This indicates potentially a ‘protest vote’ of sorts that may be connected with more negative feelings toward national political institutions. Thus, while the effects are mixed when looking at the regional elections, we find rather consistent effects for national elections.
We now turn to assess the next hypothesis (H 2 ), which speaks to heterogeneous effects of elections on trust of electoral winners and losers. To test the prevalence of a ‘winner-loser’ effect, we introduce an interaction between each winner-loser variable and the event of the election. This allows us to test for diverging (or converging) effects of the election or whether any subsequent gap in trust is only driven by electoral winners or losers.
We evaluate H 2 using our three operationalizations of the winners-losers with the pooled sample in Figure 1. The figure shows the pooled, overall effects of elections by each winner-loser classification (with 95% confidence intervals), where non-voters are coded separately. Overall, we find a clear and consistent ‘winner’ effect across all three measures. For partisans whose party eventually entered government (top left), trust increases by 0.89 units on average, or roughly 35% of a standard deviation of the dependent variable. Likewise, we see a clear increase in trust post-election for ‘seat winners’ and poll over-performers, whose trust increased post-election by 0.63 and 0.64, respectively (or roughly 25% of a standard deviation). Interestingly, the effects of seat changes and poll performance are smaller in magnitude than the effect of government participation – hence, while changes in seat share and polls also matter, government participation (or the anticipation thereof) has a slightly stronger immediate effect on trust. In sum, we find support for a winner effect immediately after elections across all measures, consistent with previous research (Anderson and Guillory Reference Anderson and Guillory1997; Nadeau, Daoust, and Dassonneville Reference Nadeau, Daoust and Dassonneville2023).
Pooled winner-loser effects of elections on trust via three measures.

On the other hand, the loser effects are smaller and less consistent across measures. In the pooled results from the first two, more conventional measures, losers’ trust decreases significantly after an election by −0.41 and −0.34 units for government/opposition and seats measures, respectively.Footnote 15 This suggests that the winner-loser trust gap is driven by both winners and losers, supporting the findings of Van der Meer and Steenvoorden (Reference Van der Meer and Steenvoorden2018), where the positive effects of the winners are nearly twice that of the negative effects of the losers. However, with our third measure – the relative performance of one’s party compared with the most recent public polling – we find divergent results for the ‘loser’ group, e.g., those partisans whose party underperformed relative to recent polling. Partisans whose party underperformed relative to polls report a small (0.22) increase in trust.Footnote 16 Thus, we conclude that the results regarding the ‘loser effect’ are not as robust as those for the ‘winner’, although two of the three measures demonstrate a small negative drop in trust. Finally, non-partisans and non-voters show no change in trust, while voters whose party performed exactly as predicted by the polls report a small, statistically insignificant decrease (p = 0.12).
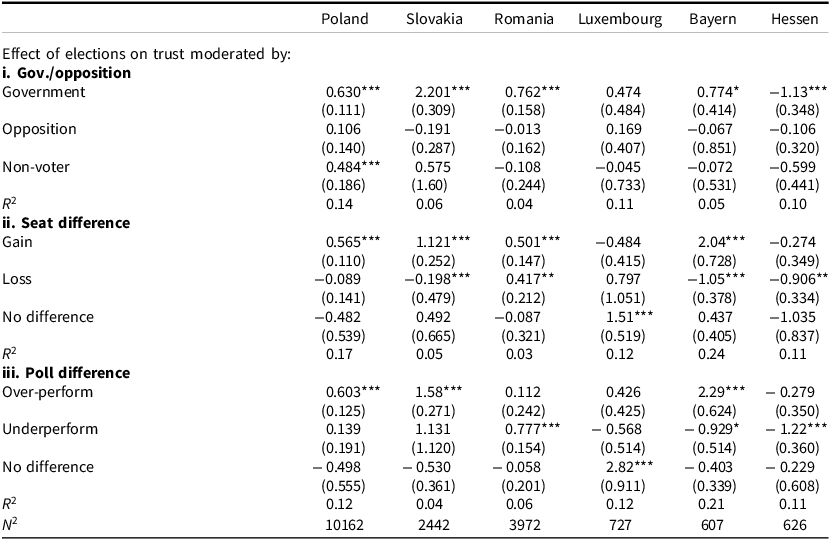
Next, we report the results from separate models by election in Table 4 for the government/opposition, seat, and poll measures, respectively. Looking into the results by country/region, we find that the effects are largely driven by changes on one side of the winner-loser gap rather than both. For instance, there is a clear winner effect in Poland, Slovakia, and the German state of Bayern for all three indicators of ‘winner’ status, with the most pronounced effects being in Slovakia.Footnote 17 In Romania, the ‘winner’ indicator has the expected effect for two of the three (yet not polling). For the case of Luxembourg, we find positive but insignificant effects for winners using the government/opposition and poll measures, yet insignificant and negative effects using the seat measure. The only case without evidence of a positive winner effect across any of the three measures is the German state of Hessen.
Effect of elections on trust moderated by the ‘winner-loser’ measure, by country/region – Test of H2

Table 4. Long description
The table presents the effect of elections on trust moderated by the winner-loser measure across different countries and regions. It includes data for Poland, Slovakia, Romania, Luxembourg, Bayern, and Hessen. The table is divided into three main sections: government/opposition, seat difference, and poll difference. Each section contains rows for different scenarios such as government, opposition, non-voter, gain, loss, no difference, over-perform, under-perform, and no difference. The values in the table represent the effect sizes and their standard errors. For example, in Poland, the government effect is 0.630 with a standard error of 0.111, while the opposition effect is 0.106 with a standard error of 0.140. The table also includes R-squared values for each section and region, indicating the proportion of variance explained by the model. Notable trends include significant positive effects for winners in Poland, Slovakia, and Bayern, with the most pronounced effects being in Slovakia. In Romania, the winner indicator has the expected effect for two of the three measures. Luxembourg shows positive but insignificant effects for winners using the government/opposition and poll measures, but insignificant and negative effects using the seat measure. Hessen does not show evidence of a positive winner effect across any of the three measures.
Note: Coefficients reported for the marginal effect of elections on trust moderated by seat and poll difference, with standard errors in parentheses. Stata’s ‘margins’ command used to calculate the effects from the interaction between elections and the two ‘winner-loser’ measures. 18 models were reported, where ‘gov./opposition’, ‘seat’, and ‘poll’ measures are used in separate models by country/region. ‘Non-voter’ category also included in ‘seat’ and ‘poll’ difference models, yet for space not included in Table 4 as the results are indistinguishable from the ‘gov/opposition’ models. Controls include gender, age, education, urban residence, unemployed and survey administration. Post-stratification and design weights included. *p < 0.10, **p < 0.05, ***p < 0.01.
Conversely, evidence for the ‘loser’ effects is much less consistent across the individual case elections. The cases most in line with expectations are Bayern and Hessen, where we observe a significant negative ‘loser’ effect for two of the three measures in each case, and a negative (yet insignificant) effect for the third, with evidence for seat loss being the most robust in both cases. Likewise, in Slovakia, those that experience seat loss show significantly lower trust after the election. Yet in the other cases, we observe either some positive effects of elections on trust among ‘losers’ (e.g., Romania for ‘seat’ and ‘poll’ measures) or we simply do not see strong enough evidence to draw inferences in either direction.
Lastly, when looking at the other groups, we find that only in Poland do elections significantly affect trust among non-partisans, with a positive effect. Luxembourg appears to be an outlier among the six elections regarding the seats measure in that partisans whose parties neither gained nor lost were those whose trust increased the most after the election. In this case, two of the three incumbent coalition parties – the Democratic Party (DP) and the Socialist Workers Party (LSAP) – gained seats, but relatively large losses by the Green Party (–5 seats) led to the coalition’s defeat. As a result, the center-right Christian Social People’s Party (CSV), whose seat share remained unchanged, was able to form a winning coalition post-election. This likely explains the positive increase in trust among the ‘no difference’ supporters. Thus, while the big-picture effects remain consistent across the measures, the way ‘winners’ are operationalized can influence the results depending on the case.
Finally, we test the last hypothesis (H 3 ), which posits that supporters of anti-establishment populist parties are more sensitive to election results in both directions. In our cases, we construct a binary variable for populist party support based on the most recent data from PopuList (Rooduijn et al. Reference Rooduijn, Pirro, Halikiopoulou, Froio, van Kessel, de Lange, Mudde and Taggart2023).Footnote 18 In total, eleven parties are coded as anti-establishment populist at the time of the relevant election, with at least one in each country or region. To assess winner-loser effects in this case, we rely on both the seat change measure and relative performance according to the latest polls. We elect not to use the government-opposition ‘winner-loser’ measure, as only two populist parties (Smer and SNS (Slovenská národná strana, Slovak National Party)), both in Slovakia, enter government; therefore, the other two measures allow for better comparison across cases.
Figure 2 summarizes the pooled effects from the seat-change (left side) and the poll-difference (right side) measures. Overall, we find strong support for H 3 − supporters of populist parties are far more sensitive to electoral results than other voters with respect to political trust, particularly when they are electoral winners. For example, electoral gains in terms of seats lead to more than double the positive effect on trust for anti-establishment populist voters compared to voters of other parties. Likewise, when populist parties over-perform relative to the most recent polls prior to the election, their trust increases more than twice as much as that of partisans of other over-performing parties. Conversely, the pooled, negative effects of electoral losers on both measures are driven entirely by supporters of populist parties, as trust is not impacted by losing seats or underperforming compared to polls for other partisans, yet populists whose results matched polling expectations lost trust by −0.25 units on average.Footnote 19 As a caveat to these results, a limitation is that populist ‘winners and losers’ are not present in every country/region case; however, most individual cases provide supportive evidence (see Appendix Figure A1). As a robustness check, we take a continuous measure of populism by party as rated by Meijers and Zaslove (Reference Meijers and Zaslove2021) and replicate the findings from the PopuList coding. We find highly consistent findings for the seat measure. For the polling measure, there are strong ‘loser’ effects, yet inconclusive winner effects (see Appendix Figure A4).
Effects of election on trust by relative seat change and performance relative to polls of preferred party for populist and non-populist voters.

Concluding remarks
What is the effect of an election on trust in political institutions among citizens? In this study, we test several hypotheses regarding the electoral effects of democratic elections on citizens’ evaluations of political institutions using recent data from the European Quality of Government Index survey (Charron et al. Reference Charron, Lapuente and Bauhr2024, Reference Charron, Lapuente, Bauhr and Annoni2022). Leveraging cases in which survey fieldwork coincided with national or regional elections, we employ a quasi-experimental design to test three primary hypotheses. First, we find evidence of an overall immediate boost in trust post-election, supporting our first hypothesis. Second, there are indeed winner-loser effects, which are mostly consistent across different operationalizations of ‘winner/loser’ (H 2 ). In this case, we find strong ‘winner-effects’ across the majority of cases that are robust to the various operationalizations. Additionally, we find some evidence for negative ‘loser-effects’, yet these are more case- and measure-specific, and the effects are smaller in magnitude than the increase in trust among winners. Finally, we test whether the effects of winning or losing elections are stronger among supporters of anti-establishment populist parties. We find consistent support that populist ‘winners’ increase political trust at significantly higher rates than non-populist partisans. Moreover, losing has a substantially greater negative effect on trust among populists compared with non-populists, supporting our third hypothesis and in line with recent work by Schäfer and Wenker (Reference Schäfer and Wenker2025).
This study contributes to research on the winner-loser gap in several ways: First, by leveraging the quasi-random implementation of the EQI survey, we provide causal estimates of the immediate electoral effect of winning and losing on political trust; we contribute to previous research, which mainly relied on observational data with a longer time lapse from the elections included so far. By demonstrating that winning and losing elections results in a causal updating of attitudes towards institutions and that this update is not unequivocally positive, we also draw into question the extent to which measures of trust in institutions truly capture perceptions of the institution itself. They may instead also reflect voters’ evaluations of the actors who populate the institution.
In addition, we extend previous conceptualizations of winning and losing beyond participation in government or a change in seat share by arguing that voters also evaluate their party’s performance relative to recent polls. Indeed, our results show interesting variation depending on the operationalization of winning and losing, such that eventual government participation (or anticipation thereof) has stronger effects on trust than a change in seat share. Performance relative to polls also shows larger effects, particularly among voters of populist radical-right parties. Our findings also demonstrate some heterogeneity across cases, highlighting the importance of the context and level (country or region) in which elections take place. Thus, while the overall pooled effects tend to be robust, the effect magnitude varies across countries and elections. Finally, by theorizing why populist radical-right voters are particularly sensitive to winning or losing, we contribute to theoretical development in the field.
These findings also have important implications for democratic politics. That elections can produce immediate increases in institutional trust suggests that democratic contests continue to function as moments of renewal. At the same time, the asymmetric effects of winning and losing, particularly among populist voters, raise concerns that elections could deepen affective polarization.
While our study makes important contributions to the field of winning and losing elections, it is not without shortcomings. First, it cannot assess the long-term effects of winning or losing − i.e., we cannot conclude whether voters continue to update their trust once a new government takes office.Footnote 20 Similarly, our study cannot identify the mechanisms underlying changes in institutional trust. We cannot investigate whether voters update their attitudes based on experiencing the emotion of winning or losing or whether they base their updated attitudes on policies in line with their preferences being implemented by individuals in whom they have higher trust. Similarly, we cannot establish whether the exposure to populist messages drives populist voters’ attitude change or whether the effect is driven by other mechanisms. Future research should examine the drivers of these attitude updates, building on the work of Daoust, Plescia, and Blais (Reference Daoust, Plescia and Blais2023) and investigating why populist, anti-establishment voters respond more strongly.
With respect to future research, understanding whether these immediate shifts in trust persist, and through which mechanisms, is critical both for refining theories of political behavior and for assessing the durability of democratic legitimacy.
Supplementary material
The supplementary material for this article can be found at https://doi.org/10.1017/S1475676526101625.
Data availability statement
Data is publicly available.
Acknowledgements
We are grateful for feedback from the participants of the ECPR General Conference 2025 and for the helpful feedback from three anonymous reviewers.
Funding statement
This work was supported by the European Commission, DG REGIO [grant number 2022CE16BAT039].
Competing interests
The authors have no competing interests to declare.
Ethical standards
Not relevant.
Use of AI
Not relevant.



 Open access

