Introduction
Recently, there has been an increasing amount of research in rare earth doped semiconductors for optoelectronics. As opposed to traditional light emitters that rely on conduction band edge recombination to produce photons, rare earth doped (RE) materials utilize electronic transitions involving the 4f shells of the rare earth element. With REs, the emission wavelength is host insensitive as the 4f shells are well shielded from the atomic bonding 5s and 5p shells. RE doping has been investigated in several semiconductor systems with various degrees of success [Reference Wang and Wessels1-Reference Benton, Michel, Kimerling, Jacobson, Xie, Eaglesham, Fitzgerald and Poate4]. While the emission wavelength is host material insensitive, the emission intensity is not. In particular, the larger the bandgap and the more ionic the semiconductor, the greater the RE luminescence [Reference Favennec, L’Haridon, Moutonnet and Guillo5,Reference Zavada and Zhang6]. The wide bandgap III-nitrides are therefore attractive as a host material, and offer the advantages of a high degree of structural and thermal stability. Already, several reports have been made of RE doping of GaN for both visible (Eu, Er, Tm) and IR emission (Pr, Er) [Reference MacKenzie, Abernathy, Pearton, Hommerich, Ren, Wilson and Zavada7-Reference Birkhahn, Garter and Steckl13]. Doping with Er is particularly attractive due to its 1.54 µm emission, which exploits the attenuation loss minima of silica fibers. It has been found that codopant impurities (O, C, F) can enhance the luminescence and efficiency of Si:Er [Reference Markmann, Neufeld, Sticht, Brunner, Abstreiter and Buchal14-Reference Franzó, Coffa, Priolo and Spinella18], but only when introduced in the proper Er/Impurity ratio. While it has been shown that addition of elements such as C and O can enhance the IR emission from GaN:Er [Reference MacKenzie, Abernathy, Pearton, Hommerich, Wu, Schwartz, Wilson and Zavada8], there has as yet been no systematic investigation of the role of the concentration of these codopants in the luminescence and surface properties of the GaN films. In this work, the effect of C codoping introduced via CBr4 on the structural and optical properties of GaN:Er films grown on sapphire by gas source molecular beam epitaxy (GSMBE) has been investigated in an attempt to address these issues.
Experimental Details
Films were grown by GSMBE in a modified Varian INTEVAC Gas Source Gen II on In-mounted (0001) Al2O3. A high temperature surface nitridation preceded all layer growth, and was performed at a temperature of 865 °C. A 10 nm low temperature AlN buffer layer (Tg = 435 °C) was then grown using dimethylethylamine alane (DMEAA) as the aluminum source. This was followed by a 1.2 µm GaN, GaN:Er, or GaN:Er:C layer, grown at a temperature of 750 °C. Solid source effusion cells provided the gallium (7N) and erbium (4N) fluxes, while the carbon was provided by the surface decomposition of CBr4. The CBr4 was injected into the growth chamber using an ultrapure helium (6N) carrier gas and a CBr4 bubbler temperature of 0.0 °C. Reactive nitrogen for the nitridation and for the growth of both the AlN and GaN layers was provided by an SVT RF plasma source operating at 375 W of forward power and 3 sccm of N2. The shuttered erbium cell was maintained at a temperature of 1250 °C, which corresponds to a dopant level of approximately 6 × 1021 cm−3 from SIMS analysis of previous results. The room temperature Er+3 photoluminescence at 1.54 µm (PL) was excited using the 514.5 nm line of an Ar ion laser and measured with an LN2 cooled InGaAs photodetector. The surface morphology was characterized by atomic force microscopy (AFM) using a Digital Instruments Nanoscope III and by scanning electron microscopy (SEM) using a JEOL 6400.
Discussion
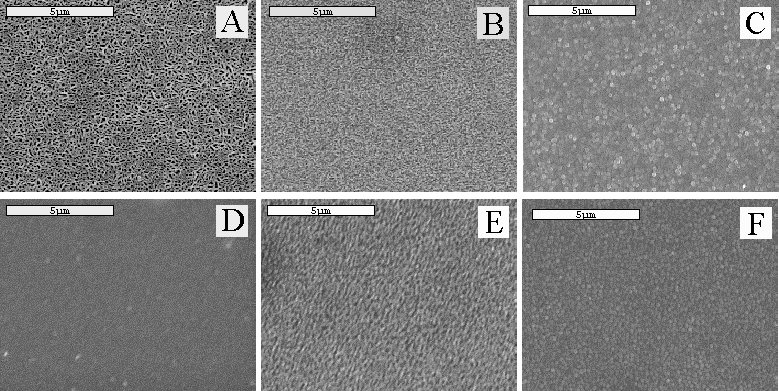
The surface morphologies of the GaN:Er samples codoped with different C levels from the CBr4 source are shown in Figure 1. SEM micrograph A shows the undoped GaN surface. In micrographs B through D, as the CBr4 flow, and therefore the C concentration, is increased, the round surface features decrease in size. A smooth morphology was obtained in GaN:Er that was codoped with roughly 1.3 × 1020 cm−3 of C. Upon further codoping, shown in micrograph E, it would appear that the round surface features then increase in size. At the highest codopant level, shown in micrograph F, they appear to decrease in size again. The C concentration in micrograph F was approximately 1.3 × 1021 cm−3. From the SEM data, it would appear that the initial increase in film smoothness is due to a reduction in the GaN domain size. GaN grown by MBE often exhibits a columnar structure that is induced by the large lattice mismatch between the GaN and the sapphire.
SEMs of GaN and GaN:Er with a progression of CBr4 doping (CBr4 in sccm): (A) GaN, (B) GaN:Er, (C) GaN:Er (CBr4=3.2×10⁻³), (D) GaN:Er (CBr4=1.6×10⁻²), (E) GaN:Er (CBr4=7.9×10⁻²), and (F) GaN:Er (CBr4=1.6×10⁻¹).

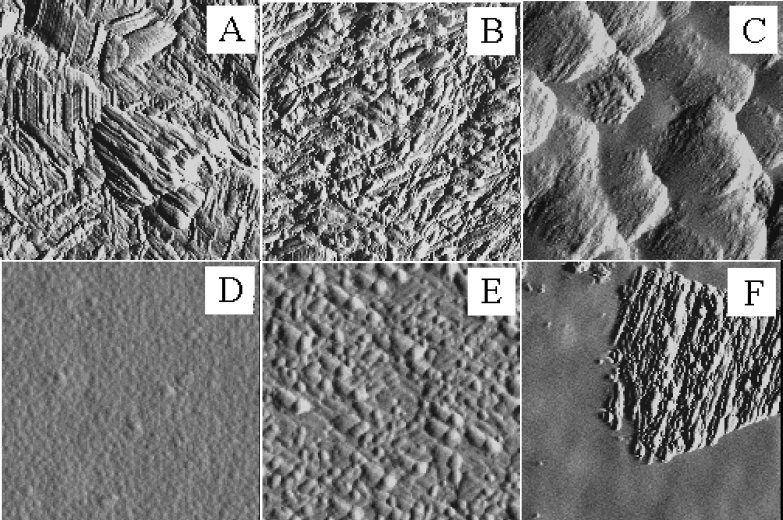
As with the SEM, AFM measurements of the GaN:Er surface roughness indicate an initial improvement in morphology with increasing C level, as shown in Figure 2. The RMS surface roughness of the undoped GaN film was found to be approximately 73.5 Å. Upon the addition of Er, and with subsequent C addition, the surface roughness initially decreased by a factor of seven. However, with further C addition, the surface roughness increased dramatically. It is possible that at this C concentration (∼6×1020 cm−3), the GaN has reached its solubility limit. The increase in surface roughness could then be due to the incorporation of C in the form of defects, clusters, or precipitates. High levels of crystal defects were observed in Si:Er when the material system was “overdoped” with O [Reference Priolo, Coffa, Franzó, Spinella, Carnera and Bellani17]. With further C addition, the surface roughness drops for a CBr4 flow of roughly 0.16 sccm. As shown in the AFM in Figure 3, rough regions and very smooth regions characterize this sample. The solid line in Figure 2 represents the overall surface roughness of the whole sample, while the dotted line represents the surface roughness of the smooth regions only. Note that there is roughly an order of magnitude drop between the two values. This suggests that coarsening effects due to increased C incorporation is opposed by surface etching of the GaN by Br left over from the CBr4 decomposition. When the AFM surface scans, given in Figure 3, are examined in detail, it appears that the growth mode is altered for samples A through D. These results suggest that first the Er, then the C, may interfere with the surface migration of the reactant species, resulting in a smoother, less textured surface. The obvious roughening in micrograph E gives further credence to the theory that the GaN has reached its solubility limit for C, and that the roughening is due to an enhanced number of defects. Finally, in micrograph F, the defect related roughening is partially compensated by Br assisted surface etching.
GaN:Er RMS roughness vs. CBr4 flux.

AFM surface scans of GaN with a progression of Er and C doping (CBr4 flux in sccm): (A) GaN, (B) GaN:Er, (C) GaN:Er (CBr4=3.15×10⁻³), (D) GaN:Er (CBr4=1.6×10⁻²), (E) GaN:Er (CBr4=7.97×10⁻²), and (F) GaN:Er (CBr4=1.6×10⁻¹). Scan dimensions were 1 µm × 1 µm × 5 nm.

Figure 4 shows that the growth rate of the GaN: Er at first increases slightly with C incorporation, but then decreases as more C is added. The decrease in the growth rate at higher CBr4 fluxes is almost certainly due to the Br species left over from the thermal decomposition of the CBr4 at the growth surface which parasitically etches the GaN. Enhanced Br levels (and etch rates) due to the higher C fluxes will produce lower overall growth rates for the same initial GaN growth rate. Similar behavior has been observed in GaAs, GaP and AlGaAs [Reference Abernathy, MacKenzie, Pearton and Hobson21].
GaN:Er growth rate vs. CBr4 flux.

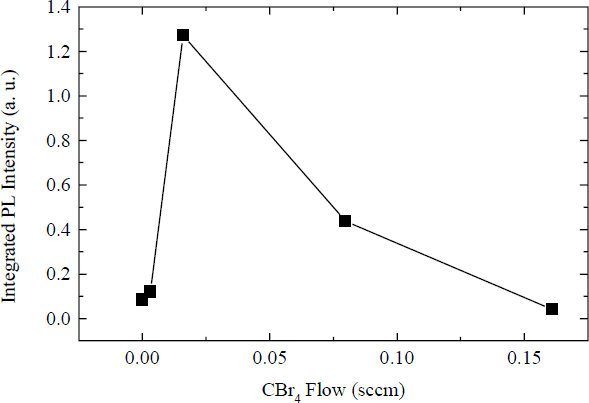
The PL analysis, depicted in Figure 5, shows that the normalized PL intensity at first increases sharply with increased C content (over the non C-doped sample), and then decreases. This result indicates that for the Er concentration used (∼6 × 1021 cm−3), the optimum codoping concentration of C is approximately 1.3 x 1020 cm−3. The initial increase in PL can be attributed to C affecting the local environment of the Er atoms. Normally, electric dipole radiation from 4f Er+3 transitions would be forbidden due to the parity selection rule. It has been found that a noncentrosymmetric crystal field leads to parity intermixing, resulting in a finite lifetime for radiative decay. Such a crystal field can be produced by the formation of Er-C complexes, allowing efficient Er+3 pumping. It has also been suggested that a reduction in deep levels in the GaN, as well as enhanced promotion of Er from the +2 state to the +3 state by Er-C centers will produce a luminescence enhancement [Reference Coffa, Priolo, Franzó, Polman, Libertino, Saggio and Carnera15,Reference Priolo, Coffa, Franzó, Spinella, Carnera and Bellani17]. The decrease in the PL luminescence at high CBr4 flows can be attributed to the further increased number of C atoms surrounding the Er producing nonradiative decay centers in the GaN matrix material. The nonradiative sites could be produced as a result of C-C clustering, precipitates, C related defects, and C atoms not linked to Er atoms. Similar results (optimum codopant level, enhanced nonradiative decay) have been seen previously in work done with Si:Er codoped with O [Reference Markmann, Neufeld, Sticht, Brunner, Abstreiter and Buchal14,Reference Priolo, Franzó, Coffa, Polman, Libertino, Barklie and Carey16].
Integrated PL intensity of the Er+3 emission at 1.54 µm vs. CBr4 flow.

Conclusions
It has been shown that GaN:Er codoped with increasing levels of C initially exhibits similar changes in surface roughness as does GaN:Er doped with increasing Er levels. Morphology initially improves, but then roughens when the GaN:Er appears to reach its C solubility limit. Growth rate and RMS roughness measurements also show that parasitic etching from Br released by CBr4 decomposition becomes important at high CBr4 flow rates. Finally, the integrated 1.54 µm PL intensity reaches a maximum for an optimum C concentration, similar to work done with Si:Er:O. This indicates Er-C complex formation initially increases the PL, but further codoping creates defects that enhance nonradiative recombination.
Acknowledgements
The authors acknowledge the support of the U. S. Army Research Office under Contract No. DAAG55-98-1-0216. The assistance of S. M. Donovan with SEM is also greatly appreciated.