Introduction
Child marriage is defined as a formal marriage or informal union involving a boy or girl below the age of 18. It is a stark reality for many young girls all over the world and poses challenges for women’s health, education and other development outcomes. The incidence of child marriage across a set of 60 countries has reduced globally over the last few decades, but only slowly from 51.2% among women born between 1955 and 1959 to 40.3% among women born between 1985 and 1989 (Nguyen & Wodon, Reference Nguyen and Wodon2015). As a result, child marriage remains widespread. Although the sub-Saharan Africa and South Asia regions have experienced the largest declines due to their initially high incidence, these regions in particular continue to exhibit a high prevalence of child marriage.
Research evidence shows that child marriage has multiple negative consequences for the young brides, their children and their communities, even after hosts of confounding factors are controlled for. Child brides often experience restricted economic and educational opportunities, thus limiting their options for escaping poverty (Nguyen & Wodon, Reference Nguyen and Wodonin press). They are more likely than adult brides to have poor access to health care and experience domestic violence (Raj et al., Reference Raj, Saggurti, Lawrence, Balaiah and Silverman2010). They also have minimal reproductive choices (UNICEF, 2005; Raj et al., Reference Raj, Saggurti, Balaiah and Silverman2009; Parsons et al., Reference Parsons, Edmeades, Kes, Petroni, Sexton and Wodon2015). Child marriage has been linked to higher fertility, especially in populations with low contraceptive use, which is not surprising given that fertility occurs largely within marriage (Jain & Kurz, Reference Jain and Kurz2007). Girls who marry early tend to have children earlier than girls who marry later (Wodon et al., Reference Wodon, Male and Onagoruwain press). They also tend to have more children over their lifetime. This could be due in part to the socioeconomic and cultural context in which girls who marry early tend to live, but it is also likely to be due in part to the fact that they marry early, controlling for socioeconomic and cultural context such as the fact that marrying early may be associated with a lack of decision-making and agency for girls, including in terms of access to family planning and contraception, which would help delay or reduce the number of births if women so desire. Again, this leads to earlier and more births.
Much of the research on the relationship between child marriage and fertility has focused on South Asia, even though there are studies for other regions as well (see the review of the evidence on the links between child marriage and health outcomes for women and children by Santhya (Reference Santhya2011)). In India, Raj et al. (Reference Raj, Saggurti, Balaiah and Silverman2009) assessed the impact of child marriage on fertility and fertility control behaviours in India using data from the 2005–2006 National Family Health Survey (NFHS-3). They focused on ever-married women aged 20–24 and found that early marriage increases fertility and reduces the ability to rely on fertility control mechanisms. Santhya et al. (Reference Santhya, Ram, Acharya, Jejeebhoy, Ram and Singh2010) also reported a relationship between child marriage and lack of fertility controls in five Indian states for women aged 20–24. They found that in comparison to women marrying early, women marrying after the age of 18 are more likely to have been involved in planning their marriage, to have used contraceptives to delay their first pregnancy and to have had their first birth in a health facility. They were also less likely to have experienced physical or sexual violence or a miscarriage or stillbirth. Kamal (Reference Kamal2012) considered the relationship between the decline in child marriage and its effect on reproductive outcomes using the 2007 DHS for Bangladesh. The study found that child marriage is associated, among other factors, with lower age at first birth, higher fertility, lower contraceptive use and higher risks of unplanned pregnancies and pregnancy termination. A similar analysis with the 2011 Bangladesh DHS (Kamal & Hassan, Reference Kamal and Hassan2015) confirmed the relationship between child marriage and adverse reproductive and health outcomes.
Another study used the 2006–07 Pakistan DHS to identify differences in poor fertility outcomes and child marriage (Nasrullah et al., Reference Nasrullah, Muazzam, Bhutta and Raj2014). As with other studies, this was done using logistic regression models and controlling for a range of factors, including demographics, education, wealth indices, location and contraception use, as well as the husband’s desire for more children and son preference. They confirmed that child marriage is associated with higher fertility, rapid repeated child births and unwanted pregnancy, as well as pregnancy termination. For South Asia more generally, Godha et al. (Reference Godha, Hotchkiss and Gage2013) relied on DHS data for Bangladesh, India, Nepal and Pakistan, focusing again on women aged 20–24 years. Among girls who married early, they distinguished those who did so at ages 15–17 versus those who married even earlier. Logistic regression models suggest that child marriage is associated with rapid repeated childbirths, lack of access to a fertility control mechanism and insufficient use of maternal health services, with more severe effects when marrying very early.
These findings for South Asia tend to also be observed in other regions as well. As noted in a review of the economic impacts of child marriage by Parsons et al. (Reference Parsons, Edmeades, Kes, Petroni, Sexton and Wodon2015), child brides in other regions are also often under pressure from husbands and in-laws to become pregnant soon after marriage and to not use any form of contraception. This leads to higher fertility as well as other health complications. This brief review of the literature suggests that child marriage is associated with higher fertility and other negative consequences. In turn, the number of children that a woman has over her lifetime affects a wide range of development outcomes for the woman herself, her household and her children. This includes a reduced ability of the household to avoid poverty due to a larger household size, a risk of reduced education opportunities for the children given limited resources available to the household, and additional risks for the health status of the children, especially when they are born of a very young mother. At the community and societal level, high total fertility rates lead to increased population growth and demographic pressure that also may have detrimental impacts on development.
Assessing, in a more detailed way than done so far, the magnitude of the relationship between child marriage and fertility is the purpose of this study. The study estimates the impact of child marriage on the number of children that women have over their lifetime and the reduction that would result from the elimination of child marriage. In comparison to other studies, this study has three main characteristics that differentiates it from previous work. First, it models the impact of each additional year of early marriage on the total number of births women have while previous studies typically looked only at the impact of marrying early or not (a dummy variable), or in some cases the impact of marrying early or very early with two age groups. Instead, this study looks at the impact of each single additional year of early marriage on the expected number of children that a woman will have. Second, the study estimates the impact of child marriage on a woman’s number of child births over her lifetime. Most previous studies focused on young women, typically those aged 18–24 years. Instead, this study considers the number of births over a woman’s lifetime. The reason for doing this is that substitution effects could be at work, whereby if a woman has a child earlier in life, she may be able to reduce the number of children that she has later on. In order to look at the impact of child marriage on the total number of children women are expected to have over their lifetime, there is a need to consider older women towards the end of their fertile age. Third, this study uses the estimations from the regression analysis to conduct counterfactual analyses, in order to estimate the magnitude of the reduction in the number of children that women will have over their lifetime in the absence of child marriage.
Methods
Data source
This study uses data from Demographic and Health Surveys (DHS) conducted in fifteen purposively selected countries. These include three South Asian countries (Bangladesh, Nepal and Pakistan), one country from the Middle East (Egypt), six countries from West and Central Africa (Burkina Faso, Democratic Republic of Congo, Mali, Niger, Nigeria, Republic of Congo) and five countries from East and Southern Africa (Ethiopia, Malawi, Mozambique, Uganda and Zambia). For all countries, the surveys were implemented in 2010 or later and the results are based on the latest DHS survey available at the time of the analysis. Priority was given to countries with a relatively high incidence of child marriage, but some of the countries, such as Egypt, have a much lower incidence. In addition, demand at the World Bank for the analysis to be conducted in particular countries as part of on-going policy dialogue was also taken into account in the choice of the countries. Overall, while the countries are not a representative sample of the world as a whole, they represent quite diverse settings, with a focus on regions of the world where the incidence of child marriage is especially high (sub-Saharan Africa and South Asia).
The DHS are nationally representative cross-sectional household surveys that provide data on health and population. They are an important source of data for studying population health in developing countries and allow for international and sub-national comparisons due to their use of uniform survey instruments, extensive coverage and data quality (Pullum, Reference Pullum2008). Advantages of the DHS include high-quality interviewer training, high response rates and standardized data collection procedures and variables across surveys (Corsi et al., Reference Corsi, Neuman, Finlay and Subramanian2012). The survey data are available publicly on the web and further information regarding the DHS surveys is available at dhsprogram.com. The DHS typically employ a multistage sampling methodology. The sampling frame is explicitly stratified by separating urban and rural residence within country-specific administrative or geographic regions. Localities are independently selected with probability proportional to size within the defined strata. Sampling units are then selected with equal probability selection, and in the final stage households are selected in every urban and rural cluster through equal probability systematic sampling. Sampling weights based on sampling probabilities are created to reflect the sampling design. These are inflation factors which extrapolate the sample to the national population.
Country-specific sampling plans are detailed in each country’s final DHS report. Survey data are collected within each selected household through three different questionnaires: a household questionnaire, a questionnaire for women aged 15–49 and a questionnaire for men aged 15–59. In some surveys female respondents are limited to ever-married women. The questionnaire for women is the most important one for the analysis conducted here. It includes sections on fertility, family planning, reproductive health, marriage and sexual activity, maternal and child health, mortality and nutrition. The response rate for female participants in this study’s countries ranged from 93% to 99%.
Study population
Analyses reported in this paper are restricted to ever-married women aged 35–49 years at the time of the survey (a reasonable proxy for completed fertility). That is, in order to look at the impact of child marriage on the total number of children women have over their lifetime, older women towards the end of their fertile age are considered. The lower bound of 35 years is applied in order to consider the number of births over the woman’s lifetime and to ensure large enough sample sizes. Previous studies have similarly used this lower bound to estimate completed fertility (Grindstaff et al., Reference Grindstaff, Balakrishnan and Dewit1991; Benefo & Schultz, Reference Benefo and Schultz1994; Bhat, Reference Bhat1998; Chaudhuri, Reference Chaudhuri2012; Juhn et al., Reference Juhn, Kalemli-Ozcan and Turan2013; Phan, Reference Phan2014). Many women continue to have children after age 35 (Eijkemans et al., Reference Eijkemans, Van Poppel, Habbema, Smith, Leridon and Te Velde2014), so that the total number of births considered in this study may be slightly underestimated. However, this is not expected to affect greatly the estimate of the difference in the total number of births between women married as children and those married as adults. Also, restricting from an older age may lead to an overestimation as misreporting of births by older cohorts, as well as female mortality at an older age, inflate fertility estimates (UNSD, 2004). In addition, in many countries, an older sample would restrict the analysis to women with mostly little schooling. The upper bound is established at 49 years as that is the DHS age threshold for eligibility for the women’s survey.
Measures and statistical analysis
This study explores the impact of child marriage on lifetime fertility, defined as the number of children ever born alive (CEB), which is a non-negative integer. This measure is used in demographic analyses as a proxy for fertility (Khan & Raeside, Reference Khan and Raeside1994; Bollen et al., Reference Bollen, Glanville and Stecklov2002; Juhn et al., Reference Juhn, Kalemli-Ozcan and Turan2013). Given that the number of children ever born is a count variable and is assumed to have a Poisson distribution (Poston, Reference Poston2002), Poisson regressions are carried out to estimate the impact of early marriage on the number of births. Child marriage is defined as a first marriage or union before age 18 and is captured in the analysis through dummy variables for marriage at ages ≤12, 13, 14, 15, 16 and 17 in order to capture the effect of marrying at various ages. The reference category is ‘marriage as an adult’ (at age 18+).
Five regression models are estimated and results are presented as Incident Rate Ratios (IRRs) with 95% confidence intervals (CIs). The first specification simply regresses the number of children ever born against the age at first marriage or union without controls. The second regression includes the following independent variables as controls apart from the age at first marriage or union: location (urban versus rural), education level of the respondent, household wealth quintiles, religion, region or province of residence and age group (35–39, 40–44 and 45–49). In the third model, ethnicity is added. The last two specifications include a number of additional variables that capture the agency of the respondent in the household. The use of alternative models allows, to some extent, the testing of the robustness to alternative specifications of the coefficient estimates for the impact of early marriage. It also helps in providing a richer discussion about some of the effects at work in terms of the correlates of the number of births. The additional variables in the last two models are the spousal age difference, the ability of the respondent to solely or jointly make decisions in various situations, the respondent’s tolerance of wife beating and whether the distance to the nearest health facility is a major problem for the household. Additional controls are the rate of modern contraceptive use in the area where the respondent lives (through ‘leave-out means’ for the primary sampling unit or PSU by age cohort) and under-five mortality experience, again within the area (PSU leave-out mean of women who have had at least one child die before the age of five). The use of leave-out means is to avoid endogeneity issues, and the last variable on under-five mortality at the PSU level is included to control for the potential tendency in high-mortality settings to have more children given the expectation that some children will not survive childhood (Canning et al., Reference Canning, Raja and Yazbeck2015). Leave-out means are average statistics over a sub-sample for a variable with the statistics estimated for the PSU in the survey where the individual lives, but not including that particular individual. These variables capture community-level effects.
Subsequent to the regression analysis, for each country the impact on the average fertility rate of ending child marriage is calculated. The results are obtained by predicting (simulating) the number of births with and without child marriage for the women who married early. All statistical analyses were conducted using STATA version 13.1 (StataCorp LP, College Station, TX).
Results
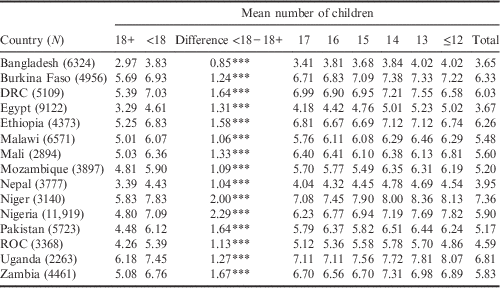
In this paper, the focus is on estimating the impact of child marriage on the number of births that women have over their lifetime. As mentioned in the Introduction, early marriage is often associated with early pregnancy, and ultimately, with a higher number of births over their lifetime for women. This can be seen in Table 1, which shows, for women aged 35–49, the number of births that women have over their lifetime by age of marriage. The average number of children ever born mostly increases when girls marry earlier, as expected. In all the countries, women who married before age 18 have more children than women who married after age 18. The difference between the two means is statistically significant (at the 1% level) in all countries. The mean CEB among women aged 35–49 years ranges from 3.67 children in Egypt to 7.36 in Niger.
Mean number of children ever born by age of marriage for women aged 35–49

DRC: Democratic Republic of Congo; ROC: Republic of Congo.
***p<0.01.
The mean CEB for women in the study sample by selected background characteristics is also computed, according to whether the woman was married as a child or not (full results for all countries are available from the authors). There are large differences in fertility according to most of the independent variables such as age, residence, education level, region, religion, ethnicity and wealth quintiles. In all countries, women living in rural areas have significantly more children, on average, than women living in urban areas. However, within both locations, women who married at below age 18 have more births than their counterparts who married at age 18 or older. Women with less education as well as women belonging to the bottom quintile of wealth have on average more children than women with secondary education or belonging to the top wealth quintile.
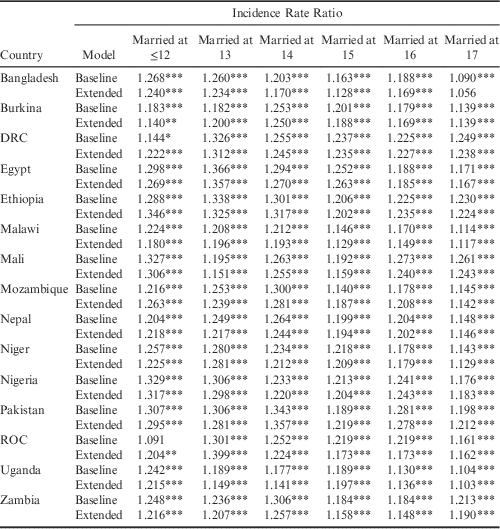
Table 2 provides Incident Rate Ratios of child marriage from the regression analysis (full results for all independent variables are available from the authors). Results from Specification 3 are provided, which shall be considered as the baseline model, as well as Specification 5, which is the most extended model. The coefficients of early marriage do not change very much when additional controls are added to the regressions when shifting from Model 3 to Model 5. Therefore, results of Model 5 are reported and simulations are also conducted with this model, which has the largest set of controls included. As expected, in most countries, the estimates indicate larger impacts for girls marrying earlier, although the coefficients do not always increase monotonically with the number of years of early marriage. Importantly, the coefficient estimates are statistically significant in all countries at the 1% level. The largest impact for marriage at age 12 or younger is seen in Ethiopia where a woman married at that age is likely to have 35% more live births than if she had married at 18 or later, all other things being equal. As another example of the results, in the Democratic Republic of Congo, a woman married at age 17 is likely to have 24% more births than if she had married at age 18 or later, again all other things being equal. Overall, while the magnitude of the impacts varies depending on the country and the age at first marriage, there is clearly a large impact across all countries.
Fertility regressions: Incidence Rate Ratios for women aged 35–49

DRC: Democratic Republic of Congo; ROC: Republic of Congo.
*p<0.10; **p<0.05; ***p<0.01.
The detailed regression results (available from the authors) show that a number of other effects appear to be at work in driving differences in fertility rates for women. The impact of education on the number of births that women have is strongly significant. Better-educated women – especially those with a higher (tertiary level) degree – tend to have fewer children. Compared with women with primary education or below, women with a higher degree have fewer births, with the effects ranging from 7% to 48% depending on the country. Note that the findings on the effect of education on fertility are consistent with findings from previous studies that higher educational attainment is associated with lower fertility, chiefly through an enhancement of the ability of women to make reproductive choices (Martin, Reference Martin1995; Diamond et al., Reference Diamond, Newby and Varle1999; Basu, Reference Basu2002). Another reason for the negative relationship between women’s education and fertility is a delay in marriage and childbearing by more educated women. The longer a girl remains in school, the less likely she is to have her first birth at an early age and give birth to many children. In addition, many studies have documented the influence of higher education on contraceptive behaviour (Vavrus & Larsen, Reference Vavrus and Larsen2003; Riyami et al., Reference Riyami, Afifi and Mabry2004; Bbaale & Mpuga, Reference Bbaale and Mpuga2011).
Wealth also has a statistically significant effect on fertility in most countries, with weaker effects in Ethiopia, Niger and the Democratic Republic of Congo. In some countries, the impact is only observed from the fourth to fifth quintiles. The impact of wealth on fertility tends to be smaller when compared with the impact of education attainment. In addition, younger women within the sample have fewer children, as expected, and may still have more children later on in their life. However, except for the case of Niger, fewer than 20% of women aged 35–39 in the various countries had a birth in the year preceding the survey. Differences according to religion, residence (urban/rural), geographic areas (regions) and ethnicity are statistically significant in some countries. Many of the additional controls are, however, not associated with statistically significant effects on fertility on a systematic basis.
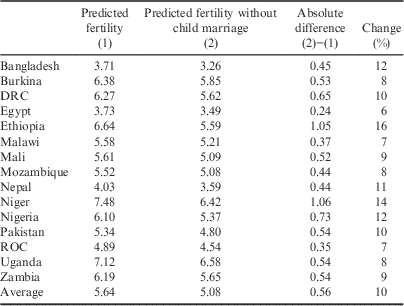
Table 3 presents the results of the assessment of the impact of eliminating child marriage on total fertility. For women who married as children, this is done by predicting a counterfactual number of live births if they had married later. For women who did not marry as children, there is no simulated change in their fertility. The statistics shown are total fertility estimates for countries as a whole including all women, whether they married as children or not. The first column provides the predicted number of live births or total fertility for women under Model 5. The second column provides the simulated number of live births for all women on average without child marriage for those women who married before the age of 18. The third column is the difference between the two estimates. It measures the impact of child marriage on the country’s total fertility. The last column expresses this impact in percentage terms versus the base fertility level with child marriage. The reduction in total fertility across the countries varies from 0.24 births in Egypt to 1.06 births in Niger, which is very large. In percentage terms, the reduction in total fertility ranges from 6% in Egypt to 16% in Ethiopia. Such reductions in fertility by ending child marriage would have substantial effects on demographic growth in the various countries. As expected, the simulated change in total fertility that would result from ending child marriage tends to be higher in countries that have a higher incidence of child marriage, such as Niger. The main reason for this is that when a higher share of women marry as children, the simulated impact of ending child marriage affects more women.
Total fertility with and without child marriage for women aged 35–49

DRC: Democratic Republic of Congo; ROC: Republic of Congo.
Discussion
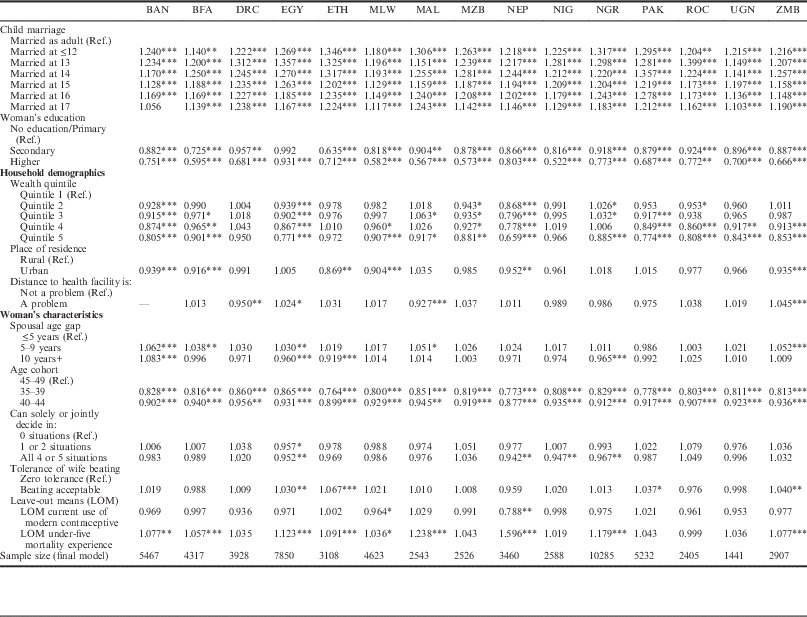
Because child marriage also has an impact on other variables used as controls in the regression analysis, the overall effect of child marriage on fertility, including indirect effects through education and wealth, could be larger than the direct estimates observed from the regression coefficients on early marriage. When girls marry early there is often a negative effect on education attainment, which may also contribute to lower household wealth in a number of ways (Nguyen & Wodon, Reference Nguyen and Wodon2016). Still, in terms of magnitude, the indirect effects of child marriage on fertility through education and wealth are likely to be much smaller in comparison to the direct effects observed in the coefficient estimates reported in Table 2. Econometric analysis suggests that in some countries, only a relatively small share of girls who marry early would have been able to complete their secondary education, even if they had married later (Wodon et al., Reference Wodon, Nguyen and Tsimpo2016). In addition, the coefficient of secondary education on fertility is close to one in many countries in the sample (Table 4), suggesting a limited impact of a secondary education on fertility in comparison to a lower level of education. As mentioned earlier, having a tertiary level of education does make a larger difference for fertility, but in most countries very few women marrying as children would complete that level of education if they had not married as children. The same holds for the potential effect of child marriage on fertility through household wealth. This implies that one can essentially rely on the estimated direct effects of child marriage on the number of lifetime births that women have for the simulation of the overall impact on total fertility that would result from the elimination of child marriage, without having to factor in indirect effects in the simulations because this does not entail large mismeasurement.
Correlates of fertility for women aged 35–49

Ethnicity, religion and region coefficients not shown.
Country Abbreviations: Bangladesh (BAN); Burkina Faso (BFA); Democratic Republic of Congo (DRC); Egypt (EGY); Ethiopia (ETH); Malawi (MLW); Mali (MAL); Mozambique (MZB); Nepal (NEP); Niger (NIG); Nigeria (NGR); Pakistan (PAK); Republic of Congo (ROC); Uganda (UGN); Zambia (ZMB).
LOM: leave-out mean. LOM current use of modern contraceptive: LOM of women in the PSU currently using modern contraceptive. LOM under-five mortality experience: LOM of women in PSU with at least one under-5 mortality experience.
*p<0.10; **p<0.05; ***p<0.01.
There are methodological limitations to be considered while interpreting the findings from this study. First, the study used cross-sectional data, which renders it subject to the general limitations associated with the use of such data. A disadvantage of cross-sectional data is that a causal temporal relationship between the outcome and the exposures cannot be established. For child marriage, however, a minimal temporality bias can be assumed due to the fact that childbirth mostly takes place within the confines of marriage in the countries of study. Still, it is impossible to absolutely determine the time sequence of key events of interest. In addition, decision-making ability as one of the controls in the regression is measured at the time of the survey, when women in the sample are older, and not when the decision to marry early was taken. Another limitation is that variables are self-reported and are liable to response and recall bias. Finally, the observed relationships may be due to unmeasured conditions that are associated with both fertility and child marriage. Other variables correlated with both child marriage and fertility that are not included in the analysis could be at the source of the observed relationship. Due the risk of omitted variable bias, the results can never be considered as fully conclusive, but there is clear suggestion of a (large) causal impact of child marriage on lifetime fertility.
In conclusion, the study suggests that child marriage is linked to substantially higher fertility. It provides estimates of the impact of each year of early marriage on the number of births for women over their lifetime in fifteen countries. These impacts implicitly assume no increase in out-of-wedlock adolescent childbearing when ending child marriage. Although a wide range of factors may explain the impact of child marriage on fertility, it is likely that the strong impacts suggested by the study relate at least in part to the lack of contraceptive practice and reproductive intentions. Delaying the initiation of marriage, and by extension the initiation of reproduction, could have a significant effect on national fertility rates and thereby on population growth.
Acknowledgments
This paper is part of a broader work programme on child marriage at the World Bank in collaboration with the International Center for Research on Women. The project is funded by the Bill and Melinda Gates Foundation and the Children Investment Fund Foundation, with additional funding from the Global Partnership for Education. The opinions expressed in the paper are, however, only those of the authors, and need not represent those of the World Bank, its Executive Directors or the countries they represent, nor those of the donors who funded this work. The authors are grateful to Jeffrey Edmeades for very useful comments.