INTRODUCTION
Drylands cover about 0·45 of the world's land surface (Schimel Reference Schimel2010) and account for 0·70 of China's total land area (Wu et al. Reference Wu, Yin, Zheng and Yang2005). Water-saving plastic-film mulching has been increasingly adopted for dryland agriculture (Unger et al. Reference Unger, Baumhardt, Arriga, Lal and Stewart2012), especially in Northwest China (Li et al. Reference Li, Guo and Wei1999; Zhou et al. Reference Zhou, Li, Jin and Song2009). Consistently positive results for crop (e.g. maize and potato) yield in film-mulched systems have been reported, in particular in areas with annual precipitation between 200 and 400 mm (Gan et al. Reference Gan, Siddique, Turner, Li, Niu, Yang, Liu and Chai2013). High productivity has been attained with this plastic-film-mulched system (Zhang et al. Reference Zhang, Li, Yang, Wang and Chen2011; Liu et al. Reference Liu, Zhan, Bu, Zhu, Luo, Chen, Cui, Li, Hill and Zhao2014), mainly due to reducing soil-water losses and increasing early season soil temperatures (Li et al. Reference Li, Hou, Jia, Han, Ren and Yang2013). To achieve these high yields, farmers repeatedly apply high rates of nitrogen (N) under the plastic-film mulch, which results in low N-use efficiencies and high labour costs (Richter & Roelcke Reference Richter and Roelcke2000; Bu et al. Reference Bu, Liu, Zhu, Luo, Chen, Li, Hill and Zhao2013). Therefore, research is needed on how to optimize nitrogen (N) management in dryland maize fields that use the plastic-film-mulched system.
Synchronizing N supply with crop N demand is crucial for improving crop yields and N-use efficiency (Cassman et al. Reference Cassman, Dobermann and Walters2002). Nitrogen recommendations for high-yield maize production have relied on a yield-based strategy in many regions. As determined in previous studies, the optimal, yield-based N treatment averaged 17·4 kg N/t for maize (based on an average yield of ~11 t/ha; with N input of about 190 kg/ha) (Hou et al. Reference Hou, Gao, Xie, Li, Meng, Kirkby, Romheld, Muller, Zhang, Cui and Chen2012). On the North China Plain, high maize yields were maintained at 12·6–13·5 t/ha with N fertilizer rates of 225–265 kg/ha (Meng et al. Reference Meng, Hou, Wu, Chen, Cui and Zhang2013). In the western USA Corn Belt, average yield ranged from 12·5 to 13·6 t/ha with an average N fertilizer rate of 183 kg N/ha (Grassini et al. Reference Grassini, Yang, Irmak, Thorburn, Burr and Cassman2011). In such high-yielding maize systems, greater above-ground dry matter and N accumulation have been reported after the silking stage (R1) (Ritchie et al. Reference Ritchie, Hanaway and Benson1989; Tollenaar et al. Reference Tollenaar, Ahmadzadeh and Lee2004; Wang et al. Reference Wang, Li, Tan, Tan, Zhang and Liu2011; Meng et al. Reference Meng, Yue, Hou, Cui and Chen2016), mainly because the delayed leaf senescence extends the period of photosynthesis (Rajcan & Tollenaar Reference Rajcan and Tollenaar1999; Borrell et al. Reference Borrell, Hammer and Van Oosterom2001). Film mulching has been reported to accelerate biomass accumulation during early growth and shorten the grain-filling period (Liu et al. Reference Liu, Yang, Li, Chen and Chen2010). Therefore, understanding N-uptake partitioning before and after R1 stage is essential for optimizing N management in a high-yield film-mulched maize system.
Controlled-release urea (CRU) may improve N-use efficiency and thus increase farmer profits while reducing potential negative effects to the environment (Fujinuma et al. Reference Fujinuma, Balster and Norman2009; Yang et al. Reference Yang, Zhang, Zheng, Cheng, Liu and Geng2011; Nash et al. Reference Nash, Nelson, Motavalli and Anderson2015). Additionally, CRU could save labour and time by enabling a one-time application of N in contrast to the split applications often required with conventional N fertilizer (Ye et al. Reference Ye, Liang, Chen, Liu, Gu, Guo and Li2013). However, the relatively higher cost compared with conventional N fertilizer (Noellsch et al. Reference Noellsch, Motavalli, Nelson and Kitchen2009; Watson Reference Watson2013), and a failure to synchronize the N demand of high-yielding systems by CRU application only, are limiting factors for using CRU in practice. Therefore, a mixture of CRU and urea was considered to meet N demands of the crop both during early and later growth stages, i.e. urea would support the early growth and CRU would support the later growth (Farmaha & Sims Reference Farmaha and Sims2013).
At the outset of the present study, which was conducted on China's Loess Plateau, it was hypothesized that a correct combination of CRU and urea could satisfy the N requirement for both before and after R1 stage in a high-yield film-mulched maize system. The first objective of the present study was to evaluate the effects of various ratios of CRU and urea in mixtures applied at various rates on grain yield, N-use efficiency, and N uptake before and after R1 stage. The second objective was to determine the economic benefits from using mixtures of CRU and urea.
MATERIALS AND METHODS
Site description
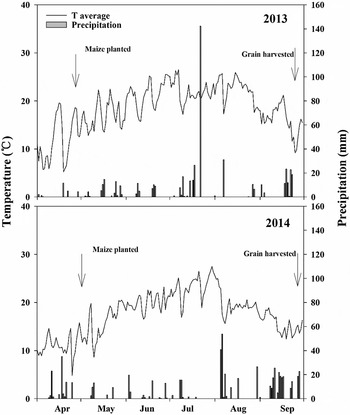
The experiment was conducted in 2013 and 2014 at Changwu (35·28°N, 107·88°E; 1200 m a.s.l.), which is a typical dryland environment on the Loess Plateau of China. The soils of the study area are classified as Cumuli-Ustic Isohumosols (Gong et al. Reference Gong, Zhang and Chen2007) and the soil properties in the top 0·3 m are as follows: pH 7·6, organic matter 11·6 g/kg, total N content 0·8 g/kg, Olsen-phosphorus (P) 15·8 mg/kg, and ammonium acetate (NH4OAc)-extracted potassium (K) 125 mg/kg, following the soil testing methods of Page et al. (Reference Page, Miller and Keeney1982). Precipitation between April and September in this area was 513 mm in 2013 and 618 mm in 2014. The average temperatures were 18·4 °C in 2013 and 17·5 °C in 2014 (Fig. 1).
Daily precipitation (bars) and average temperature (line) from the time of maize planting to grain harvest at Changwu in 2013 and 2014.

Experimental design and field management
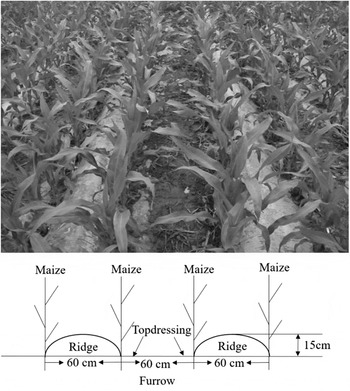
Experiments were conducted using a factorial arrangement of treatments in a randomized complete block design. Each of seven treatments (three fertilizer types × two application rates, plus a no N treatment as described below) were applied to 20 m2 (5 × 4 m2) plots with four replicate plots and a row spacing of 0·6 m. The three kinds of fertilizer treatments, hereafter referred to as ‘N sources’, included a urea-only treatment, which was applied as a split application, and two CRU–urea mixtures in 1 : 2 and 2 : 1 ratios (N from CRU:N from urea). Each of these three N sources was applied at two N rates (180 and 240 kg/ha) in 2013 and 2014, which corresponds with rates used in previous studies (Cui et al. Reference Cui, Yue, Wang, Meng, Wu, Yang, Zhang, Li, Zhang and Chen2013; Liu et al. Reference Liu, Zhan, Chen, Luo, Bu, Chen and Li2015). In the urea-only treatment, 0·40 of the total N was applied as a basal dressing before seeding (Fig. 2), and the remaining 0·60 was applied at the 6-leaf stage, which corresponds to growth stage V6 (Ritchie et al. Reference Ritchie, Hanaway and Benson1989); the high and low rates for this treatment were designated N180U and N240U. The CRU treatments were applied in one application before seeding and were designated N180C1, N240C1, N180C2 and N240C2, where C1 represents CRU-N: Urea-N at 1 : 2, and C2 represents CRU-N: Urea-N at 2 : 1. The CRU was manufactured by Agrium Inc., Calgary, AB, Canada (environmentally smart nitrogen (ESN)). The basal N fertilizer was applied together with 90 kg phosphorus pentoxide (P2O5)/ha in the form of calcium dihydrogen phosphate (Ca(H2PO4)2) and 90 kg potassium oxide (K2O)/ha in the form of potassium chloride (KCl).
Plastic-film-mulched maize field at Changwu.

The fields were mulched with transparent agricultural plastic film before seeding. The film was about 0·08 mm thick and 0·75 m wide (Fig. 2). A local maize variety (Shandan 609) was seeded at a depth of 30–50 mm and density of 75 000 plants/ha on 26 April 2013 and 1 May 2014. Maize was harvested on 25 September 2013 and 30 September 2014 (Fig. 1).
Plant sampling and analysis
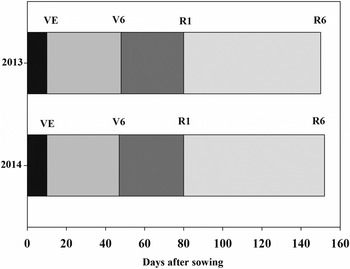
Plant samples, divided into grain and all other biomass, were collected at the silking stage, R1 (20 July 2013 and 25 July 2014), and at physiological maturity, R6 (Fig. 3). Three adjacent plants were randomly selected per plot and initially dried at 105 °C for 30 min and then at 80 °C to constant weight. All plant samples were analysed for N concentration using the Kjeldahl method (Horowitz Reference Horowitz1970). At harvest, a 10-m2 area in the middle of each plot was harvested manually to determine grain yield and yield components. The grain yield was expressed at 15·5% moisture content.
Durations of the spring maize crops (VE: emergence; V6: sixth leaf; R1: silking; R6: physiological stage) in the plastic-film-mulched (FM) treatments in 2013 and 2014.

The following equations were used to calculate partial factor productivity (PFPN), N recovery efficiency (REN), N agronomic efficiency (AEN) (Cassman et al. Reference Cassman, Dobermann and Walters2002; Dobermann Reference Dobermann2005):
 $${\rm PF}{\rm P}_{\rm N} = \displaystyle{{{\rm Y}_{\rm N}} \over {{\rm F}_{\rm N}}}$$
 $${\rm R}{\rm E}_{\rm N} = \displaystyle{{{\rm U}_{\rm N} - {\rm U}_{\rm 0}} \over {{\rm F}_{\rm N}}} \times 100$$
 $${\rm A}{\rm E}_{\rm N} = \displaystyle{{{\rm Y}_{\rm N} - {\rm Y}_0} \over {{\rm F}_{\rm N}}}$$
where FN is the amount of fertilizer N applied (kg/ha), YN is the crop yield with applied N (kg/ha), Y0 is the crop yield (kg/ha) in the control treatment with no N applied, UN is the total plant N uptake in above-ground biomass at maturity (kg/ha) in a plot that received N, and U0 is the total N uptake in above-ground biomass at maturity (kg/ha) in a plot that received no N.
Soil sampling and analysis
Before seeding and after harvest in 2013, five soil cores to 0·9-m depth (0–0·3, 0·3–0·6 and 0·6–0·9-m) were collected from each plot to determine soil mineral N (Nmin = NH4-N + NO3-N). All soil samples were passed through a 2·0-mm screen, mixed, and extracted with 0·01 M CaCl2 solution. Extracted samples were analysed for ammonium (NH4-N) and nitrate (NO3-N) using continuous flow analysis (TRAACS 2000 system, Bran & Luebbe, Norderstedt, Germany). Soil water content was also determined at the time of mineral N extraction.
Apparent N mineralization rate during the maize growing season was calculated as the difference between N output (plant N uptake plus residual soil Nmin) and N input (initial soil Nmin in 0–0·9 m soil layers) in a no-N treatment (Meisinger Reference Meisinger and Hauck1984).
Apparent N losses were calculated as the difference between N input (initial soil Nmin plus apparent N mineralization and N fertilizer) and N output (plant N uptake plus residual soil Nmin) in N-applied treatments (Ma et al. Reference Ma, Dwyer and Gregorich1999).
Controlled release urea release in the laboratory and field
The release of N from CRU was assessed in the laboratory and in a maize field. For the laboratory assay, three mesh bags (1-mm-mesh size), each containing 10-g of CRU, were immersed in 500 ml of water, and then incubated at 25 °C. The water containing released N was collected and replaced with fresh deionized water after 1, 3, 7, 14, 28, 42, 56 and 84 days. Nitrogen in the collected water was measured using ultraviolet spectrophotometry (Cawse Reference Cawse1967). For the field assay, 12 mesh bags containing CRU were prepared as for the laboratory assay (Yang et al. Reference Yang, Zhang, Zheng, Cheng, Liu and Geng2011). These were buried in a maize field adjacent to the experimental maize field at the time of seeding in 2013. At 10, 45, 101 and 123 days after burial, three bags were collected and washed with deionized water to remove the soil. After the bags were opened, CRU particles were removed and washed again with distilled water. The particles were placed in a vacuum oven at 60 °C for 48 h, and the particles were weighed to determine the N release rate (Kaneta et al. Reference Kaneta, Awasaki and Murai1994).
Economic analysis
A cost–benefit analysis was performed according to Thompson et al. (Reference Thompson, Doerge and Godin2000).
 $$\eqalign{{\rm Net}\;{\rm return} =\,& {\rm G}{\rm Y}_{\rm F}\,{\rm \times\, grain}\;{\rm price - costs(total)} \cr {\rm Costs(total)} =\, &{\rm Costs(N}\;{\rm fertilizer) + Costs} \cr& {(top - dressing) + Costs(others)} \cr {\rm Costs(others)} =\, &{\rm Costs\,of\,\{Ploughing + Harrow + Seed} \cr& {+ Seeding + Fertilizer(P}\;{\rm and}\;{\rm K fertilizer)} \cr& {+ Herbicide + Insecticide + Harvest\}}}$$
where GYF and GY0 are grain yields (GYs) with and without N fertilizer treatments. Grain price was set at 0·39 US$/kg (Wu et al. Reference Wu, Chen, Cui, Zhang and Zhang2014). The price of ESN was 0·57 US$/kg, and of urea was 0·30 US$/kg.
The costs of ploughing, harrowing, seed, seeding, fertilizer (P and K fertilizer), herbicide, insecticide and harvest were 110, 49, 37, 123, 128, 32, 37 and 123 US$/ha, respectively.
Data analysis
Analyses of variance (ANOVA) were performed using the SAS statistical analysis package (version 6.12, SAS Institute, Cary, NC, USA) to determine treatment effects. The effects of N rates and N source on grain yield, above-ground N uptake, PFPN, REN, AEN, PEN, gross and net returns were subjected to ANOVA using the PROC GLM procedure in SAS.
RESULTS
Grain yield and nitrogen efficiency as affected by nitrogen source and rate
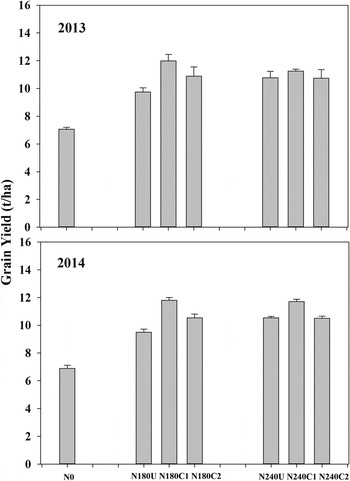
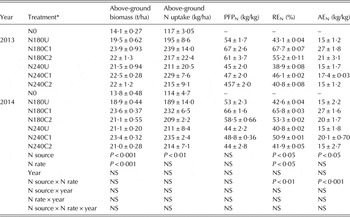
Grain yield was significantly (P < 0·01) increased by the application of N fertilizer in both years but did not significantly differ between the application rates of 180 and 240 kg N/ha (Fig. 4). In 2013 and 2014, grain yield was significantly (P < 0·01) higher at N180C1 than at N180U and N180C2 (Fig. 4). In 2014, grain yield at N240C1 was significantly (P < 0·01) higher than those at N240U and N240C2 (Fig. 4). Both N rate and N source significantly (P < 0·05) affected REN, but AEN was affected only by N source. Nitrogen recovery efficiency and AEN were significantly (P < 0·01 and P < 0·001) affected by the interaction between N source and N rate. The effects of year and the interactions of year × N rate, year × N source and year × N rate × N source were not significant (Table 1). Nitrogen recovery efficiency and AEN were the highest in the C1 treatment at 180 kg N/ha (Table 1).
Maize yields at Changwu in 2013 and 2014 as affected by N source and rate. U, Urea only, applied twice: before sowing and at the 6-leaf stage; C1, CRU-N: Urea-N = 1 : 2, applied as a single dressing before sowing; C2, CRU-N: Urea-N = 2 : 1, applied as a single dressing before sowing. Vertical bar indicates standard error of the mean (s.e.m).

Effects of nitrogen (N) source (type of fertilizer), rate and year on above-ground N uptake, N partial factor productivity (PFPN), N recovery efficiency (REN), N agronomic efficiency (AEN) and N physiological efficiency (PEN) at Changwu, China in 2013 and 2014. Values are means ± s.e.

* U, urea only, applied twice: before sowing and at the 6-leaf stage; C1, CRU-N: Urea-N = 1 : 2, applied as a single dressing before sowing; C2, CRU-N: Urea-N = 2 : 1, applied as a single dressing before sowing. NS, not significant.
Synchronized relationships between nitrogen release from controlled release urea and nitrogen demand
Controlled release urea in the laboratory and field
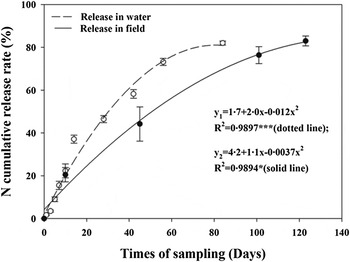
The cumulative release curve of CRU under laboratory condition (25 °C in water) revealed an initial fast release, slowing down thereafter (Fig. 5). After 80 days of incubation at 25 °C in the laboratory assay, about 0·80 of the N in CRU had been released (Fig. 5). The N release characteristic in the field was similar to that in water, although a similar level of release required 107 days in the field assay (Fig. 5), perhaps because the average soil temperature in the field was lower than the 25 °C used in the laboratory assay (Fig. 1).
Release of nitrogen from controlled-release urea (CRU) in water at 25 °C in the laboratory (dotted line) and in a maize field (solid line) at Changwu in 2013. Values are means ± s.e.

Above-ground biomass and nitrogen uptake (before and after R1 stage) as affected by nitrogen source and rate
Both above-ground biomass and N uptake were significantly (P < 0·001 and 0·01) affected by the two N sources (i.e. type of N fertilizer), and the amount of N also affected the biomass (Table 1). Both above-ground biomass and N uptake were the highest in the C1 treatment at 180 and 240 kg N/ha in both years (Table 1).
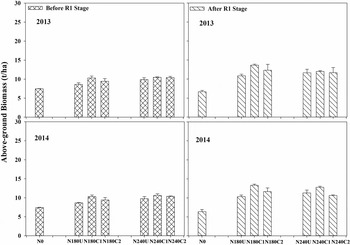
The above-ground biomass before and after R1 stage was significantly (P < 0·05) higher at 180 and 240 kg N/ha than with no N in both years (Fig. 6). The biomass before R1 stage was higher at N180C1 and N180C2 than N180U (P < 0·05), and did not differ among N240U, N240C1 and N240C2 treatments (Fig. 6). After R1 stage, the biomass was higher at N180C1 than at N180U and N180C2 in both years (P < 0·05) (Fig. 6), and the biomass was higher at N240C1 than at N240U and N240C2 in 2014 (P < 0·05) (Fig. 6).
Above-ground Biomass before and after R1 (silking) stage at Changwu in 2013 and 2014 as affected by N source and rate. U, Urea only, applied twice: before sowing and at the 6-leaf stage; C1, CRU-N: Urea-N = 1 : 2, applied as a single dressing before sowing; C2, CRU-N: Urea-N = 2 : 1, applied as a single dressing before sowing. Vertical bar indicates s.e.m.

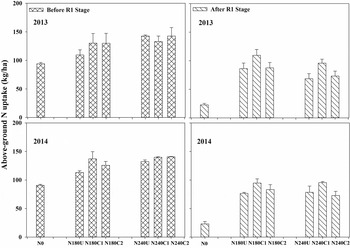
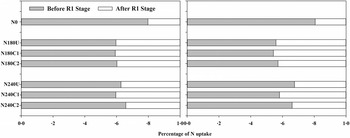
Like the above-ground biomass, the above-ground N uptake showed a similar tendency to biomass: the C1 treatments showed the highest N uptake for 180 and 240 kg N/ha applications at before and after R1 stage in both years (Fig. 7). More N accumulation after R1 stage was observed following yield improvement. With grain yields ranging from 11·8 to 12·0 t/ha, the proportion of above-ground N uptake after R1 stage was 0·34–0·46 (Fig. 8).
Above-ground N uptake before and after R1 (silking) stage at Changwu in 2013 and 2014 as affected by N source and rate. U, Urea only, applied twice: before sowing and at the 6-leaf stage; C1, CRU-N: Urea-N = 1 : 2, applied as a single dressing before sowing; C2, CRU-N: Urea-N = 2 : 1, applied as a single dressing before sowing. Vertical bar indicates s.e.m.

Nitrogen uptake before and after R1 (silking) stage for maize in 2013 and 2014. U, Urea only, applied twice: before sowing and at the 6-leaf stage; C1, CRU-N: Urea-N = 1 : 2, applied as a single dressing before sowing; C2, CRU-N: Urea-N = 2 : 1, applied as a single dressing before sowing.

Apparent nitrogen loss in 2013
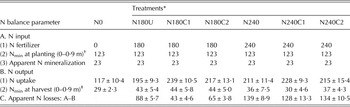
Based on the N0 treatment, apparent N mineralization was 23 kg N/ha (Table 2). Apparent N losses were significantly (P < 0·05) lower at applications of 180 kg N/ha than 240 kg N/ha. At the N180C1 treatment, apparent N loss was only 43 kg N/ha, which was significantly (P < 0·05) lower than the loss at the N180U and N180C2 treatment (Table 2).
Soil mineral N (Nmin) and calculated nitrogen (N) balances (kg N/ha) for the different N treatments in 2013. Values are means ± s.e

* U, urea only, applied twice: before sowing and at the 6-leaf stage; C1, CRU-N: Urea-N = 1 : 2, applied as a single dressing before sowing; C2, CRU-N: Urea-N = 2 : 1, applied as a single dressing before sowing.
† Mineral N (NH4-N + NO3-N) in soil at planting.
‡ Mineral N (NH4-N + NO3-N) in soil at harvest.
Economic evaluation of controlled release urea mixtures
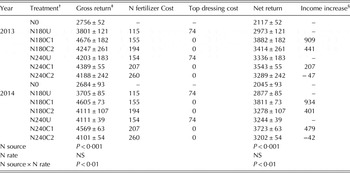
The cost of top-dressing was estimated to be about 74 US$/ha (Table 3). The costs for N fertilizer in the N180C1 and N180C2 treatments were 35 and 69% higher than for the N180U treatment, respectively, and the costs for N fertilizer in the N240C1 and N240C2 treatments were 34 and 69% higher than for the N240U treatment, respectively. In both years, the greatest economic benefit was obtained at N180C1. Compared with N180U, N180C1 increased total income by >900 US$/ha. Gross return and net return were significantly affected by N source (P < 0·001) and by the interaction between N source and N rate (P < 0·01) (Table 3).
Economic analysis (in US$/ha)* as affected by nitrogen (N) fertilizer rate and source at Changwu, China in 2013 and 2014. Values are means ± s.e

* US$1 = 6·1 Chinese Yuan (2014).
† U, urea only, applied twice: before sowing and at the 6-leaf stage; C1, CRU-N: Urea-N = 1 : 2, applied as a single dressing before sowing; C2, CRU-N: Urea-N = 2 : 1, applied as a single dressing before sowing.
‡ Gross return = GYF × grain price, Net return = GYF × grain price − Cost (Others) − Cost (Top dressing) − Cost (N fertilizer).
§ Income increase = Net return (NC1 or NC2)-Net return (NU).
DISCUSSION
The present study indicates that a single application of 1 : 2 CRU-N: Urea-N at 180 kg N/ha can generate a grain yield of 11·8–12·0 t/ha in a film-mulched maize system. This yield is comparable with the yield of film-mulched maize in Li et al. (Reference Li, Hou, Jia, Han, Ren and Yang2013) (10·7–11·8 t/ha) and higher than the yield of maize without mulch (7·0–10·6 t/ha) (Bu et al. Reference Bu, Liu, Zhu, Luo, Chen, Li, Hill and Zhao2013) in China's Loess Plateau. A single application of 1 : 2 CRU-N: Urea-N at 180 kg N/ha (treatment N180C1) also had the highest N-use efficiency in both years. The PFPN and REN at N180C1 averaged 66 kg/kg and 67%, respectively. These values compare favourably with N-15 isotope work in the same system (Wang et al. Reference Wang, Luo, Yue, Shen and Li2016), even higher than that in other studies, which normally have better growing conditions. For example, the PFPN of an integrated soil–crop management system in China was 56 kg/kg for maize (Chen et al. Reference Chen, Cui, Fan, Vitousek, Zhao, Ma, Wang, Zhang, Yan, Yang, Deng, Gao, Zhang, Guo, Ren, Li, Ye, Wang, Huang, Tang, Sun, Peng, Zhang, He, Zhu, Xue, Wang, Wu, An, Wu, Ma, Zhang and Zhang2014), and PFPN and REN were 60 kg/kg and 40%, respectively, in the North-central USA (Cassman et al. Reference Cassman, Dobermann and Walters2002).
Achieving synchrony between N supply and crop demand is the key to optimizing N management for high-yielding systems. Studies have indicated that as yield increased from 7·0 to 13·0 t/ha, above-ground N uptake increased from 0·12 to 0·32 (Meng et al. Reference Meng, Yue, Hou, Cui and Chen2016). Liu et al. (Reference Liu, Zhan, Bu, Zhu, Luo, Chen, Cui, Li, Hill and Zhao2014) indicated that most plant N was accumulated before R1 stage (0·50–0·72 of total accumulation) with yields of 9·9–15·1 t/ha for film-mulched maize. In the present study, about 0·54–0·68 of total N was accumulated before R1 stage with yields of 9·5–12·0 t/ha. Film-mulching increased soil temperature and soil water content, therefore more N fertilizer was needed in the early growth period compared to maize with no mulch (Liu et al. Reference Liu, Yang, Li, Chen and Chen2010). So in the present study, N uptake before R1 stage was significantly higher with N180C1 than with N180U, but did not differ significantly between N240C1 and N240U. This was mainly because the N supplied at seeding by application of 0·40 of the urea-only fertilizer at 180 kg N/ha was insufficient for early maize growth in the film-mulched system. Meanwhile, for treatment N180C1, the proportion of release was about 0·48 and 0·69 of CRU-N at V6 and R1 stage (47 and 80 days after sowing), respectively. The total amount of N was 148·6 and 161·1 kg N/ha at V6 and R1 stage, respectively. On the other hand, while the time taken to release 0·80 of N from CRU in the field was 107 days at Changwu, which was about 12 days after R1 stage in both years, the current results showed that the N of C1 (CRU-N: Urea-N = 1 : 2) satisfied the crop N demand after R1 stage. Therefore, it is suggested that 1 : 2 CRU-N: Urea-N at 180 kg N/ha could be the best combination to satisfy maize N requirement over the entire growing season.
Under plastic film, with higher soil temperature and favourable moisture, N leaching into the deeper soil layers may increase (Gan et al. Reference Gan, Siddique, Turner, Li, Niu, Yang, Liu and Chai2013). A recent study showed that about 30 kg/ha soil NO3 −-N moved into the 1–2 m layer during the whole maize growth stage in film-mulched systems (Liu et al. Reference Liu, Zhan, Chen, Luo, Bu, Chen and Li2015). The present study showed that for the same rate of N fertilizer, above-ground uptake of N by maize was higher with CRU than with a conventional urea treatment, and that apparent N losses were lower with a mixture of CRU-N and urea-N at a ratio of 1 : 2 and at a rate of 180 kg N/ha than with other treatments in 2013. This indicates that CRU can improve N uptake by maize, and decrease N losses.
In deciding whether and how to use CRU, producers should assess the economic risks and benefits based on fertilizer and grain prices (Farmaha & Sims Reference Farmaha and Sims2013). Most previous studies have indicated that maize yields were higher with a single application of a polymer-coated fertilizer than with a conventional fertilizer system, but the high cost of CRU still would be a limiting factor in production (Noellsch et al. Reference Noellsch, Motavalli, Nelson and Kitchen2009; Hatfield & Venterea Reference Hatfield and Venterea2014; Nash et al. Reference Nash, Nelson, Motavalli and Anderson2015), and such studies did not consider using a combination of CRU and urea to reduce the fertilizer costs. The current data showed that the increased grain yield and decrease in labour costs with one-time application by a mixture of CRU and urea would more than compensate for the cost of using part of the N as CRU. The technological development of lower-cost polymer-coated urea has led to an increased consideration of CRU in a wide range of grain production systems (Chen et al. Reference Chen, Suter, Islam, Edis, Freney and Walker2008). In the future, the mixture of CRU and urea application would be a better choice for economic considerations.
CONCLUSIONS
Application of CRU with urea at planting can match N demand for the film-mulched maize system in China's Loess Plateau. A single application at planting of a CRU-N: Urea-N mixture at a ratio of 1 : 2 and a rate of 180 kg N/ha could satisfy N demand at both before and after R1 stages for the film-mulched maize system, and result in high-grain yield, high N uptake and N-use efficiency. Thus, a mixture of CRU and conventional urea should be encouraged as a technology that can be adopted on large scale in maize production with better environmental and economic benefits.
This work was financially supported by the Chinese National Basic Research Program (2015CB150402), the National Maize Production System in China (CARS-02-24), and the Innovative Group Grant of the Natural Science Foundation of China (Grant 31421092).