

Introduction
Several European population-based studies indicate that immigrants with psychotic disorders tend to have less education, lower income and more often have unskilled jobs compared to non-immigrant populations with similar disorders (Fossion et al. Reference Fossion, Servais, Rejas, Ledoux, Pelc and Minner2004; Bhugra & Becker, Reference Bhugra and Becker2005; Kirkbride et al. Reference Kirkbride, Jones, Ullrich and Coid2012). These disparities in education and employment are also consistent with statistics for the UK immigrant population as a whole (Becares & Nazroo, Reference Becares and Nazroo2013).
The mental health of migrants is a topic of particular interest to Australia, where a recent census has identified that over a quarter (26%) of the population aged 18–64 years are born overseas (Australian Bureau of Statistics, 2008). With respect to psychotic disorders, the first national survey of psychosis in Australia (conducted in 1997), reported that 24.1% of participants were born outside of Australia (Jablensky et al. Reference Jablensky, McGrath, Herrman, Castle, Gureje, Castle and Gureje1999, Reference Jablensky, McGrath, Herrman, Castle, Gureje, Evans, Carr, Castle, Gureje and Harvey2000).
Although previous Australian population-based prevalence surveys of mental health have generally concluded that migrants tend to have better general mental health compared to Australian-born individuals (McGrath et al. Reference McGrath, El-Saadi, Cardy, Chapple, Chant and Mowry2001; Slade et al. Reference Slade, Johnston, Teesson, Whiteford, Burgess, Pirkis and Saw2009; Nielssen et al. Reference Nielssen, Sara, Lim and Large2013), there is little information about the sociodemographic and clinical outcomes among immigrant population with psychotic disorders compared to their native-born counterparts in Australia. The most recent study of psychosis in Australia reported that the proportion of migrants with psychosis was numerically lower than the previous study (17.8 v. 24,1%, respectively) (Morgan et al. Reference Morgan, Waterreus, Jablensky, Mackinnon, McGrath, Carr, Bush, Castle, Cohen, Harvey, Galletly, Stain, Neil, McGorry, Hocking, Shah and Saw2011, Reference Morgan, Waterreus, Jablensky, Mackinnon, McGrath, Carr, Bush, Castle, Cohen, Harvey, Galletly, Stain, Neil, McGorry, Hocking, Shah and Saw2012). There is a lack of data on the demographic and clinical correlates of psychosis in migrants v. Australian-born individuals with psychosis, thus it remains unclear if migrants with psychosis in Australia differ in clinical profile including diagnostic subtype, course of illness and level of functioning. We had the opportunity to explore these issues based on the most recent survey of psychosis.
Methods
Participants
Participants were drawn from the second national survey of psychosis, the Survey of High Impact Psychosis (SHIP). The full details of the methods are provided elsewhere (Morgan et al. Reference Morgan, Waterreus, Jablensky, Mackinnon, McGrath, Carr, Bush, Castle, Cohen, Harvey, Galletly, Stain, Neil, McGorry, Hocking, Shah and Saw2011). In summary, the SHIP generated a national probability sample from seven catchment areas, including inner city, urban and rural settings, representing 1.5 million people aged 18–64 years. The sample frame of 1.5 million people represents approximately 10% of the Australian population in the specified age range. The data provide a snapshot of multiple facets of the lives of people living with psychosis (hence ‘treated’ sample), extending and deepening our understanding of living circumstances, social participation and clinical presentation of the population.
A two-phase design was followed for the survey beginning with screening for psychosis. Screening occurred during the census month of March 2010 in public mental health services and in non-government organisations supporting people with severe mental illness. From among those screening positive for psychosis, a random sample (n = 7955) stratified by age group (18–34 and 35–64 years) and site was selected for further in-depth interviews. Of the 7955 people who screened positive for psychosis and met eligibility criteria, 2107 people were untraceable or too ill, 501 people had language/cognitive deficits, or were dead or in prison, 2364 people declined the interview, and 1158 people were not sampled because the target population had been achieved. Finally, 1825 people completed face-to-face interviews. Equal numbers were targeted in two age groups (18–34 and 35–64 years) to ensure adequate coverage of younger as well as older age participants in each catchment site.
The study was approved by institutional human research ethics committees at each of the seven study sites and all participants provided written, informed consent.
Measures
The face-to-face interview module consists of 32 modules covered psychiatric symptoms, age of onset, functioning, course of illness and demographic characteristics (e.g., age, sex, marital status, education/training, employment, migrant status and self-reported financial difficulties). Diagnostic assessment was based on a semi-structured clinical research interview, the Diagnostic Interview for Psychosis (DIP) (Castle et al. Reference Castle, Jablensky, McGrath, Carr, Morgan, Waterreus, Valuri, Stain, McGuffin and Farmer2006) which was first developed in the 1997–98 Australian Survey of Psychosis (Jablensky et al. Reference Jablensky, McGrath, Herrman, Castle, Gureje, Evans, Carr, Castle, Gureje and Harvey2000). The instrument is based on the 90 item OPCRIT (version 4.0) algorithm embedded into a software package designed around a semi-structured interview schedule developed to incorporate the OPCRIT items. The details of the other instruments that were used in the survey are available from Morgan et al. (Reference Morgan, Waterreus, Jablensky, Mackinnon, McGrath, Carr, Bush, Castle, Cohen, Harvey, Galletly, Stain, Neil, McGorry, Hocking, Shah and Saw2011).
Trained interviewers, who were predominantly allied health professionals, administered the survey. Detailed assessments of sociodemographic and clinical factors have been published previously (Morgan et al. Reference Morgan, Waterreus, Jablensky, Mackinnon, McGrath, Carr, Bush, Castle, Cohen, Harvey, Galletly, Stain, Neil, McGorry, Hocking, Shah and Saw2012; Waghorn et al. Reference Waghorn, Saha, Harvey, Morgan, Waterreus, Bush, Castle, Galletly, Stain, Neil, McGorry and McGrath2012). However, brief descriptions of some of the main variables are given here. Migrant status was based on the question ‘What country were you born in?’ Information on the place of birth of respondents' parents was not available, thus this study is restricted to first generation migrants (henceforth ‘migrants’). Although there is a lack of consensus on how best to define the multidimensional concept of economic development, we stratified country of origin based on the most recent per capita gross national income (GNI) according to World Bank classifications (World Bank, 2013a , b ): (a) low-income countries = mean GNI of less than US$1 035; (b) low middle-income countries = mean GNI between US$1 036 and 4 085; (c) upper middle-income countries = mean GNI between US$4 086 and 12 615; and (d) high-income countries = mean GNI of greater than US$12 616.
For employment status, international definitions of labour force activity were applied to determine two mutually exclusive categories of labour force activity: employed v. not employed in the previous 12 months (Waghorn et al. Reference Waghorn, Saha, Harvey, Morgan, Waterreus, Bush, Castle, Galletly, Stain, Neil, McGorry and McGrath2012). We classified the postcode of respondents' place of residence according to the Australian Bureau of Statistics ‘Index of Relative Socio-Economic Disadvantage’. This variable is derived from a range of potential indicators of socio-economic disadvantage including variables related to income, education, employment status and accommodation status (Australian Bureau of Statistics, 2006). The higher the index score, the less socio-economically disadvantaged the area.
Assessments: diagnosing psychosis
Diagnosis of psychiatric disorders was made using the Diagnostic Interview for Psychosis-Diagnostic Module (DIP-DM) (Castle et al. Reference Castle, Jablensky, McGrath, Carr, Morgan, Waterreus, Valuri, Stain, McGuffin and Farmer2006) which was developed for use by trained mental health professionals in the first Australian survey of psychosis in 1997–98 (Jablensky et al. Reference Jablensky, McGrath, Herrman, Castle, Gureje, Castle and Gureje1999, Reference Jablensky, McGrath, Herrman, Castle, Gureje, Evans, Carr, Castle, Gureje and Harvey2000). It uses SCAN prompts (World Health Organization, 1999) to elicit signs and symptoms, then applies the OPCRIT criteria developed by McGuffin et al. (Reference McGuffin, Farmer and Harvey1991), using a computer algorithm to generate diagnoses according to several classification systems. The DIP-DM has well-established psychometric properties (Castle et al. Reference Castle, Jablensky, McGrath, Carr, Morgan, Waterreus, Valuri, Stain, McGuffin and Farmer2006). Diagnoses were derived using the ICD-10 (World Health Organization, 1992).
Assessments: illness-related measures
We used the Personal and Social Performance Scale (PSP) as a clinician-rated global measure of personal and social functioning (Morosini et al. Reference Morosini, Magliano, Brambilla, Ugolini and Pioli2000). The impact of illness is assessed from a structured clinical interview covering four main areas: socially useful activities; personal and social relationships; self-care; and disturbing and aggressive behaviours. Difficulty in each area was rated on a single item using a six-point scale: Absent; Mild; Manifest but not marked; Marked; Severe; or Very severe. Total scores range from 1 to 100 where lower scores indicate poorer functioning. We dichotomised the variable into ‘good’ and ‘severe’ using median split. The PSP has good inter-rater reliability (intra-class correlation coefficient ICC = 0.87) and moderate to good test–retest reliability (ICC > 0.90) (Patrick et al. Reference Patrick, Burns, Morosini, Rothman, Gagnon, Wild and Adriaenssen2009) in this population.
Course of illness was assessed and rated by the interviewers capturing the number of episodes of mental illness that a person experiences and the degree of recovery after each episode (Castle et al. Reference Castle, Jablensky, McGrath, Carr, Morgan, Waterreus, Valuri, Stain, McGuffin and Farmer2006). The variable was collapsed into three hierarchical levels: good recovery (one or multiple episodes with good recovery between episodes), partial recovery (multiple episodes with partial recovery in between), and chronic illness (continuous chronic illness both with and without deterioration). Course of illness has demonstrated good concurrent validity with respect to other clinical dimensions and with social functioning (including employment) in the previous Australian national survey (Waghorn et al. Reference Waghorn, Chant and Whiteford2003).
Statistical analyses
We used univariate statistics (t-tests and χ 2) to examine group differences. For the main analyses, we examined demographic and clinical differences between migrants and Australian-born using logistic regression. Several variables were either dichotomised using median split (e.g., PSP scale), or quartile split (e.g., Index of Relative Socio-Economic Disadvantage, duration of post-migration period (age minus age at immigration) for the analyses. Other variables including marital status, socio-economic index, highest qualifications obtained, functional severity and course of illness were re-classified for the ease of presentation using standard definitions according to earlier publications from our group (Morgan et al. Reference Morgan, Waterreus, Jablensky, Mackinnon, McGrath, Carr, Bush, Castle, Cohen, Harvey, Galletly, Stain, Neil, McGorry, Hocking, Shah and Saw2012; Waghorn et al. Reference Waghorn, Saha, Harvey, Morgan, Waterreus, Bush, Castle, Galletly, Stain, Neil, McGorry and McGrath2012). Odds ratios were estimated using logistic regression (Model 1). We adjusted for age and sex (Model 2) because these two variables had interacted with sociodemographic and clinical outcomes in our earlier analyses (Waghorn et al. Reference Waghorn, Saha, Harvey, Morgan, Waterreus, Bush, Castle, Galletly, Stain, Neil, McGorry and McGrath2012). Analyses were performed using SAS version 9.3 and Procedures Surveylogistic and Surveyfreq (An, Reference An2004), using weightings in order to adjust for age and site-related oversampling.
Results
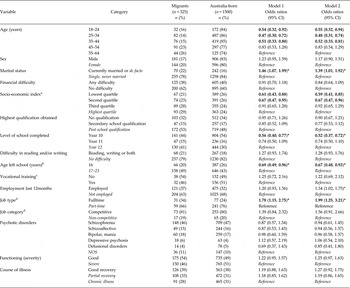
Of the 1825 participants with psychotic disorders who were included in the survey, 17.8% (n = 325) were migrants, of whom 55.7% (n = 181) were male. There were no significant differences in sex distribution between the migrant and Australian-born (χ 2 = 2.46, p = 0.12). Migrants were about three years older (mean 40.62, standard deviation (s.d.) 11.82) than the Australia-born (mean 37.8, s.d. 10.95) (t = 61.95, p < 0.001) (Table 1). The mean (s.d.) age at immigration for migrants was 12.69 (9.49) years. Two-thirds of the migrants (65.4%, n = 212) arrived to Australia before 16 years of age. The mean (s.d.) duration of post-migration period was 28 (13.8) years. About half of the migrants (n = 164) had been living in Australia <27 years after their immigration (1st quartile= 1–17 years; 2nd quartile = 18–27 years; 3rd quartile = 28–39 years and 4th quartile = 40–60 years).
Sociodemographic and clinical correlates of migrant status among adults with psychotic disorders (n = 1825)

Model 1, unadjusted; Model 2, adjusted for age & sex; CI, 95% confidence interval; NOS, not otherwise specified.
aQuartile distribution of socio-economic index: the data were extracted from the Australian Bureau of Statistics SEIFA96 using catchment area postcode to obtain postal area level indexes based on ‘Index of Relative Socio-Economic Disadvantage’; the higher the score, the less disadvantaged the catchment area (indicating fewer families of low income, little training and unskilled occupations).
bSample below 16 years not considered.
cOnly those using the service.
dSample size restricted to 596 only (sample size for Job type and Job category was 408).
*Significant results shown in bold (p < 0.05).
Migrants arrived in Australia from 71 different countries; 75% (n = 244) from European nations, 17% (n = 56) from Asia-Oceania, 4% (n = 14) from the Americas and 3% (n = 10) from African nations. Most were either Australian citizens (70.2%, n = 228) or permanent residents (27.7%, n = 90).
Based on the four economic categories, 64.9% of the migrants (n = 211) originated from 31 ‘high-income countries’, 14.8% (n = 48) from 16 ‘upper middle-income countries’, 13.2% (n = 43) from 14 ‘lower middle-income countries’, whereas only 7.1% (n = 23) were from 10 ‘low-income countries’. About 31% (n = 100) of the migrants spoke a language other than English at home compared with only 4.5% (n = 68) of Australia-born individuals.
Table 1 shows the sociodemographic characteristics of migrants and Australia-born individuals. Compared to Australia-born individuals, significantly more migrants were currently married or in de facto relationships. Compared to Australia-born individuals with psychosis, the migrant group were more likely to (a) live in areas with higher scores on Index of Relative Socio-Economic Disadvantage (higher scores indicative of less socio-economic disadvantage); (b) have completed higher level of schooling; (c) have left school at an older age; (d) be employed in the previous 12 months; and (e) have full-time employment. There were no significant differences between these two groups in terms of self-reported financial difficulties or qualifications obtained.
There was no significant difference in distribution of types of psychotic disorders between migrants and non-migrants (Table 1), nor in the level of functioning. Concerning age of onset, only 11% of the 325 migrants (n = 36) had an onset prior to or during the year of immigration to Australia. Migrants were more likely to a have later onset of illness compared to Australia-born individuals by an average of 3 years (mean 26.1, s.d. 9.8 v. mean 23.2, s.d. 8.3) (t = 47.9, p < 0.001).
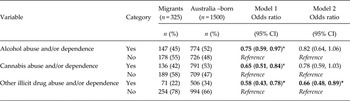
Although migrants were numerically less likely to have lifetime alcohol or drug abuse and/or dependence disorders, this was not statistically significant. However, ‘other drug’ abuse/dependence disorders (other than cannabis) were significantly lower among migrants (Table 2).
Drug and alcohol use or dependence disorders among migrants compared to Australia-born adults with psychotic disorders (n = 1825)

Model 1, unadjusted; Model 2, adjusted for age and sex; CI, 95% confidence interval.
*Significant results shown in bold (p < 0.05).
Discussion
Migrants account for 17.8% of the treated prevalent cases of psychotic disorder, a proportion numerically lower than the overall proportion of the Australian population aged 18–64 years born overseas (26%). In contrast to the generally disadvantaged status of migrants with psychosis reported in many countries (Morgan et al. Reference Morgan, Charalambides, Hutchinson and Murray2010), migrants in Australia overall had superior outcomes on a range of measures. Compared to Australia-born individuals with psychosis, migrants were more likely to be currently married. Educationally, they were more likely to have completed higher levels at school, and to have left school at later age. They were more likely to live in socio-economically advantaged suburbs and to be employed. In spite of these differences, our study did not detect significant differences in subtype of psychotic disorder, nor course of illness. One might predict that being in a relationship, and having superior educational and employment outcomes might be associated with more favourable clinical outcomes. It would be of interest to explore this issue in prospective studies, based on a representative sample of migrant and Australia-born individuals with psychosis.
Our finding with respect to substance abuse is generally consistent with that found in Australian general population mental health surveys. The Australian Survey of Mental Health and Wellbeing, 2007 shows that in the general population, 4.4% of migrants had ‘any drug’ abuse disorders compared with 7.7% of Australia-born individuals (Australian Bureau of Statistics, 2008). Migrants were presumably less likely to use drug or alcohol because of their cultural heritage and possibly family constraints.
The migrants in the cohort had a later age of onset of psychosis. This may be partially attributable to the screening for mental and physical disorders applied to prospective migrants to Australia, thus biasing the age of onset distribution for this group. Of interest, two-thirds of the migrants arrived before the age of 16 years of age, which suggests they arrived as part of a family unit. Pre-migration health screening (of the parents and the participants in this study) may have influenced the likelihood of post-migration mental illness. It is also possible that some of the migrants identified in the study arrived as refugees; however we were not able to identify these individuals. It would be interesting to explore the impact of the refugee experience (prior to and after immigration to Australia) on the emergence or subsequent expression of psychotic disorders, as well as the service utilisation of these individuals.
Our study highlights the differences in sociodemographic and clinical outcomes between migrant population and their native-born counterparts with psychosis, indicating superior outcomes on a range of variables. This contrasts with data from the UK, and other European countries where immigrants with psychotic disorders tend to have less education and inferior employment status compared to non-immigrant populations with similar disorders (Fossion et al. Reference Fossion, Servais, Rejas, Ledoux, Pelc and Minner2004; Bhugra & Becker, Reference Bhugra and Becker2005; Kirkbride et al. Reference Kirkbride, Jones, Ullrich and Coid2012; Becares & Nazroo, Reference Becares and Nazroo2013).
However, interpretation of our findings requires some caution. Although the SHIP is the largest prevalence study of psychosis conducted in Australia, there are several important limitations. The survey design did not include a control population thus we cannot make inferences about how migrants with psychosis differ from otherwise well migrants living in Australia. Although we have some data on duration of post-migration period, the cross-sectional nature of the data, as well as the lack of a control group, prevented us from making any inferences about the association between migrant status and subsequent risk of psychosis. The survey excluded individuals who were not proficient in English, which may have biased our sample towards higher achieving migrants. Unfortunately, we do not have information on the count of psychotic individuals excluded because of this criterion. The survey did not include individuals entirely in the care of private mental health providers (e.g., general medical practitioners or psychiatrists), nor those who had dropped out of all contact with mental health and non-government agencies.
In conclusion, within a population-based sample of individuals with psychosis, migrants represent a smaller than expected proportion, and tend to have equivalent or superior outcomes on a range of clinical, economic, employment and educational outcomes. We hope that our study has provided a foundation upon which to explore the complex matrix of factors that underpin migrant status and risk of psychotic disorders.
Acknowledgements
This report was funded in full by QCMHR and is a secondary analysis of data collected in the framework of the 2010 Australian National Survey of High Impact Psychosis (SHIP). The members of the SHIP Study Group are: V. Morgan (Project Director); A. Jablensky (Chief Scientific Advisor); A. Waterreus (Project Coordinator); A. Mackinnon (Statistician); R. Bush, D. Castle, M. Cohen, C. Galletly, C. Harvey, P. McGorry, J. McGrath, H. Stain (Site Directors); V. Carr (Australian Schizophrenia Research Bank); A. Neil (Health Economics); B. Hocking (SANE Australia); S. Saw (Australian Government Department of Health and Ageing). The study was funded by the Australian Government Department of Health and Ageing. This report acknowledges, with thanks, the hundreds of mental health professionals who participated in the preparation and conduct of the survey and the many Australians with psychotic disorders who gave their time and whose responses form the basis of this publication.
Financial Support
This research received no specific grant from any funding agency, commercial or not-for-profit sectors.
Statement of Interest
None.
Ethical Standard
The authors assert that all procedures contributing to this work comply with the ethical standards of the relevant national and institutional committees guides on the care and use of human subjects.