I. INTRODUCTION
Brittle failure is one of the most catastrophic failure mechanisms operating in crystalline materials because it occurs very rapidly. Materials with a body-centered cubic structure or covalent bonding are especially susceptible; but they typically fail in a brittle fashion only at low temperatures, tending toward plastic deformation at higher temperatures. Early investigations that sought to elucidate the mechanism behind this brittle-to-ductile transition were performed using silicon single crystals because these can be grown free of dislocations, the properties of dislocations in Si are well characterized, and the transition occurs over a narrow temperature window.Reference St. John1–Reference de Oliveira and Michot4 One explanation for the transition is based on dislocation shielding, in which the stress field of the dislocations emitted from the crack accommodates the crack tip stress intensity.Reference Rice and Thomson5–Reference Higashida, Narita, Suzuki and Takeuchi8 The amount accommodated is dependent not only on the Burgers vector of the emitted dislocations but also on the dislocation distribution around the crack tip. To discover the controlling mechanisms behind the brittle-to-ductile transition, knowledge of the three-dimensional spatial distribution of each type of dislocation is required. Until recently, this rested solely in the domain of large-scale molecular dynamics simulations,Reference Bulatov, Abraham, Kubin, Devincre and Yip9 because determining the spatial distribution experimentally was prohibitively difficult. Such simulations showed the formation of dislocation junctions, such as Lomer–Cottrell locks, around the crack tip that require the activation of dislocations on different slip systems so that the dislocations interact to form sessile junctions. For example, if a line dislocation is anchored by two sessile segments, the intermediate glissile segment can serve as a Frank–Read source. This will provide a mechanism to increase the dislocation source density, which is needed to produce the large number of dislocations for dislocation shielding to operate. The presence of these sources, however, has not been verified experimentally and a paucity of information remains about dislocation sources at crack tips.
A technique to visualize the spatial distribution of such dislocations is electron tomography. This involves reconstructing a three-dimensional model from many micrographs of the same region that are recorded at regular intervals over a wide angular range. Although widely applied in the life sciences, electron tomography is only emerging in the study of defects in crystalline materials where it was first used to reveal the morphology of precipitates, second phases, and so forth in crystalline materials.Reference Midgley, Weyland, Thomas and Johnson10–Reference Inoke, Kaneko, Weyl, Midgley, Higashida and Horita14 For forming reconstructions, diffraction contrast imaging conditions are generally avoided as it is difficult to maintain the exact same Bragg condition over the requisite angular range and the resulting variations in image contrast can cause difficulties in the reconstruction process. Nevertheless, there are limited examples in which diffraction contrast images have been used to form a tomogram of dislocation structures.Reference Barnard, Sharp, Tong and Midgley15–Reference Barnard, Sharp, Tong and Midgley18 To acquire the images necessary for the reconstruction, the increased penetration power of a high-voltage electron microscope (HVEM) enables thicker samples to be viewed, which is useful for imaging at high tilt angles; in silicon, the sample thickness can be several micrometers.Reference Tanaka and Higashida19–Reference Higashida, Narita, Tanaka, Morikawa, Miura and Onodera21
In the present study, the Burgers vectors and spatial arrangement of the dislocations surrounding a crack tip in Si were characterized by combining HVEM tomography with conventional g · b analysis. Using this information, the local stress intensity factor was calculated and a multiplication process for generating dislocation sources along a crack front was proposed.
II. EXPERIMENTAL
Commercially available P-type (001) silicon wafers were used in this study. Cracks were introduced at room temperature by using a Vickers indenter with a load of 200 g and a dwell time of 5 s. Dislocation activity from the crack tip was activated by holding the indented samples at high temperature for 1 h. The crack tip region was thinned to electron transparency by using a Gatan 691 ion mill. Diffraction contrast images of the dislocation structure were acquired at approximately every 2° over an angular range from −31º to +43º. The diffraction vector (g) was maintained close to 220 during the acquisition of images by adjusting the [110] direction of the sample to be parallel to the tilt axis of the holder. The HVEM (JEOL, JEM-1300NEF) at the Research Laboratory for High Voltage Electron Microscopy at Kyushu University was used at an accelerating voltage of 1250 kV. No filtering or contrast manipulation was performed on the micrographs used to produce the tomogram. The contrast from each image was sufficient for alignment using Inspec3D software (FEI). A three-dimensional reconstruction of the volume was produced from the aligned images using EM3D software22; the reconstruction served as the basis on which the dislocation lines were traced to construct a three-dimensional model of the volume. The Burgers vector of the observed dislocations was determined by applying the g · b invisibility criterion and the sign from the direction of oscillating contrast.Reference Higashida, Narita, Tanaka, Morikawa, Miura and Onodera21, Reference Ruvimov and Scheerschmidt23 The definition of the Burgers vector used in this study follows the finish to start/right-handed convention.Reference Hirth and Lothe24
III. RESULTS AND DISCUSSION
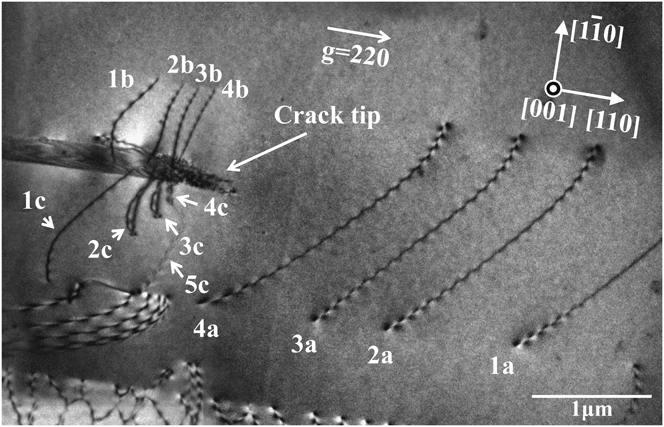
The bright-field image presented in Fig. 1 shows the different types of dislocations found vicinal to the crack tip. Each dislocation segment is labeled with a number indicating the dislocation loop from which the segment originated and a suffix letter indicating a specific segment produced during the thinning process. For example, dislocation segments 1a, 1b, and 1c were produced during thinning from dislocation loop 1. Similarly, dislocation 2 produced three segments 2a, 2b, and 2c, as did dislocation loops 3 and 4. Although it is clear that most of the dislocations reside on an inclined plane, neither the direction of inclination nor the three-dimensional arrangement of the dislocation structure are evident from Fig. 1 alone. Because the electron entry and exit surfaces are indistinguishable in a single micrograph, a series of similar images tilted in a consistent direction were acquired with the same imaging condition. They were used to construct a tomogram that revealed the distribution of dislocations and their spatial arrangement with respect to the crack tip.
Bright-field image of crack tip dislocations. The incident beam and foil normal directions are both [001], with g = 220. Dislocations 1a, 1b, and 1c were fragmented from the same dislocation loop. The same applies to 2a–2c, 3a–3c, and 4a–4c, each initially belonged to dislocation loops 2, 3, and 4, respectively. In addition, the tomogram and traced models in Figs. 2–3 reveal that dislocations labeled 2c, 3c, and 4c are cross-slipping out of the initial slip plane of  onto
 .

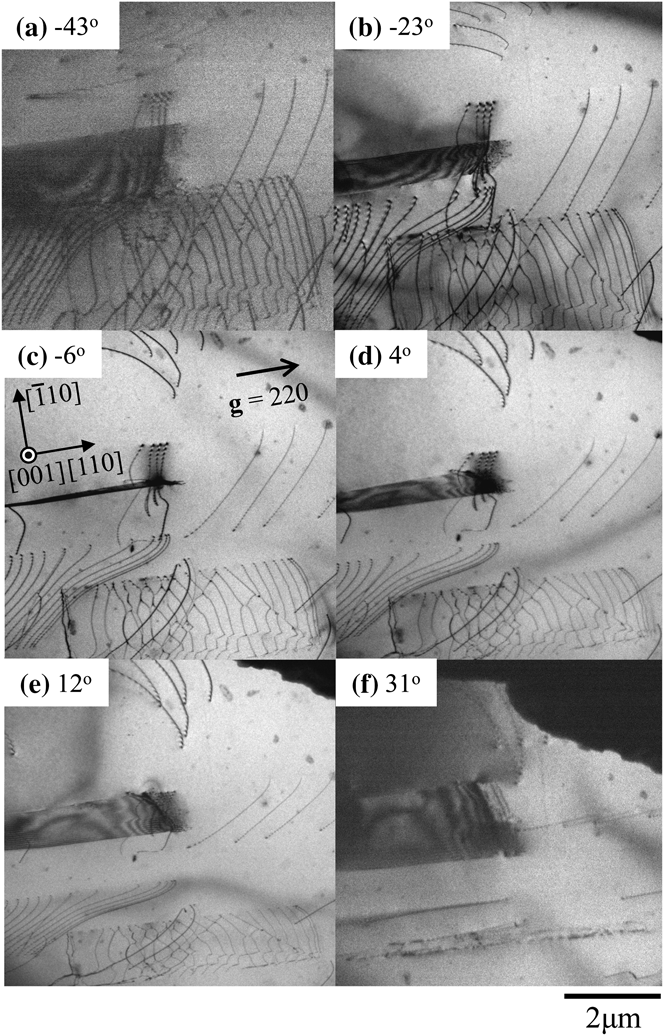
Figure 2 shows select images, which were captured using imaging conditions slightly deviated from the exact Bragg condition, from the tilt series that gives a wider view than that in Fig. 1. These images were acquired at tilt angles of −43°, −23°, −6°, 4°, 12°, and 31°. The angles indicated in Fig. 2 are those between the foil normal direction, [001], and incident beam direction. The positive rotation angle is defined clockwise with respect to [110]. Horizontal dislocation arrays above and below the crack in the figure are those of leading partial dislocations that bound overlapping stacking faults (or a microtwin); these are partial dislocations confirmed from images taken with different diffraction vectors. These are ignored in this study because they were not generated from the crack tip. The dislocation segments of interest are those emitted by the crack, and they are clustered in three regions: ahead of the crack tip (1a, 2a, 3a, and 4a) on one side of the crack (1b, 2b, 3b, and 4b) and on the other side of the crack (1c, 2c, 3c, and 4c). The labels were selected to indicate that the three segments labeled 1a, 1b, and 1c were originally part of the same dislocation loop with the fragmentation occurring during the foil thinning process. These indicates dislocations have a Burgers vector, as determined by g · b analysis, of (a/2)[011] and all dislocation segments except 2c, 3c, and 4c lie on the  plane with a line direction of nearly [011]. Segments of dislocations 2c, 3c, and 4c have cross-slipped from the original
 plane to the
 plane, with line directions along
 . The significance of these cross-slipped components will be considered later. From the perfect pairing of the dislocation segments, it can be surmised that four dislocation loops were emitted initially. This description of the dislocation structure is supported by the tomogram and the dislocation model constructed from it.
Tilt series of bright-field images around the crack tip. Snapshots of the tilt angle at (a)−43°, (b)−23°, (c)−6°, (d) 4°, (e) 12°, and (f) 31° are shown. The diffraction vector, g = 220, was maintained during the acquisition of the tilt series. The three-dimensional dislocation structure was obtained from this figure. A tilt-aligned animation of the images is shown in supplementary movie file 1 (journals.cambridge.org/JMR).

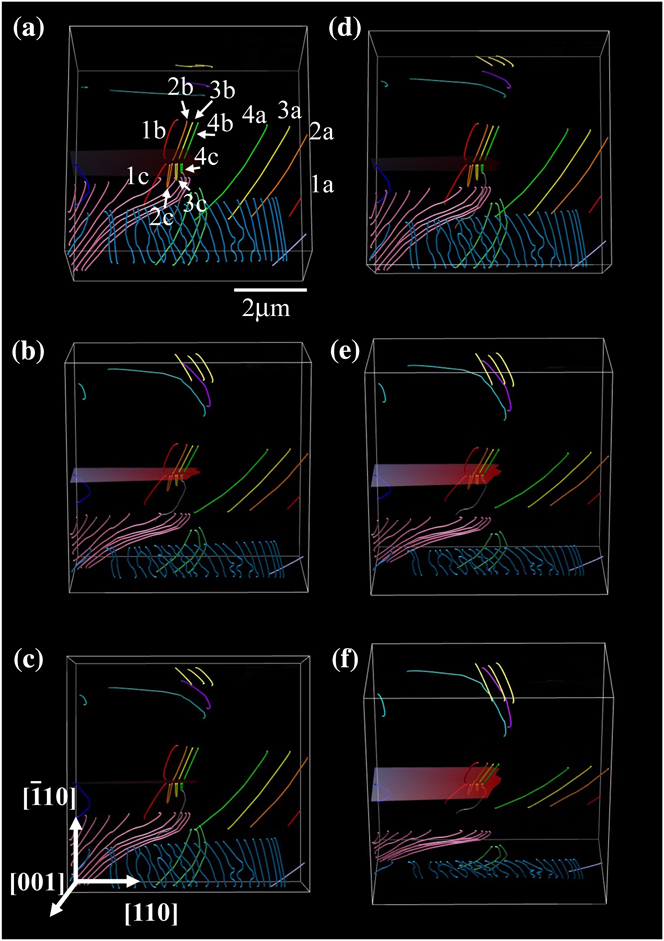
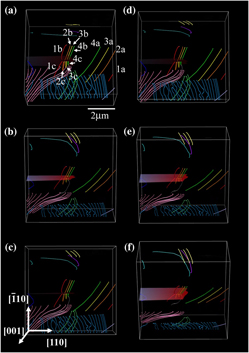
Snapshots of the model as seen from different viewing directions are provided in Fig. 3; the dislocations are labeled as before and color coded (online) to reflect each dislocation segment that once formed a single loop. For visual clarity, the labels are presented only in Fig. 3(a). A spatial animation of the dislocation structure adjacent to the crack is shown in supplementary movie file 2 (at journals.cambridge.org/JMR). The dislocation segments labeled 2c, 3c, and 4c were difficult to reconstruct properly because of the cross-slipped segments, which lie along the  direction on the
 plane, overlapping with the segments that have remained on the
 plane. The dislocation segment labeled 5c resides on the
 plane and was present during the acquisition of the tilt series in Fig. 2, although it was invisible in Fig. 1. This is attributable to the difficulty in establishing a true two-beam imaging condition at the high accelerating voltage used in this study. The Burgers vector of dislocation 5c was determined to be
 ; it resides on the
 plane, so it is sessile. The dislocation segment is along [011] so that the expected dislocation reaction would be between a dislocation segment with a Burgers vector of
 on the
 plane and one with a Burgers vector of (a/2)[011] on the
 plane. A dislocation from the crack tip and one from the specimen interior could have reacted to produce this dislocation.
Dislocation tomogram reconstructed from the tilt series in Fig. 2. Dislocations adjacent to the crack are color coded to reflect the association of each dislocation with other segments that once belonged to a single dislocation loop. A rotating view of these dislocations is shown in supplementary movie file 2 (view online at journals.cambridge.org/JMR). (color online)

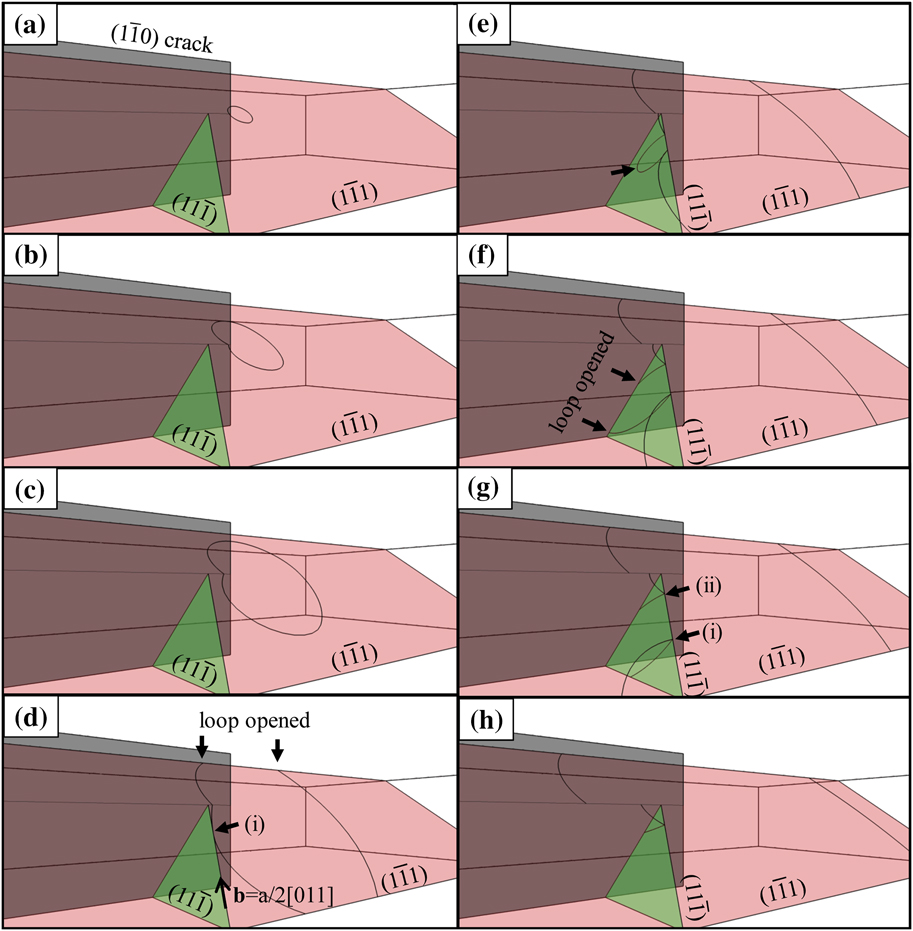
Figure 4 shows a time-progressed schematic of a possible explanation for the evolution of the observed dislocation structure, the animated sequence of which can be viewed in supplemental movie file 3. A dislocation loop on the  plane was generated at a dislocation source located near the crack front. This loop grows as shown in Figs. 4(a) to 4(c). The segment moving toward the specimen top surface reaches it and the loop opens as illustrated in Fig. 4(d); this is the reverse situation from the actual case in which the free surfaces created by the polishing intersect the loop and cause the fragmentation. The dislocation segment moving downward was fragmented when it encountered the free surface as shown in Fig. 4(d). The dislocation segment indicated by arrow (i) in Fig. 4(d) has a pure screw component with a Burgers vector (a/2)[011] and has cross-slipped onto the
 plane. The cross-slipped segment grew as a loop on the
 plane toward the crack plane as demonstrated in Fig. 4(e). Having reached the crack plane, the arrowed segment in Fig. 4(e), opened again [Fig. 4(f)], forming the configuration with two nodes (i) and (ii) [Fig. 4(g)]. Node (i) then moved away from the thinned area while node (ii) remained next to the crack with one segment still on the
 plane and the other segment cross-slipping onto the
 plane. The resulting structure of these dislocation segments is shown in Fig. 4(h).
Schematic illustration of the growth of a dislocation loop around the crack tip. The dislocation loop then cross-slips next to the crack. The process is also shown in supplementary movie file 3, at journals.cambridge.org/JMR. (color online)

Subsequent loops were produced in an identical manner, except that when a dislocation segment approached the crack in a similar fashion as in Fig. 4(f), it did not cross-slipp onto the same  plane as the first loop, but onto a different, parallel
 plane that sits closer to the crack tip. The third and fourth dislocations followed the same cross-slip process, and the cross-slipped segments of these dislocations formed an array next to the crack as shown in Figs. 1 and 3. Note that cross-slip occurs frequently even during the early stages of dislocation emission from the crack front. The effect of this cross-slip onto slip planes adjacent to the crack plane on the formation of dislocation sources is considered next.
The change in the local stress intensity due to the dislocation loops left at the crack tip for a mode I crack (k I) is given by

where K A and k d denote the respective applied stress intensity factor and the local stress intensity factor due to the dislocations. The z axis is set along the crack front with the origin at the center of a dislocation source and z′ as a position on the crack front along the z axis. Taking into account the three-dimensional nature of the dislocation structure as well as the effect of free surfaces belonging to the crack plane, the value of k d at position z′ along the z axis is

where bx, by, and bz are the x, y, and z components of the Burgers vector of the dislocation, respectively; μ is the shear modulus; and Gi and Gij (i, j = x, y, z) are the partial and the second partial differentials of the Bueckner potential with respect to i and i, j, respectively.Reference Gao25, Reference Higashida, Narita, Asano and Onodera26 Here, the Bueckner potential is given by

where

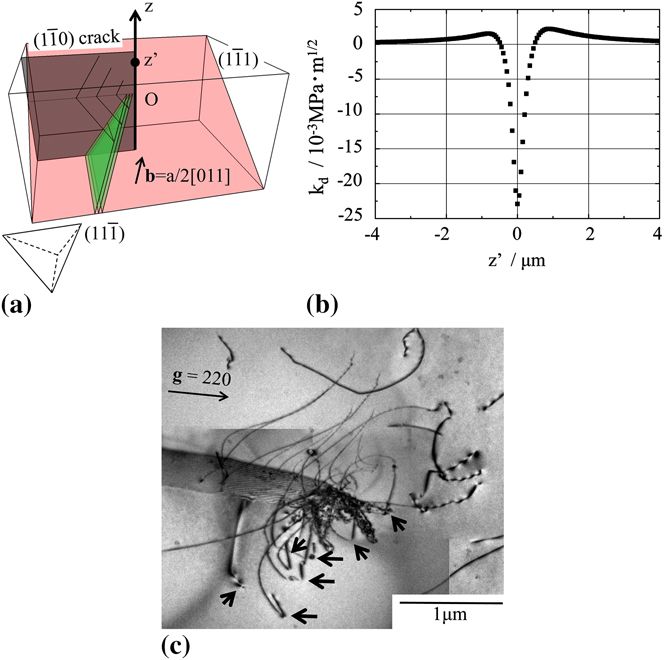
Figure 5(a) is a schematic illustration of the dislocation structure used for the calculation of k d. In the present study, only the effect of the three dislocation segments numbered 2c, 3c, and 4c, which remained after the cross-slip event, were considered. The configuration of the dislocations used for the calculation of k d are those observed; that is, each segment has cross-slipped from  to
 planes. The Burgers vector of the dislocations is set to be (a/2)[011] as obtained from the analysis. Figure 5(b) shows the value of k d along the crack front. The origin of the z axis, labeled O in Fig. 5(a), corresponds to the epicenter of the dislocation loops. The value of k d is the superposition of the effect from each dislocation loop. Note that k d varies according to z′, indicating that the stress accommodation attributable to dislocations depends on the position of the crack front. The k d values inside the dislocation loops are negative whereas those outside are positive. According to Eq. (1), z′ with a positive value of k d makes k I larger than K A; that is, the crack front outside the dislocation loop is antishielded. This suggests that the outside of the dislocation loop can serve as a new dislocation source to accommodate the positive stress intensity at that point. Figure 5(c) is a bright-field image of crack tip dislocations in which the substructure evolution has progressed from that shown in Fig. 1. The Burgers vector of all dislocation segments indicated by arrows was (a/2)[011], which is the same as those observed in Fig. 1. These dislocation segments cross-slipped from the
 plane onto neighboring
 planes in the same manner as those undergone by the dislocations in Fig. 1. The tilt series for these dislocations shows that they are on parallel but not coplanar
 planes. Those indicate that the dislocations are generated from different sources located along the crack front, suggesting the activation of other dislocation sources as the microstructure evolved. The source spacing along the crack front was found to be approximately 0.4 μm, which corresponds well with the distance between the origin and the position along z′ with the highest positive value of k d, as shown in Fig. 5(b).
(a) Schematic model of dislocation loops used for the kd calculation. Cross-slipped segments were taken into account. The Burgers vector and slip planes were those obtained by HVEM tomography. A Thompson’s tetrahedron is shown at the lower right. (b) The k d value along the z axis, defined to be along the crack front as shown in (a) Here, O is the origin of the z axis, which is the epicenter of the dislocation loops. An antishielding field exists on the outside of the loops. (c) Bright-field image around the crack tip when the dislocation process has advanced further. The dislocations have the same Burgers vector as those in Fig. 1. The arrows indicate the segments that have cross-slipped to the  plane. (color online)

Taking these results into account, the sequential multiplication process of dislocation sources along a crack front is proposed as follows: (i) A dislocation loop is emitted from a dislocation source at the crack front. (ii) This loop grows and a part of it wraps around the crack. (iii) The pure-screw component cross-slips from the  plane onto the
 plane. (iv) The cross-slipped segment is left beside the crack. (v) Subsequent dislocation loops are emitted from the crack tip and follow the same process. (vi) The antishielded region along the crack front becomes a new dislocation source, with the emitted dislocation loops ending up on parallel
 planes. (vii) The process takes place continuously, and the dislocation source multiplication proceeds along the crack front in a self-driven manner. (viii) In addition, new dislocation sources will be generated in front of the crack front, which leads to the second stage of dislocation multiplication in which other multiplication sources, for example Frank–Read sources, may be generated and activated to produce the necessary number of dislocations. The increase in the number of dislocation sources such as the sequential multiplication observed in this study enhances the possibility that a Frank–Read source is produced around the crack tip.
IV. CONCLUSIONS
The dislocation structure around a crack tip in Si was observed by electron microscopy, and the three-dimensional structure was obtained by reconstructing a series of images taken over a wide angular range. From the resulting tomogram, coupled with conventional analysis, the following conclusions can be drawn:
(1) Dislocation loops cross-slip close to the crack even in the early stages of dislocation generation from the crack tip.
(2) The remnant dislocation loops effectively antishield the crack tip, and the location with the highest k d along the crack front serves as a new source. These observations reveal a sequential, self-driven multiplication process for dislocation sources that lie along the crack front during the initial stages of plastic deformation.
ACKNOWLEDGMENTS
Dr. Tanaka and Dr. Higashida acknowledge the partial support of this work by Grant-in-Aid for Scientific Research (22246090 and 22760544). Dr. Liu and Dr. Robertson acknowledge support from the U.S. Department of Energy through Grant DE-FE02-07ER46443.