Introduction
The use of statistical and machine learning (ML) algorithms (broadly characterized as “Artificial Intelligence (AI)” herein) within the materials science community has experienced a resurgence in recent years.[Reference Agrawal and Choudhary1] However, AI applications to material science have ebbed and flowed through the past few decades.[Reference Gakh, Gakh, Sumpter and Noid2–Reference Lee, Brown, Dagnall, Bicknell-Tassius, Brown and May7] For instance, Volume 700 of the Materials Research Society's Symposium Proceedings was entitled “Combinatorial and Artificial Intelligence Methods in Materials Science,” more than 15 years ago,[Reference Takeuchi, Koinuma, Amis, Newsam, Wille and Buelens8] and expounds on much of the same topics as those at present, with examples including high-throughput (HT) screening, application of neural networks to accelerate particle simulations, and use of genetic algorithms to find ground states. One may ask the question as to what makes this resurgence different, and whether the current trends can be sustainable. In some ways, this mirrors the rises and falls of the field of AI, which has had several bursts of intense progress followed by “AI winters.”[Reference Bohannon9,Reference Sejnowski10] The initial interest was sparked in 1956,[Reference McCarthy, Minsky, Rochester and Shannon11] where the term was first coined, and although interest and funding were available, computational power was simply too limited. A rekindling began in the late 1980s, as more algorithms (such as backpropagation for neural networks[Reference LeCun, Touresky, Hinton and Sejnowski12] or the kernel method for classification[Reference Boser, Guyon and Vapnik13]) were utilized. The recent spike has been driven in large part by the success of deep learning (DL),[Reference LeCun, Bengio and Hinton14] with the parallel rise in graphics processing units and general computational power.[Reference Brodtkorb, Hagen and Sætra15,Reference Rupp16] The question becomes whether the current, dramatic progress in AI can translate to the materials science community. In fact, the key enabling component of any AI application is the availability of large volumes of structured labeled data—which we term in this prospective “libraries.” The available library data both enables classical correlative ML and also opens a pathway for exploration of underlying causative physical behaviors. We argue in this prospective that, when done in the appropriate manner, AI can be transformative not only in that it can allow for acceleration of scientific discoveries but also that it can change the way materials science is conducted.
The recent acceleration of adoption of AI/ML-based approaches in materials science can be traced back to a few key factors. Perhaps, most pertinent is the Materials Genome Initiative, which was launched in 2011 with an objective to transform manufacturing via accelerating materials discovery and deployment.[Reference de Pablo, Jones, Kovacs, Ozolins and Ramirez17] This required the advancement of HT approaches to both experiments and calculations, and the formation of online, accessible repositories to facilitate learning. Such databases have by now have become largely mainstream with successful examples of databases including Automatic Flow for Materials Discovery (AFLOWLIB),[Reference Curtarolo, Setyawan, Wang, Xue, Yang, Taylor, Nelson, Hart, Sanvito and Buongiorno-Nardelli18] Joint Automated Repository for Various Integrated Simulations (JARVIS-density functional theory (DFT)),[Reference Choudhary19] Polymer Genome,[Reference Kim, Chandrasekaran, Huan, Das and Ramprasad20] Citrination,[21] and Materials Innovation Network[22] that host hundreds of thousands of datapoints from both calculations as well as experiments. The timing of the initiative coincided with a rapid increase in ML across commercial spaces, largely driven by the sudden and dramatic improvement in computer vision, courtesy of deep neural networks, and the availability of free packages in R or python (e.g., scikit-learn[Reference Pedregosa, Varoquaux, Gramfort, Michel, Thirion, Grisel, Blondel, Prettenhofer, Weiss and Dubourg23]) to apply common ML methods on acquired datasets. This availability of tools, combined with access to computational resources (e.g., through cloud-based services or internally at large institutions), was also involved. It can be argued that one of the main driving forces within the materials science community was an acknowledgement that many grand challenges, such as the materials design inverse problem, were not going to be solved with conventional approaches. Moreover, the quantities of data that were being acquired, particularly at user facilities such as synchrotrons or microscopy centers, were accelerating exponentially, rendering traditional analysis methods that relied heavily on human input unworkable. In the face of the data avalanche, it was perhaps inevitable that scientists would turn to the methods provided via data science and ML.[Reference Kalinin, Sumpter and Archibald24–Reference Bonnet and Hawkes26] Note that in this prospective,commercial software is identified to specify procedures. Such identification does not imply a recommendation by the National Institute of Standards and Technology.
Thus, the question becomes, how can these newly found computational capabilities and “big” data be leveraged to gain new insights and predictions for materials? There are already some answers. For example, the torrent of data from first principles simulations has been used for HT screening of candidate materials, with notable successes.[Reference Nyshadham, Oses, Hansen, Takeuchi, Curtarolo and Hart27–Reference de Pablo, Jackson, Webb, Chen, Moore, Morgan, Jacobs, Pollock, Schlom, Toberer, Analytis, Dabo, DeLongchamp, Fiete, Grason, Hautier, Mo, Rajan, Reed, Rodriguez, Stevanovic, Suntivich, Thornton and Zhao29] Naturally, one asks the question as to what insights can be gained from similar databases based not on theory, but on experimental data, e.g., of atomically resolved structures, along with their functional properties. Of course, microstructures have long been optimized in alloy design.[21,Reference Adams, Kalidindi and Fullwood30] Having libraries (equivalently, databases) of these structures, with explicit mentioning of their processing history, can be extremely beneficial not just for alloys but for many other material systems, including soft matter.[Reference Huan, Mannodi-Kanakkithodi, Kim, Sharma, Pilania and Ramprasad31] These databases can be used for, e.g., utilizing known knowledge of similar systems to accelerate the synthesis optimization process, to train models to automatically classifying structures and defects, and to identify materials with similar behaviors that are exhibited, potentially allowing underlying causal relationships to be established.
In this prospective, we focus on the key areas of library generation of material structures and properties, through both simulations/theory and imaging. HT approaches enable both simulation and experimental databases to be compiled, with the data used to build models that enable property prediction, determine feature importance, and guide experimental design. In contrast, imaging provides the necessary view of microstates enabling the development of statistical mechanical models that incorporate both simulations and macroscopic characterization to improve predictions and determine underlying driving forces. Combining the available experimental and theoretical libraries in a physics-based framework can accelerate materials discoveries and lead to lasting transformations of the way materials science research is approached worldwide.
Databases, libraries, and integration
This prospective will focus on theory-led initiatives for database generation (and subsequent ML to predict properties and accelerate material discovery) and contrast them with the equally pressing need for their experimental counterparts. While the theory libraries are well ahead, substantial progress in materials science will rely on experimental validation of theoretical predictions and tight feedback between data-driven models, first principles and thermodynamic modeling, and experimental outcomes. It is also important to note that theoretical databases and libraries operate with an idealized representation, where all inputs and outputs are known and hence of interest are processes such as data compression, determination of reduced descriptors, and integration into analysis workflows. However, the validity and precision of theoretical models are always evolving. In comparison, experimental data will be characterized by the large number of latent or unknown degrees of freedom that may or may not be relevant to specific phenomena.
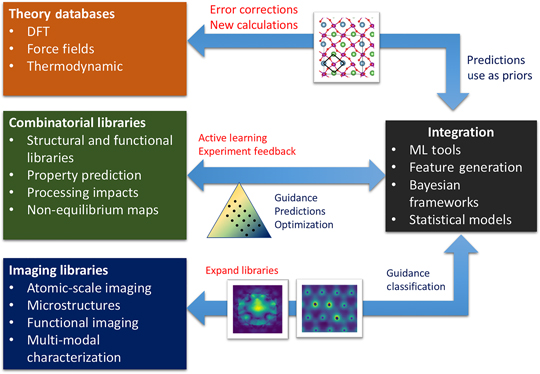
Experimental libraries can be created from combinatorial experiments to rapidly map the composition space and complemented with atomic and functional imaging to generate libraries that can map local structure to functionality. The broad vision is summarized in Fig. 1. The success of any of these individual areas on their own will be limited; experimentally, the search space is much too large to iterate; computationally, the prediction of certain properties or the role of defects in, e.g., correlated systems remain extremely challenging and models still need experimental validation. From the imaging standpoint, much work remains to be done in automating the generation of atomic-scale defect libraries, although computer vision and DL-based approaches are showing tremendous promise.[Reference Ziatdinov, Jesse, Vasudevan, Sumpter, Kalinin and Dyck32,Reference Madsen, Liu, Kling, Wagner, Hansen, Winther and Schiøtz33] These data, from theory and experiment, across length scales, can then be combined either directly in data-driven models (ML) or through more formal methods that consider uncertainty, such as Bayesian methods. This can also be achieved using statistical mechanical models that are refined and fit based on theoretical and experimental data at multiple length scales, allowing the understanding of the driving forces for materials behavior and enabling feedback to experiment and first principles theory.
Progress in materials science requires understanding driving forces governing phenomena, so that materials can be both discovered and optimized for applications. Fundamentally, accessing the knowledge space to accelerate this cycle requires the availability of data from simulations and the experiment for materials synthesized under different conditions. Imaging provides a window into local configurations and provides a critical link for understanding the driving forces of observed behavior. ML tools enable the generation of these databases and facilitate a rapid prediction of properties from data-driven models. Similarly, the data can be synthesized together in a Bayesian formulation, or using statistical mechanical models, to agglomerate all available sources of information to produce more accurate predictions. Ideally, the knowledge gained will be transferable, enabling more efficient design cycles for similar material systems. These tools all require community efforts for availability of code, data, and workflows, that is critical to realizing this new future.

Our roadmap for this prospective is as follows. We begin with an overview of databases of theoretical calculations, which in many ways catalyzed this field, and which are the most well-established in this area. We then branch from HT computations to HT experiments that can be used to generate experimental realizations in rapid time. These are beneficial for exploring macroscopic structure–property relationships. Complementing the macroscopic studies is the need for local imaging libraries, which compare the local atomic or mesoscopic structure with the local functional property. We discuss recent works to address this issue, which has been less well explored, but which are critical for the understanding of disordered systems with strong localization. Finally, we explain how these libraries can be utilized in concert and incorporated into a statistical mechanical framework for predictive modeling with quantified uncertainty. We end with a discussion on the challenges at the individual, group, and department level, and describe our outlook for material science under this new paradigm.
Theory-based library generation
Whereas for most of humanity materials discovery was largely Edisonian in approach, in the modern era, materials design can be facilitated via first principles (and other) simulations that can rapidly explore different candidates in silico. Computational methods are usually classified in terms of length scale, going from quantum atomistic to continuum; however, irrespective of their scale, they all are constrained by the scale of a simulation (length and time), accuracy, and transferability. For instance, quantum-based methods, such as DFT, have been phenomenally successful in discovering new materials with important technological applications, such as those used in solid-state batteries,[Reference Kang and Ceder34,Reference Richards, Miara, Wang, Kim and Ceder35] dopants for effective strengthening of alloys,[Reference Kirklin, Saal, Hegde and Wolverton36] or 2D materials.[Reference Mounet, Gibertini, Schwaller, Campi, Merkys, Marrazzo, Sohier, Castelli, Cepellotti and Pizzi37,Reference Choudhary, Kalish, Beams and Tavazza38] These methods also aided in explaining physical phenomena such as diffusion mechanisms,[Reference Mo, Ong and Ceder39] experimental spectra,[Reference Beams, Cançado, Krylyuk, Kalish, Kalanyan, Singh, Choudhary, Bruma, Vora and Tavazza40] etc. More recently, DFT[Reference Sholl and Steckel41]-based HT approaches have led to the creation of open-source large material property databases such as MaterialsProject,[Reference Jain, Ong, Hautier, Chen, Richards, Dacek, Cholia, Gunter, Skinner and Ceder42] AFLOWLIB,[Reference Curtarolo, Setyawan, Wang, Xue, Yang, Taylor, Nelson, Hart, Sanvito and Buongiorno-Nardelli18] Open Quantum Materials Database (OQMD),[Reference Kirklin, Saal, Meredig, Thompson, Doak, Aykol, Rühl and Wolverton43] Automated Interactive Infrastructure and Database for Computational Science (AiiDA),[Reference Pizzi, Cepellotti, Sabatini, Marzari and Kozinsky44] JARVIS-DFT,[Reference Choudhary, Cheon, Reed and Tavazza45] Organic Materials Database (OMDB)[Reference Geilhufe, Olsthoorn, Ferella, Koski, Kahlhoefer, Conrad and Balatsky46] QM9,[Reference Ramakrishnan, Dral, Rupp and Von Lilienfeld47] etc. However, DFT is heavily limited by the simulation size to something on the order of a few hundred atoms. Empirical potentials[Reference Allen and Tildesley48] help overcome the size issue, as they can simulate millions of atoms. However, they require rigorous potential fitting to simulate reasonable behavior.[Reference Choudhary, Biacchi, Ghosh, Hale, Walker and Tavazza49,Reference Choudhary, Congo, Liang, Becker, Hennig and Tavazza50] Larger scale methods, such as finite element method and phase field, are limited by depending on critical inputs from experimental data and atomistic simulations.[Reference Ogata, Lidorikis, Shimojo, Nakano, Vashishta and Kalia51] Fortunately, ML for materials has evolved to become a promising alternative in solving some of the computational materials science problems mentioned above.[Reference Butler, Davies, Cartwright, Isayev and Walsh52]
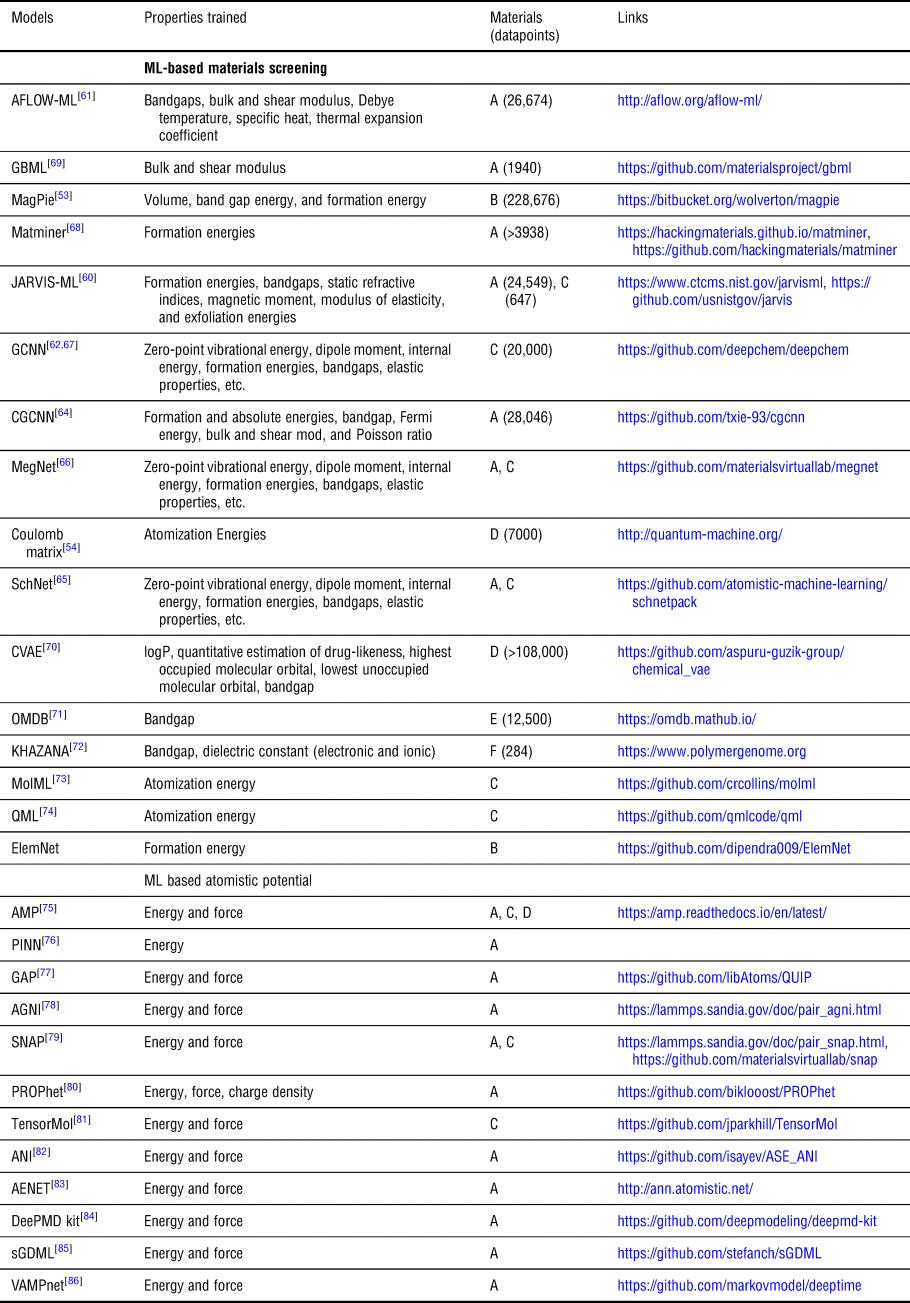
There are four main components in successfully applying ML to materials: (i) acquiring large enough datasets, (ii) designing feature vectors that can appropriately describe the material, (iii) implementing a validation strategy for the models, and (iv) interpreting the ML model where applicable. The first step (i) is facilitated by the generation of the large datasets mentioned above. Step (ii) is more complicated: while the databases provide a consistent set of target data, conversion of core material science knowledge to computers requires feature vector generation of all those materials in the databases. Chemical descriptors based on elemental properties (for instance, the average of electronegativity and ionization potentials in a compound) have been successfully applied in fields such as alloy formation[Reference Ward, Agrawal, Choudhary and Wolverton53] and have led to for various computational discoveries.[Reference Ward, Agrawal, Choudhary and Wolverton53] Nevertheless, this approach is not appropriate when modeling different structure prototypes with the same composition because ignoring structural information does not allow to differentiate between them. Structural features as descriptors have been recently proposed based on the Coulomb matrix,[Reference Rupp, Tkatchenko, Müller and Von Lilienfeld54,Reference Faber, Lindmaa, Lilienfeld and Armiento55] partial radial distribution function,[Reference Schütt, Glawe, Brockherde, Sanna, Müller and Gross56] Voronoi tessellation,[Reference Ward, Liu, Krishna, Hegde, Agrawal, Choudhary and Wolverton57] Fourier series,[Reference Bartók, Kondor and Csányi58] and several others in recent works.[Reference Faber, Hutchison, Huang, Gilmer, Schoenholz, Dahl, Vinyals, Kearnes, Riley and von Lilienfeld59] Features such as classical force-field inspired descriptors (CFID)[Reference Choudhary, DeCost and Tavazza60] and fragment descriptors[Reference Isayev, Oses, Toher, Gossett, Curtarolo and Tropsha61] allow combing structural and chemical descriptors in one unified framework. These are generally a fixed size descriptor of all the samples in the dataset. For example, MagPie[Reference Ward, Agrawal, Choudhary and Wolverton53] gives 145 features, while CFID[Reference Choudhary, DeCost and Tavazza60] gives 1557 descriptors.
A conceptually different way to obtain feature vectors is to generate them automatically using approaches such as convolution neural networks,[Reference Kearnes, McCloskey, Berndl, Pande and Riley62] SchNet,[Reference Schütt, Kindermans, Felix, Chmiela, Tkatchenko and Müller63] and Crystal Graph Convolutional Neural Networks (CGCNN)[Reference Xie and Grossman64] for instance, which extracts the important features by themselves taking advantage of a deep neural network architecture. Most of these methods are applied to specific classes of materials because of the presence or absence of periodicity in one or more crystallographic directions, such as crystalline inorganic solids, molecules or proteins, but features such as the Coulomb matrix,[Reference Rupp, Tkatchenko, Müller and Von Lilienfeld54] CFID,[Reference Choudhary, DeCost and Tavazza60] SchNet,[Reference Schütt, Sauceda, Kindermans, Tkatchenko and Müller65] MegNet,[Reference Chen, Ye, Zuo, Zheng and Ong66] and GCNN[Reference Kearnes, McCloskey, Berndl, Pande and Riley62,Reference Gilmer, Schoenholz, Riley, Vinyals and Dahl67] hold a generalized appeal for all classes of materials. Luckily, some of these feature generators are available in the general ML-framework code such as Matminer.[Reference Ward, Dunn, Faghaninia, Zimmermann, Bajaj, Wang, Montoya, Chen, Bystrom and Dylla68] A comprehensive set of feature vector types, their applications, and corresponding resource links are provided in Table I. The validation strategy consists of reporting accuracy metrics such as the mean absolute error, root mean square error, and R2. Importantly, plots such as learning curves and cross-validation plots are standard ways of testing ML models from the data science perspective. Although these are some of the common data-science metrics, physics-inspired validation strategies such as integrating evolutionary approaches with ML to map a generalized energy landscape,[Reference Choudhary, DeCost and Tavazza60,Reference Artrith, Urban and Ceder83] or testing energy-volume curve beyond the training set[Reference Pun, Batra, Ramprasad and Mishin76] have recently drawn much attention.
Examples of AI-based material-property predictions for different types of materials.

The types of materials consist of (A) 3D inorganic crystalline solids, (B) stable 3D inorganic crystalline solids, (C) 2D materials/surfaces, (D) molecules, (E) 3D organic crystals, and (F) crystalline polymers.
The correlation-based ML models perform well in interpolation but poorly for extrapolation tasks. When combined with the non-differentiability of chemical spaces, it limits the application of classical ML in materials science. An alternative is offered physics-inspired ML, where the extrapolation and interpolation are performed along with manifolds corresponding to physically possible atomic configurations and satisfying basic physical laws and constraints. However, although there has been a lot of work in developing databases and feature vectors, coming up with strategies for physics-based ML models[Reference Xue, Balachandran, Hogden, Theiler, Xue and Lookman87] still needs much detailed work. Additionally, the interpretability of a model can be vitally important from a scientific understanding perspective. This is motivated by a relatively new area in AI: so-called “Explainable AI.”[Reference Gunning and Aha88] The explainability and the interpretability of the model mainly depend on the type of ML algorithm. For example, in Refs. [Reference Choudhary, DeCost and Tavazza60,Reference Isayev, Oses, Toher, Gossett, Curtarolo and Tropsha61] , feature importance plots revealed some of the important ML descriptors that guide the model. In models such as graph networks, elemental embeddings can reveal chemical similarity.[Reference Xie and Grossman64,Reference Chen, Ye, Zuo, Zheng and Ong66]
Presently, ML models have been primarily used for screening of materials. This is because an ML model for a physical quantity allows to estimate such a quantity much faster than computing it. This allows one to probe a much larger space of materials than possible when performing actual calculations, and it is true for any type of computational methodology (DFT, phase field, and continuum modelling, for instance). Once ML has identified the sub-space of materials that likely have the desired property, then those, and only those, are probed using the computational technique of choice, DFT, for instance. In this sense, if traditional methods, such as DFT, have been used as a screening tool for experiments, then ML can act as the screening tool for DFT methods (standard DFT options as well as its hybrid-functional or higher-order corrections). Some of these material screening applications are drug discovery,[Reference Mayr, Klambauer, Unterthiner, Steijaert, Wegner, Ceulemans, Clevert and Hochreiter89] finding new binary compounds,[Reference Curtarolo, Morgan, Persson, Rodgers and Ceder90] new perovskites,[Reference Pilania, Balachandran, Kim and Lookman91] full-Heusler compounds,[Reference Oliynyk, Antono, Sparks, Ghadbeigi, Gaultois, Meredig and Mar92] ternary oxides,[Reference Hautier, Fischer, Jain, Mueller and Ceder93] hard materials,[Reference De Jong, Chen, Notestine, Persson, Ceder, Jain, Asta and Gamst69] inorganic solid electrolytes,[Reference Ahmad, Xie, Maheshwari, Grossman and Viswanathan94] high photo-conversion efficiency materials,[Reference Pyzer-Knapp, Li and Aspuru-Guzik95] 2D materials,[Reference Choudhary, DeCost and Tavazza60] and superconducting materials.[Reference Stanev, Oses, Kusne, Rodriguez, Paglione, Curtarolo and Takeuchi96] Some material science-related ML tools (GBML,[Reference De Jong, Chen, Notestine, Persson, Ceder, Jain, Asta and Gamst69] AFLOW-ML,[Reference Isayev, Oses, Toher, Gossett, Curtarolo and Tropsha61] JARVIS-ML,[Reference Choudhary, DeCost and Tavazza60] and OMDB,[Reference Gómez-Bombarelli, Wei, Duvenaud, Hernández-Lobato, Sánchez-Lengeling, Sheberla, Aguilera-Iparraguirre, Hirzel, Adams and Aspuru-Guzik70] for instance) allow web-based prediction of static properties to further accelerate material screening.
A second, major application of ML techniques to material science is in the realm of developing interatomic potentials, also known as force-fields, to simulate the dynamics of a system or to run Monte Carlo simulations. In this instance, ML is used to determine the parameters used in the phenomenological expression of the energy. Such expressions for the energy are then used to derive all other properties. Finding the right parameters (i.e., fitting the potential) is usually a computationally expensive task because of the very large configurational and parameter multi-dimensional spaces that need to be probed simultaneously while respecting all relevant physical constraints. Some of the atomistic potentials developed using ML are atomistic machine learning package (AMP),[Reference Khorshidi and Peterson75] physically informed artificial neural networks (PINNs),[Reference Pun, Batra, Ramprasad and Mishin76] Gaussian approximation potentials (GAPs),[Reference Bartók and Csányi77] Agni,[Reference Huan, Batra, Chapman, Krishnan, Chen and Ramprasad78] and spectral neighbor analysis potential (SNAP).[Reference Thompson, Swiler, Trott, Foiles and Tucker79] These potentials are shown to surpass conventional interatomic potentials both in accuracy and versatility.[Reference Botu, Batra, Chapman and Ramprasad97] These models are mainly developed for elemental solids, such as Ta, Mo, W, Al etc., or for a few binaries, such as Ni-Mo. Developing force fields for multicomponent systems is still limited due to an exponential increase in the number of ML parameters. However, unlike conventional fitting, these parameters can be optimized in a relatively more systematic way. Importantly, a standard force-field evaluation work-flow, like JARVIS-forcefield (JARVIS-FF),[Reference Choudhary, Biacchi, Ghosh, Hale, Walker and Tavazza49,Reference Choudhary, Congo, Liang, Becker, Hennig and Tavazza50] still needs to be developed for such ML-based force-fields, to understand their generalizability. In fact, verification and validation of these ML-based models is a critical challenge of the field.
Combinatorial libraries and high-throughput experimentation
Complementing the theoretical libraries listed above requires experimental libraries that map structures, processing, and compositions to functionality. By now numerous outlets exist including Polymer Genome,[Reference Kim, Chandrasekaran, Huan, Das and Ramprasad20] Citrination,[21] Dark Reactions,[Reference Kalinin, Rodriguez, Budai, Jesse, Morozovska, Bokov and Ye98] Materials Data Facility,[Reference Blaiszik, Chard, Pruyne, Ananthakrishnan, Tuecke and Foster99] and Materials Innovation Network.[22] This again needs to be accomplished at different length scales: microscopic, to better understand the links between microstructure or atomic configurations and macroscopic properties, as well as through macroscopic experiments that explore large regions of the composition space to rapidly map functional phase diagrams. The latter is made possible through high-throughput experimentation (HTE).
HTE and AI tools have been linked since HTE was re-discovered in the early 1990s. The origins of HTE can be traced back to the early 20th century with the discovery of the Haber-Bosch catalyst[Reference Sheppard100] and the Hanak multi-sample concept.[Reference Hanak101] In both cases, the investigators realized that the search for new materials with outstanding properties and new mechanisms required a broader search through composition-processing-structure-property space than could be afforded by conventional one-sample-at-a-time techniques. As time automation and computational resources were limited so a liberal usage of “elbow grease” was required both for performing the experiments and data analysis. It took several decades for the publication of the landmark HTE paper by Xiang et al.,[Reference Xiang, Sun, Briceno, Lou, Wang, Chang, Wallace-Freedman, Chen and Schultz102] and the ready availability of personal computers for this methodology to gain significant traction within the materials community. There have been a number of recent reviews[Reference Barber and Blamire103–Reference Green, Takeuchi and Hattrick-Simpers106] on the topic, and today HTE is largely considered to be a mature field with significant efforts (and discoveries) spanning a large number of fields including catalysis,[Reference Dubois, Duquenne, Holderich and Kervennal107] dielectric materials,[Reference Green, Choi, Hattrick-Simpers, Joshi, Takeuchi, Barron, Campo, Chiang, Empedocles and Gregoire104] and polymers.[Reference Arriola, Carnahan, Hustad, Kuhlman and Wenzel108]
The creation and deployment of HTE workflows necessarily lead to a bottleneck centered around the need to interpret large (sometimes thousands) of materials data correlated in composition, processing, and microstructure from a single experiment.[Reference Meguro, Ohnishi, Lippmaa and Koinuma109,Reference Takeuchi, Lippmaa and Matsumoto110] By the early 2000s, a single HTE sample containing hundreds of individual samples could be made and measured for a range of characteristics within a week, but the subsequent knowledge extraction of composition, structure, properties of interest, and figure of merit often took weeks to months. There were several early international efforts to standardize data formats and create data analysis and interpretation tools for large-scale data sets.[Reference Koinuma111] These efforts touched on using AI to enable experimental planning[Reference Smotkin and Diaz-Morales112,Reference Watanabe, Umegaki, Hashimoto, Omata and Yamada113] and data analysis and visualization.[Reference Dell'Anna, Lazzeri, Canteri, Long, Hattrick-Simpers, Takeuchi and Anderle114–Reference Rodemerck, Baerns, Holena and Wolf117]
An unexpectedly difficult exemplar for the field is the mapping of non-equilibrium phase maps through the collection of spectral data as a function of composition and processing, so-called “phase mapping.” A great deal of effort has been expended in working with computer scientists to better understand how to effectively correlate diffraction spectra of limited range to phase composition for a given sample. The problem is further exacerbated by peak shift due to alloying, the presence of non-equilibrium phases, and distortion of peak intensities due to the preferred orientation of crystallites (texturing). The overwhelming majority of this work has focused on using unsupervised techniques such as hierarchical clustering,[Reference Long, Hattrick-Simpers, Murakami, Srivastava, Takeuchi, Karen and Li118] wavelet transformations,[Reference Gregoire, Dale and Van Dover119] non-negative matrix factorization,[Reference Long, Bunker, Li, Karen and Takeuchi120] and constraint programming paired with kernel methods.[Reference LeBras, Damoulas, Gregoire, Sabharwal, Gomes and Van Dover121] Comparatively little work has been devoted to the use of supervised or semi-supervised techniques.[Reference Bunn, Han, Zhang, Tong, Hu and Hattrick-Simpers122,Reference Bunn, Hu and Hattrick-Simpers123] A recent review article is available for the interested reader.[Reference Hattrick-Simpers, Gregoire and Kusne124] Fully unsupervised techniques face challenges not only from noisy and limited range of experimental data, but also from highly non-linear scaling of the computational resources with a number of observations in the dataset. More recent work in the field has sought to impose locality (e.g., that neighboring compositions are likely to include the same phases) into creating the phase map through the use of segmentation techniques[Reference Kusne, Keller, Anderson, Zaban and Takeuchi125] or by attempting to deconvolve peak shift through the application of convolution non-negative matrix factorization.[Reference Suram, Xue, Bai, Le Bras, Rappazzo, Bernstein, Bjorck, Zhou, van Dover and Gomes126] A common theme for all of these efforts has been the importance of working on translating materials science problems into more general problems that are of interest to computer scientists. These new approaches appear to operate sufficiently rapidly as to permit on-the-fly analysis of diffraction data as it is being taken.[Reference Kusne, Gao, Mehta, Ke, Nguyen, Ho, Antropov, Wang, Kramer, Long and Takeuchi127]
Once knowledge extraction catches up to HTE synthesis, and characterization, the limit to rate of new materials discovery becomes that of decision making, i.e., what materials to pursue next given the knowledge of materials discovered so far (and processing conditions needed to make them). HTE groups have long worked with theoreticians to identify interesting materials to pursue.[Reference Cui, Chu, Famodu, Furuya, Hattrick-Simpers, James, Ludwig, Thienhaus, Wuttig and Zhang128–Reference Yan, Yu, Suram, Zhou, Shinde, Newhouse, Chen, Li, Persson and Gregoire130] More recently, in an effort to decrease the turnover time, several HTE groups have turned to the use of AI for hypothesis or lead generation.[Reference Stanev, Oses, Kusne, Rodriguez, Paglione, Curtarolo and Takeuchi96,Reference Hattrick-Simpers, Choudhary and Corgnale131,Reference Ren, Ward, Williams, Laws, Wolverton, Hattrick-Simpers and Mehta132] One example of such an AI platform is the Materials-Agnostic Platform for Informatics and Exploration developed at Northwestern, which transforms compositional data into a set of chemical descriptors that can be used to train an ML model that targets a particular property such as the band gap or an alloy's metallic glass forming capability.[Reference Ward, Agrawal, Choudhary and Wolverton53] One additional benefit of HTE experiments is that they produce negative and positive results simultaneously without any additional cost. Thus, the models can use both negative and positive results from HTE experiments to produce less-biased models than those based on traditional material discovery campaigns.
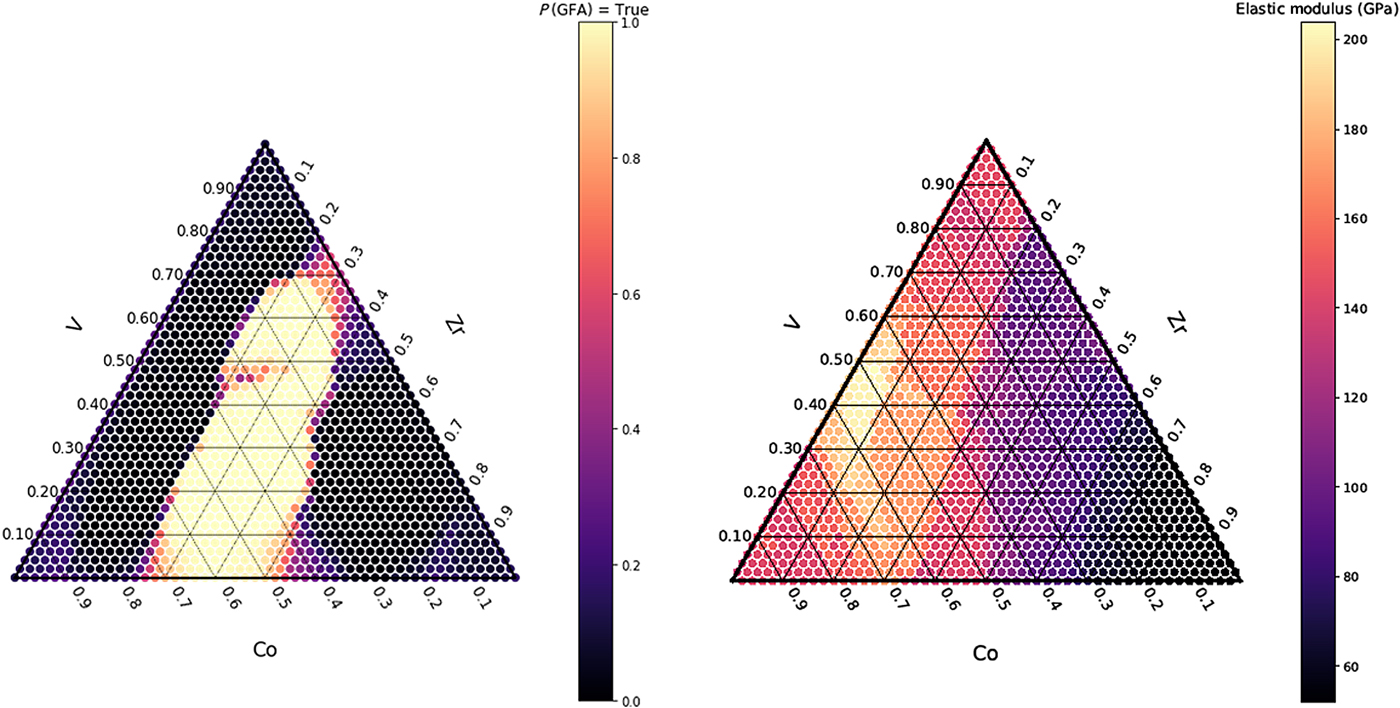
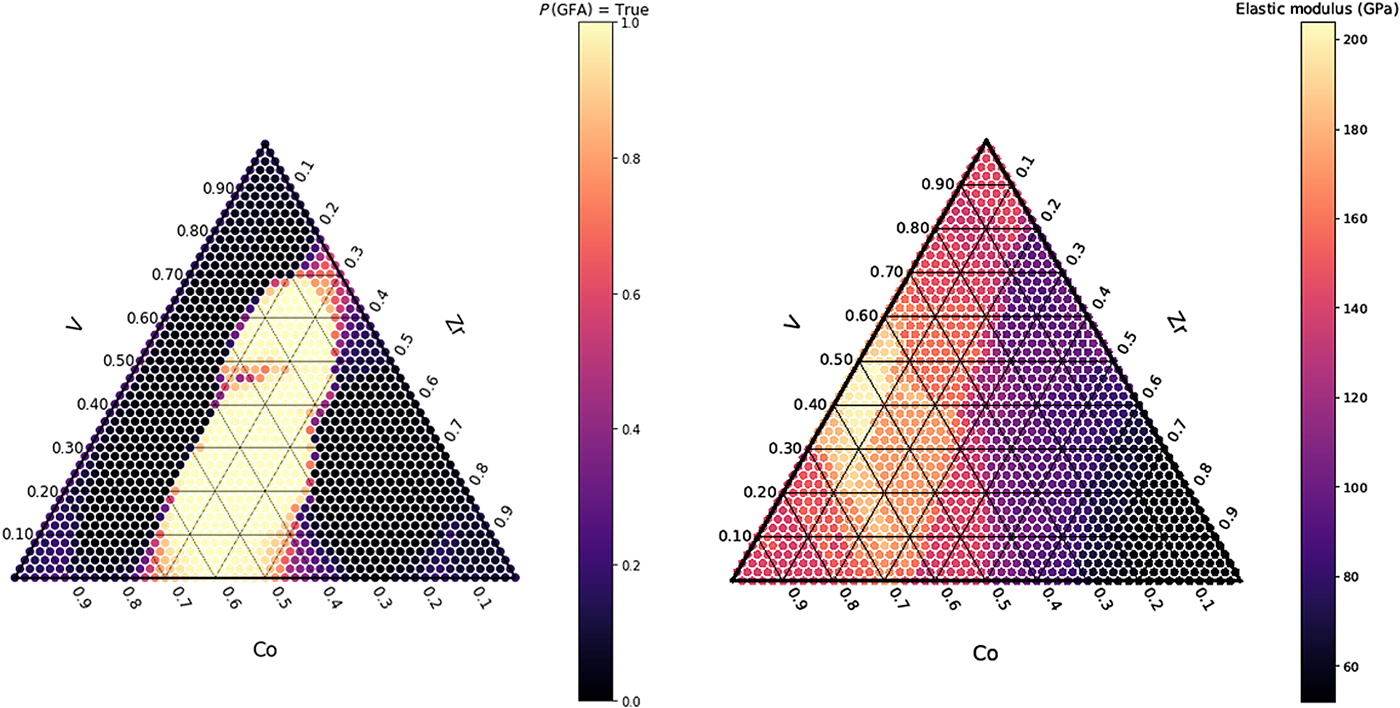
A recent example illustrated the power of combining HTE with ML models by demonstrating a nearly 1000× acceleration in the rate of the discovery of novel amorphous alloys.[Reference Ren, Ward, Williams, Laws, Wolverton, Hattrick-Simpers and Mehta132] Amorphous alloys are a particularly apt system to be predicted by ML, as traditional computational approaches like DFT are not particularly effective. From this study several interesting new phenomena were observed. The most notable of which was that the formation of amorphous alloys via physical vapor deposition was more strongly correlated with the presence of complex ordered intermetallic structures than on the traditional presence of deep eutectics. Moreover, the predictions of stability can be coupled with predictions of physical properties (e.g., modulus) and can then be used to guide the discovery of novel high modulus metallic glasses as in Fig. 2.
Illustrating the glass-forming ability of a novel Co-V-Zr alloy (left) and its predicted elastic modulus (right).
More recently, the pairing of supervised learning with active learning[Reference Yuan, Liu, Balachandran, Xue, Zhou, Ding, Sun, Xue and Lookman133–Reference Lookman, Balachandran, Xue and Yuan137]—the ML implementation of optimal experiment design—has been used to address the dual challenges of hypothesis generation and testing. First, a supervised learning method is selected, one that provides uncertainty quantification along with prediction estimates. The output estimate and uncertainty are then exploited by active learning to identify the next experiment to perform that will most rapidly optimize a given objective, e.g., hone in on a material that maximizes or minimizes a functional property. Bayesian optimization, the subset of active learning methods focused on local function optimization, has been used by a number of groups to accelerate the discovery of advanced materials. In these projects, ML identifies the material synthesis and fabrication parameter values to investigate next. These values are then used to guide experimentalists in the synthesis and characterization, and the resulting data is fed back into the ML model to select the subsequent experiment. Accelerated materials discovery has been demonstrated for low thermal hysteresis shape memory alloys,[Reference Xue, Balachandran, Hogden, Theiler, Xue and Lookman87] piezoelectrics with high piezoelectric coupling coefficients,[Reference Yuan, Liu, Balachandran, Xue, Zhou, Ding, Sun, Xue and Lookman133] and high-temperature superconductors.[Reference Meredig, Antono, Church, Hutchinson, Ling, Paradiso, Blaiszik, Foster, Gibbons and Hattrick-Simpers138]
Advising systems were the stepping stone to the next level of HTE—autonomous systems,[Reference King, Rowland, Aubrey, Liakata, Markham, Soldatova, Whelan, Clare, Young and Sparkes139] where ML is placed in control of the full experiment cycle through direct interfacing with material synthesis and characterization tools. Rather than using a pre-defined grid over which to explore, it would be beneficial to explore the materials space in a more informed manner. Autonomous systems hold great potential, not just in accelerating the experimental cycle by reducing laborious tasks, but also by potentially reducing the amount of prior knowledge and expertise required in synthesis, characterization, and data analysis. Autonomous Research System is such a system, capable of optimizing carbon nanotube growth parameters.[Reference Nikolaev, Hooper, Webber, Rao, Decker, Krein, Poleski, Barto and Maruyama140] ChemOS is another such system, capable of exploring chemical mixtures to achieve a desired optical spectra.[Reference Roch, Häse, Kreisbeck, Tamayo-Mendoza, Yunker, Hein and Aspuru-Guzik141] These systems seek to find the material which optimizes some given properties—a challenge of local optimization. Autonomous systems can also be used for global optimization challenges, e.g., to maximize knowledge gained from a sequence of experiments, as demonstrated by a set of systems capable of autonomous determination of non-equilibrium phase maps across composition and temperature space.[Reference DeCost and Kusne142,Reference Kusne, DeCost, Hattrick-Simpers and Takeuchi143] A similar fusion in chemistry may be the merging of chemical robotics systems[Reference Caramelli, Salley, Henson, Camarasa, Sharabi, Keenan and Cronin144] with reaction network models such as CHematica.[Reference Klucznik, Mikulak-Klucznik, McCormack, Lima, Szymkuć, Bhowmick, Molga, Zhou, Rickershauser and Gajewska145]
Significant challenges remain before autonomous systems become commonplace. One key challenge is the integration of uncertainty from data collection through ML predictions and experiment design. Additionally, many application areas have a wealth of knowledge stored in the literature which can be exploited to accelerate materials exploration and optimization. Extracting this knowledge and making it searchable is another key challenge. Furthermore, researchers are investigating methods for incorporating prior knowledge of materials physics into ML frameworks to ensure that predictions are physically realizable. Physical research systems are also susceptible to multiple modes of failure resulting in anomalous data. Anomaly detection and mitigation are thus also required. Integration of physical synthesis and characterization instruments into autonomous platforms are currently restricted by disparate communication protocols and a lack of scriptable interfaces. Accordingly, there is also a need for a data and software platform capable of managing and incorporating diverse data types and communication protocols.
Local structure libraries and functional imaging
The combinatorial libraries above allow rapid scanning of the compositional space. However, for many materials of interest, responses are highly inhomogeneous, for example in materials such as manganites, filamentary superconductors, relaxor ferroelectrics, and multiferroic oxides. Due to strong correlations and competing orders, the local atomic and mesoscopic structures, distribution and type of defects, and their dynamics are all critically linked to the functionality of these disordered materials. Furthermore, for progress to be made on both understanding the driving forces for their functions, as well as to optimize them for applications, libraries of local atomic-scale structures and ordering are required to complement the macroscopic libraries generated through traditional HTE. It should be noted that local imaging studies can provide more evidence for the structure–property relationships that are of importance. Below, we review some advances in how libraries of atomic-scale defects can be generated using a DL approach,[Reference Kalinin, Sumpter and Archibald24] as well as advances in functional imaging that enable high-throughput local characterization.
Libraries of local structures
Perhaps, the most important and least available (at this point) libraries are of atomic-scale structures (configurations) and defects, even in commonly studied materials such as graphene or other 2D materials. This is in comparison to, for instance, libraries of microstructures of alloys, which have been available for years.[146] From the statistical physics perspective, access to these microstates should, in principle, enable predictions to be made of the system's properties as the thermodynamic conditions are varied. Practically, atomic-scale imaging has only become widespread and near routine over the past decade, due in large part due to the proliferation of aberration-corrected scanning transmission electron microscopy. Nonetheless, even if atomic-scale images are acquired, it is still difficult to manually identify the atomic configurations and classify the types of defects. Indeed, most of the existing “classical” methods of analyzing microscopy data are slow, inefficient, and require frequent manual input. Recently, it was demonstrated that deep neural networks[Reference LeCun, Bengio and Hinton14] (also known as DL) can be trained to perform fast and automated identification of atomic/molecular type and position as well as to spot point-like structural irregularities (atomic defects) in the lattice in static and dynamic scanning transmission electron and scanning tunneling microscopy (STEM and STM) data with varying levels of noise.[Reference Madsen, Liu, Kling, Wagner, Hansen, Winther and Schiøtz33,Reference Ziatdinov, Dyck, Maksov, Li, Sang, Xiao, Unocic, Vasudevan, Jesse and Kalinin147,Reference Ziatdinov, Maksov and Kalinin148] The DL approach, and, more generally, ML, allows one to generalize from the available labeled images (training set) to make accurate image-level and/or pixel level classification of previously unseen data samples. The training data may come from theoretical simulations, such as a Multislice algorithm[Reference Barthel149] for electron microscopy or from a (semi-)manual labelling of experimental images by or under supervision of domain experts.
Fully convolutional neural networks (FCNN),[Reference Long, Shelhamer and Darrell150] which are trained to output a pixel-wise classification maps showing a probability of each pixel in the input image belonging to a certain type of atom and/or atomic defect were shown to be well suited for the analysis of atomically resolved experimental images. Ziatdinov et al.[Reference Ziatdinov, Dyck, Maksov, Li, Sang, Xiao, Unocic, Vasudevan, Jesse and Kalinin147] demonstrated that FCNN trained on simulated STEM data of graphene can accurately identify atoms and certain atomic defects in noisy experimental STEM data from a graphene monolayer, including identification of atoms in the regions of the lattice with topological reconstructions that were not a part of the training set. Indeed, these models are eminently transferable. For example, a model based on graphene can perform well on other 2D materials with a similar structure, usually without any need for further training. This is particularly important when generating libraries, as continual model training on every system would impede rapid progress.
Furthermore, for the quasi-2D atomic systems, the FCNN output can be mapped onto a graph representing the classical chemical bonding picture, which allows making a transition from classification based on image pixels to classification based on specific chemistry parameters of atomic defects such as bond lengths and bond angles. In such a graph representation, the graph nodes represent the FCNN-predicted atoms of different type, while the graph edges represent bonds between atoms and are constructed using known chemistry constraints, including maximum and minimum allowed bond length between the corresponding pairs of atoms. This FCNN-graphs approach was applied to the analysis of experimental STEM data from a monolayer graphene with Si impurities allowing construction of a library of Si-C atomic defect complexes.[Reference Ziatdinov, Dyck, Sumpter, Jesse, Vasudevan and Kalinin151] The FCNNs can also aid studies of solid-state reactions on the atomic level observed in dynamic STEM experiments.[Reference Maksov, Dyck, Wang, Xiao, Geohegan, Sumpter, Vasudevan, Jesse, Kalinin and Ziatdinov152] In this case, an FCNN is used in combination with a Gaussian mixture model to extract atomic coordinates and trajectories, and to create a library of the structural descriptors from noisy experimental STEM movies. The associated transition probabilities are then analyzed via a Markov approach to gain insight into the atomistic mechanisms of beam-induced transformations. This was demonstrated for transition probabilities associated with coupling between Mo substitutions and S vacancies in WS2 [Reference Maksov, Dyck, Wang, Xiao, Geohegan, Sumpter, Vasudevan, Jesse, Kalinin and Ziatdinov152] and between different Si-C configurations at the edge and in the bulk of graphene.[Reference Ziatdinov, Dyck, Jesse and Kalinin153]
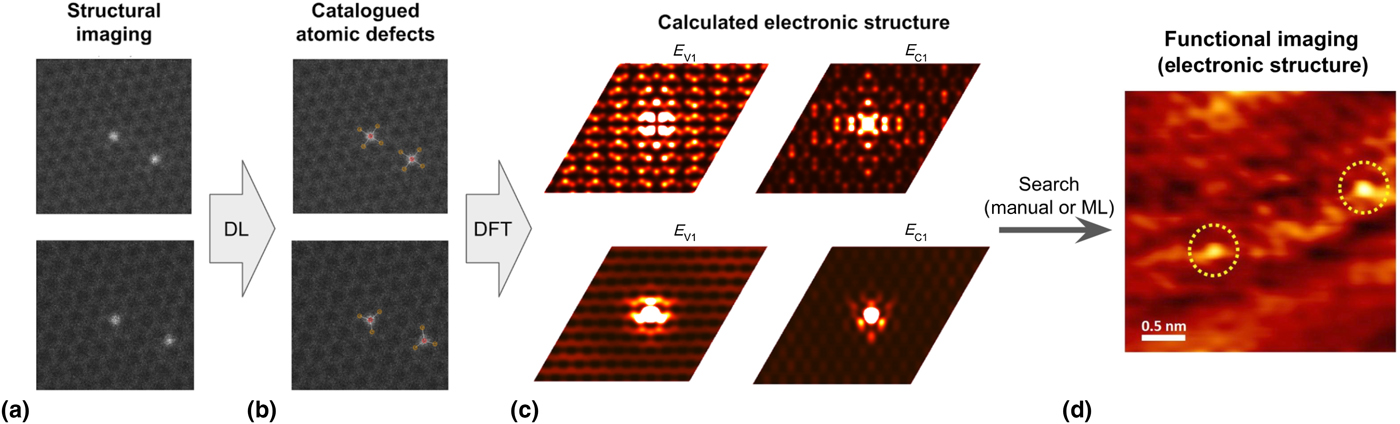
While learning the structural properties of atomic defects in materials at the atomic scale is important by itself, it is also critical to understand how the observed structural peculiarities affect electronic and magnetic functionalities at the nanoscale. From the experimental point of view, this requires us to be able to perform both structural (STEM) and functional imaging (STM in the case of electronic properties) on the same sample. Then the goal is to identify the same atomic structures and defects from STEM and STM experiments and to correlate the observed structural properties to measured electronic properties, namely, local density of electronic states at/around the structure of interests. This was recently demonstrated[Reference Ziatdinov, Dyck, Sumpter, Jesse, Vasudevan and Kalinin151] via a combined experimental–theoretical approach, where the atomic defects identified via DL in STEM structural imaging on graphene with Si dopants were then identified by their DFT-calculated electronic fingerprints in the STM measurements of local electronic density of states on the same sample. This work, summarized in Fig. 3, shows a realistic path toward the creation of comprehensive libraries of structure–property relationships of atomic defects based on experimental observations from multiple atomically resolved probes. Such libraries can significantly aid the future theoretical calculations by confining the region of the chemical space that needed to be explored, i.e., by focusing the effort on the experimentally observed atomic defect structures instead of all those that are possible in principle.
Creating local imaging libraries. (a) STEM imaging of Si impurities in graphene monolayer. (b) Categorization of defects in (a) based on the number/type of chemical species in their first coordination sphere via a DL-based approach. (c) The extracted 2D atomic coordinates of these defects are then used as an input into DFT calculations to obtain a fully relaxed 3D structure and calculate electronic properties (in this case, the local density of electronic states for the bands below (E V) and above (E C) the Fermi level). (d) The DFT-calculated data can be then used to search for the specific type of defects in the STM data from the same sample, which measures the local density of states. The search can be performed manually (if the number of STM images is small) or automatically by training a new ML classifier for categorizing the STM data. Image adapted from Ziatdinov et al.[Reference Ziatdinov, Dyck, Sumpter, Jesse, Vasudevan and Kalinin151]

The current challenges include improvement of infrastructure for cross-platform measurements (sample transfer, automated location of the same nanoscale regions on different platforms) as well as absence of a standard data format for storing and processing these libraries, which is accepted and used by the entire community. There is also the need to collate data across existing platforms, and thus searchability to find the relevant data is another major issue that will need to be addressed.
Functional libraries facilitated with rapid functional imaging
A similar argument can be made for the need for functional property libraries derived from local measurements. Due to the varying local structure in disordered materials, this requires the mesoscopic functionalities to be mapped across the sample, which then facilitates learning the microstructural features that are associated with the observed response. Multiple examples of the imaging techniques that can be applied for these applications are versions of scanning probe microscopy (SPM) for mapping elastic and electromechanical properties,[Reference Yablon, Gannepalli, Proksch, Killgore, Hurley, Grabowski and Tsou154] chemical imaging via microRaman[Reference Schlücker, Schaeberle, Huffman and Levin155] and time of flight secondary ion mass spectroscopy,[Reference Ievlev, Maksymovych, Trassin, Seidel, Ramesh, Kalinin and Ovchinnikova156] and nano x-ray methods.[Reference Hruszkewycz, Folkman, Highland, Holt, Baek, Streiffer, Baldo, Eom and Fuoss157,Reference Cai, Lai, Xiao and Xu158] Critical for these applications becomes the issues of physics-based data curation, i.e., the transition from the measured microscope signal to material-specific information. In certain techniques such as piezoresponse force microscopy (PFM), the measured signal is fundamentally quantitative, and with the proper calibrating of the measurement signal can be used as a material-specific descriptor.[Reference Kalinin, Karapetian and Kachanov159,Reference Eliseev, Kalinin, Jesse, Bravina and Morozovska160] In other techniques such as SPM-based elastic measurements or STM, the measured signal is a linear or non-linear convolution of the probe and material's properties, and quantification of materials' behaviors represents a significantly more complex problem.[Reference Monig, Todorovic, Baykara, Schwendemann, Rodrigo, Altman, Perez and Schwarz161] Similarly of interest is the combination of information from multiple sources, realized in multimodal imaging. Here, once the data is converted from microscope-dependent to material dependent, and multiple information sources are spatially aligned, the joint data sets can be mined to extract structure–property relationships.[Reference Ievlev, Susner, McGuire, Maksymovych and Kalinin162–Reference Kim, Strelcov, Hwang, Choi, Park, Jesse and Kalinin164]
However, performing experiments is time and labor-intensive, and more automated methods of exploring the space and recognizing important areas (such as extended defects or domain junctions) are necessary. For reducing the labor-intensive portion, ML has been shown to be of substantial utility. For instance, in SPM, an ML-utilizing workflow for a bacterial classification task was originally proposed by Nikiforov et al.[Reference Nikiforov, Reukov, Thompson, Vertegel, Guo, Kalinin and Jesse4] There, the authors used the measured PFM signal and trained a neural network to enable automatic recognition of bacteria classes, as distinguished by their electromechanical (i.e., PFM) response. Beyond simple classification tasks, the ML methods in SPM have also been useful to extract fitting parameters from noisy hysteresis loop data,[Reference Ovchinnikov, Jesse, Bintacchit, Trolier-McKinstry and Kalinin165] to enable better functional fits,[Reference Borodinov, Neumayer, Kalinin, Ovchinnikova, Vasudevan and Jesse166] and for phase diagram generation.[Reference Pradhan, Kumari, Strelcov, Pradhan, Katiyar, Kalinin, Laanait and Vasudevan167,Reference Li, Yang, Zhang, Ye, Jesse, Kalinin and Vasudevan168] These tools greatly reduce the labor component of acquiring functional imaging, although much work remains.
Still, despite the increasing speed and utility of ML methods in this space, much of the local functional property measurements are inherently time-intensive. For example, traditional spectroscopic methods in SPM, even for seemingly straightforward properties such as the local electrical resistance R(V) where V is the applied voltage to the probe or the electric-field induced strain S(E) where E is the applied electric field, can take several hours to acquire with conventional atomic force microscopy methods. How can one gain efficiency in this step? One method is to instead collect low-resolution datasets and attempt to reconstruct the high-resolution version with data-fusion methods.[Reference Shah, Younan and King169] Recently, large efficiency gains were made via the use of the so-called “General mode” (G-Mode) platform[Reference Somnath, Belianinov, Kalinin and Jesse170] in a range of functional imaging by SPM methods. The success of this approach lies largely in the simplicity. The G-mode platform is built on the foundation of complete data acquisition from available sensors, filtering the data via ML or statistical methods, and subsequent analysis to extract the relevant material parameters. It has since been applied to a raft of SPM modes including current–voltage (I–V) curve acquisition,[Reference Somnath, Law, Morozovska, Maksymovych, Kim, Lu, Alexe, Archibald, Kalinin and Jesse171] PFM[Reference Somnath, Belianinov, Kalinin and Jesse170] and spectroscopy,[Reference Somnath, Belianinov, Kalinin and Jesse172] and Kelvin Probe force microscopy.[Reference Collins, Belianinov, Somnath, Balke, Kalinin and Jesse173]
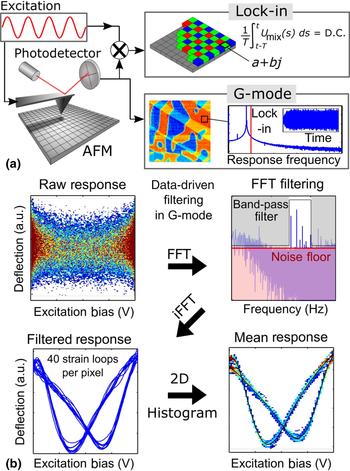
Consider also the acquisition of local hysteresis loops in ferroelectric materials, typically accomplished via piezoresponse force spectroscopy. Fundamental ferroelectric switching is extremely fast (≈ GHz), and photodetectors can easily operate at ≈4–10 MHz, but heterodyne detection methods average data over time, leading to captures at much lower rates, and typically acquiring one hysteresis loop per second. The reason is that detection and excitation are decoupled, and each excitation is followed by a long (few ms) wave packet for the detection. This problem can be circumvented by using a dynamic mode, where the deflection of the cantilever is continually monitored and stored as a large excitation is applied at a rapid rate (e.g., 10 kHz) to the tip (see Fig. 4(a)). If the voltage applied locally exceeds the local coercive voltage of the ferroelectric material, then polarization switching occurs, leading to switching at the excitation frequency. Reconstruction of the signal via signal filtering methods enables generation of the hysteresis loop, as shown in Fig. 4(b). This technique enables acquisition of hysteresis loops while scanning and ultimately, in a ~1000× increase in throughput, in addition to providing much more statistics on the process.
(a) General-mode acquisition (G-mode) differs from a standard measurement, in that the raw data is stored without pre-processing such as use of a lock-in amplifier. (b) The raw response of the cantilever deflection signal is Fourier transformed and processed using a band-pass filter and a user-defined noise floor threshold. The cleaned data is then transformed back to the time domain to reconstruct the hysteresis loops. Since many hysteresis loops are captured, the data is better represented as a 2D histogram (bottom right). This enables rapid mapping of relevant material parameters, such as the coercive voltage. This can, in principle, be stored along with global (macroscopic) characterization to populate libraries of materials behavior. Figure is adapted from Somnath et al.[Reference Somnath, Belianinov, Kalinin and Jesse172]

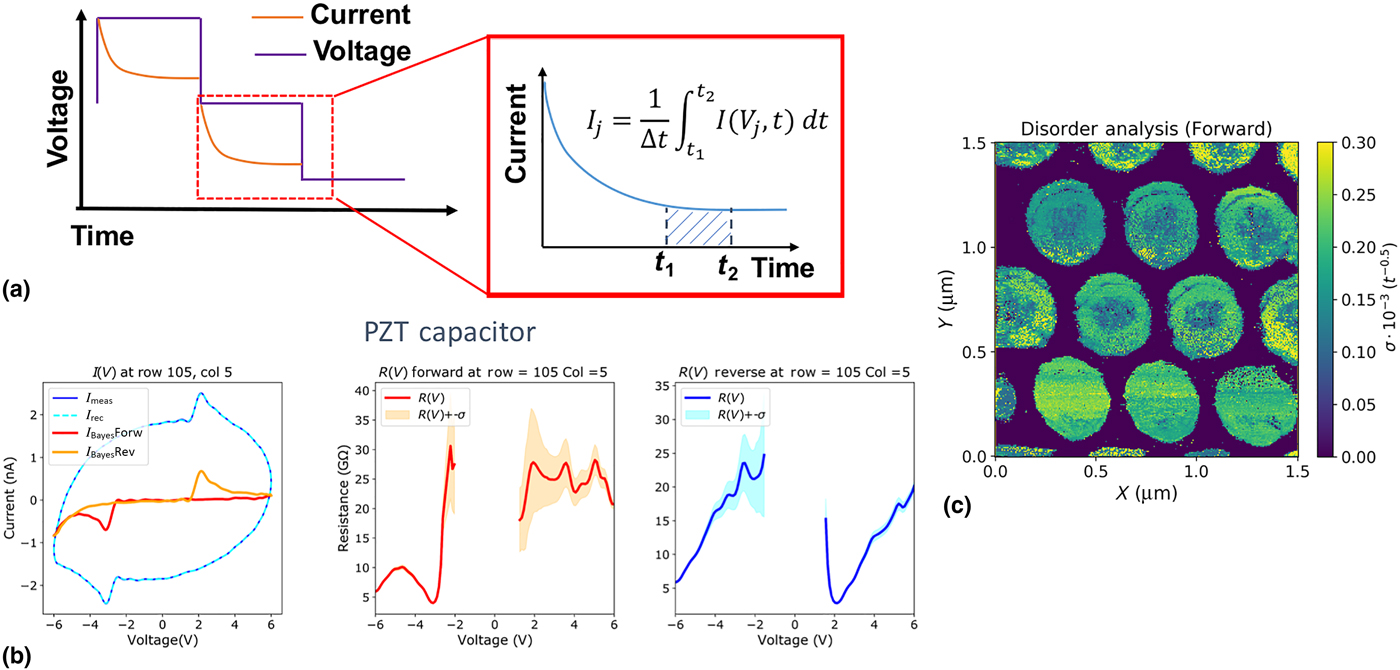
As another point, consider the situation for obtaining the resistance R(V) spectra from a single point on a sample in typical STM or atomic force microscopy. Traditionally, the waveform applied to the tip (or sample) is stepped, and a delay time is added after each step to minimize the parasitic capacitance contribution to the measured current. This scheme is shown in Fig. 5(a). This is remarkably effective, but also dramatically limits the acquisition speed to ≈1–2 curves per second for realistic instrument bias waveforms. However, current amplifiers that are used can operate at several kHz without hindrance, suggesting that the fundamental limits lie much higher. Indeed, if one captures an I–V curve by applying a sine wave at several hundred Hz (and measures the raw current from the amplifier at the full bandwidth), it is possible to obtain I–V traces that, although beset with a capacitance contribution, still contain the relevant information. Given that the circuit can be modeled, Bayesian inference can then be used to determine the capacitance contribution and provide the reconstructed resistance curves as a function of voltage, with uncertainty as shown in Fig. 5(b). The reconstructed traces can then be analyzed further, for example to gauge the disorder in the polarization switching within each capacitor (as in Fig. 5(c)), or to analyze the local capacitance contribution. The advantage of this method is not only that it enables functional imaging of electrical properties at hundreds of times the current state of the art; but it also allows to do so with greater spectral and spatial resolution.
G-IV for rapid mapping of local electronic conductance. (a) Typical I–V measurements on SPM platforms utilize a regimen where after the voltage is stepped to the new value, a delay time is introduced before the current is averaged, as shown in the inset. On the other hand, the G-IV mode utilizes sinusoidal excitation at high frequency (200 Hz in this case), with results shown for a single point on a ferroelectric PbZr0.2Ti0.8O3 nanocapacitor in (b). The raw current (I meas), the reconstructed current (I rec) given the resistance–capacitance circuit model, and the inferred current without the capacitance contribution (I Bayes) are plotted. This method also allows the uncertainty in the inferred resistance traces to be determined, as shown in the respective plots of R(V) with the standard deviation shaded. White space indicates areas where the resistance is too high to be accurately determined. Reconstructing the current after the measurement can facilitate rapid mapping of switching disorder in the nanocapacitors, with the computed parameter for disorder mapped in (c). Figure is adapted from Somnath et al.[Reference Somnath, Law, Morozovska, Maksymovych, Kim, Lu, Alexe, Archibald, Kalinin and Jesse171]

Reiterating, the idea in these experiments is to produce libraries of functionality that can be used synergistically with libraries of the atomic or mesoscopic structures. One can imagine, for example, libraries of defects in 2D materials with corresponding functional property mapping of the opto-electronic properties of the same materials. The challenge is that many of the techniques for functionality mapping with scanning probe are also not necessarily amenable to high speed and require substantial calibration efforts (e.g., to obtain quantitative maps of the converse piezoelectric coefficient[Reference Balke, Jesse, Yu, Carmichael, Kalinin and Tselev174]), but those need either advances in instrumentation[Reference Labuda and Proksch175] or automated characterization systems, if large-scale libraries with local functional properties are to be built.
Another major challenge which arises in the formation of these libraries is the choice of format. This is a major topic that is not a portion of this prospective, but which is undoubtedly important and needs mentioning. We envision that the most likely scenario is multiple databases specialized around the specific type of data being housed, e.g., theory calculations, crystallography, mechanical properties, imaging studies, and so forth. Regardless, in all cases we note that it is important to have open, well-documented, and standardized data models, to enable better integration.
From libraries to integrated knowledge
Integration of the experiments and simulations across scales is obviously not a simple endeavor, and no universal solution is likely. Numerous efforts have been made in this regard, including for example the very extensive work on microstructural modeling and optimization,[Reference Kalidindi and De Graef176–Reference Kalidindi, Niezgoda and Salem178] as well as efforts to combine theory and experiment to rationally design new polymers with specific functional properties.[Reference Sharma, Wang, Lorenzini, Ma, Zhu, Sinkovits, Pilania, Oganov, Kumar, Sotzing, Boggs and Ramprasad179] One can also combine information from multiple sources within a Bayesian framework, to guide experimental design and reduce the time (number of experimental or simulation iterations) to arrive at an optimal result (under uncertainty).[Reference Bassman, Rajak, Kalia, Nakano, Sha, Sun, Singh, Aykol, Huck and Persson134,Reference Talapatra, Boluki, Duong, Qian, Dougherty and Arróyave136,Reference Gopakumar, Balachandran, Xue, Gubernatis and Lookman180] These methods typically use some objectives based on a desired property of interest. Methods such as transfer learning[Reference Hutchinson, Antono, Gibbons, Paradiso, Ling and Meredig181] can be useful to combine computational and experimental data, when the data is scarce. Similarly, augmentation can be a useful strategy, as has recently been show for x-ray datasets.[Reference Oviedo, Ren, Sun, Settens, Liu, Hartono, Ramasamy, DeCost, Tian, Romano, Gilad Kusne and Buonassisi182]
There is also an alternative view, which is to consider that structure defines all properties, and that imaging and macroscopic experiments can be combined to constrain generative models based on statistical physics. The key to this pathway lies in theory-experiment matching, which should be done in a way that respects the local statistical fluctuations, which contain information about the system's response to external perturbations. Recently, we have formulated a statistical distance framework that enables this task.[Reference Vlcek, Ziatdinov, Maksov, Tselev, Baddorf, Kalinin and Vasudevan183–Reference Vlcek, Maksov, Pan, Vasudevan and Kalinin185] The optimization drives the model to produce data statistically indistinguishable from the experiment, taking into account the inherent sampling uncertainty. The resulting model then allows predicting behavior beyond the measured thermodynamic conditions.
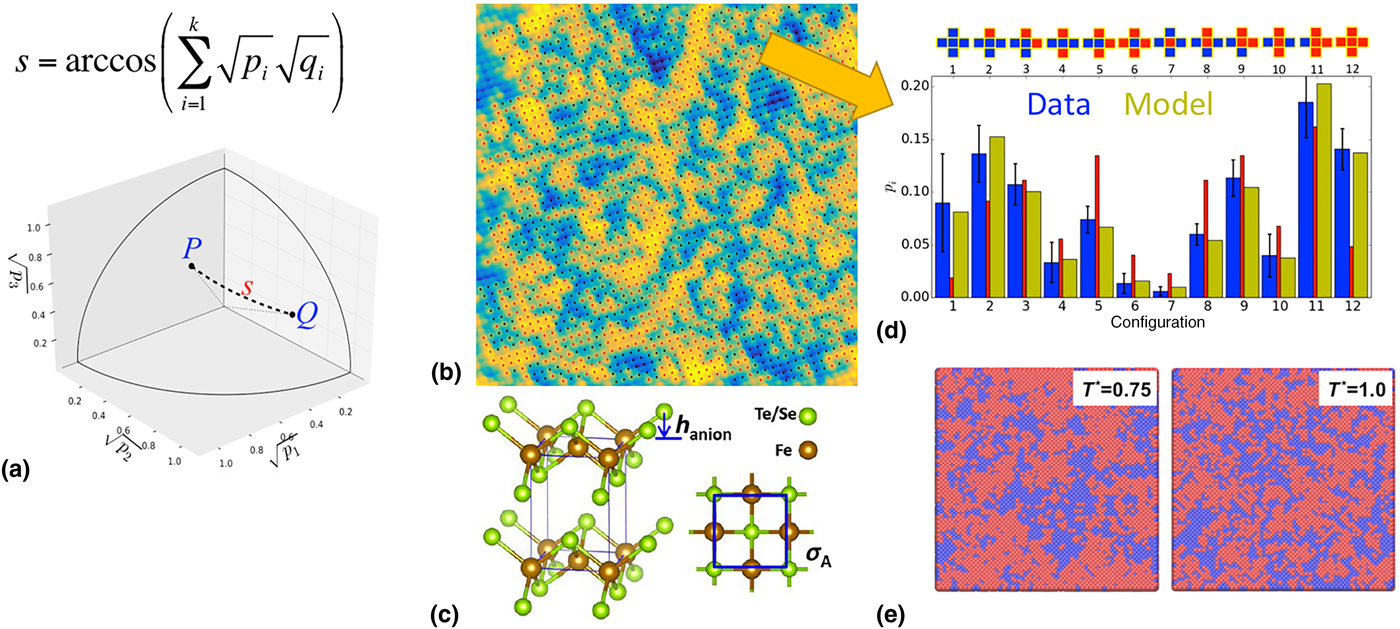
For example, consider a material of a certain composition that has been characterized macroscopically, so that its composition and crystal structure are known. If atomically resolved imaging data is available, then the next step becomes to identify the atomic configurations present, i.e., practically the position and chemical identity of the surface atoms. Chemical identification of atomic elements in STM images can be complicated, but first principles calculations can help guide the classification. Deep convolutional neural networks trained on simulated images from the DFT can then be run on the experimentally observed images to perform the automated atomic identification. From here, local crystallography[Reference Belianinov, He, Kravchenko, Jesse, Borisevich and Kalinin186] tools can be used to map the local distortions present, and to determine the configurations of nearest and next-nearest neighbors (and higher if need be) of each atom in the image, to produce an atomic configurations histogram. This can then be used to constrain a simple statistical mechanical model (e.g., lattice model) with easily interpretable parameters in the form of effective interaction energies (note this can also be guided by first principles theory). The histograms produced from experiment and theory can be computed and the model can be optimized via minimization of the statistical distance (see Fig. 6(a)) between the histograms. As an example, this concept has recently been used to explore phase separation in an FeSe0.45Te0.55 superconductor, for which atomically resolved imaging was available. The image is shown in Fig. 6(b), with red (Te) and blue (Se) atoms determined via a threshold that would preserve the nominal composition of the sample. A simple lattice model that considered the interactions between the Te and Se atoms was set up and optimized based on the statistical distance minimization approach. As can be seen in the histograms of atomic configurations in Fig. 6(d), the model closely matches the observed statistics from the experiment. This optimized model can then be used to sample configurations at different temperatures, as shown in Fig. 6(e).
Statistical distance framework. (a) Statistical distance between a model P and a target Q is defined as a distance in probability space of the local configurations. This metric enables the estimation of the ability to distinguish samples arising from thermodynamic systems (under equilibrium considerations). (b) STM image of FeSe0.45Te0.55 system with Se atoms (dark contrast) and Te atoms (bright contrast). The structure of the unit cell is shown in (c). (d) Atomic configurations histogram from both the data and the optimized model in blue and teal colors, as well as from a model that has no interactions (i.e., is random) plotted in red. Once the generative model is optimized, it can be run sampled for different temperatures, as in (e). Note that reduced T units are utilized. Reprinted (adapted) with permission from Vlcek et al.[Reference Vlcek, Maksov, Pan, Vasudevan and Kalinin185] Copyright (2017) American Chemical Society.

It is important here to highlight the key points of this approach. The main idea is that by knowing the atomic configurations, we can learn the underpinning physics as these configurations present a detailed probe into the system's partition function. This can be compared with e.g., time-based spectroscopies, where observations of fluctuations enable mapping the full potential energy surface, as has been done for biomolecules.[Reference Ross, Strychalski, Jarzynski and Stavis187] Here, instead of dealing with fluctuations in time, we observe the spatial fluctuations that are quenched within the solid. At the same time, given that the models are physics-based, they are generalizable and should be predictive, thus enabling extrapolation rather than simply interpolation. This may be especially useful for systems where the order parameter is not easily defined, such as relaxors,[Reference Kutnjak, Petzelt and Blinc188] where the goal would be to determine how the statistics of atomic configurations (in particular, the relevant distortions) evolve through phase transitions. The combination of local structure and functional information, macroscopic characterization, and first principles theory can therefore be used within this framework to integrate our knowledge and build predictive models that can guide materials discovery and experimental design.
Challenges remain in the areas of uncertainty quantification (how reliable are the predictions as the thermodynamic conditions diverge from those in experiment), as well as how best to choose the appropriate complexity of the model. Moreover, there are challenges associated with non-equilibrium systems that need to be addressed. Practically, there is also much difficulty in actually determining where to retrieve the necessary data, given that it is likely to be strewn across multiple databases. Ideally, these models could be incorporated at the experimental site (e.g., at the microscope) for enabling real-time predictions of sample properties, and guiding the experimenter to maximize information gain, thereby creating efficiencies, whilst automatically adding to the available library. However, this is still a work in progress.
Community response
Finally, it is worth mentioning that the vision laid out in this prospective requires efforts of individuals, groups, and the wider materials community to be successful. Whilst in principle this is no different to the incremental, community-driven progress that has characterized modern science in decades past, there are distinct challenges that deserve attention. One aspect is the sharing of codes and datasets through online repositories, which should be encouraged. Creating curated datasets and well-documented codes takes time, and this should be recognized via appropriate incentives. Sharing codes can be done via use of tools such as Jupyter notebooks run on the cloud. Ensuring that data formats within individual laboratories and organizations are open, documented, and standardized requires much work, but pays off in terms of efficiency gains in the long term. Toward this aim, a subset of the authors has created the universal spectral imaging data model (USID[Reference Somnath, Smith, Laanait, Vasudevan, Ievlev, Belianinov, Lupini, Shankar, Kalinin and Jesse189]), while the crystallography community is well versed with the Crystallographic Information File (CIF) format.[Reference Hall, Allen and Brown190] Logging the correct meta-data with each experiment is critical, and lab notebooks can be digitized to enable searchability and indexing. Perhaps most importantly, teaching and educating the next generation of scientists to be well versed in data, in addition to ML, is essential.
Outlook
The methods outlined in this prospective offer the potential to accelerate materials development via an integrated approach combining HT computation and experimentation, imaging libraries, and statistical physics-based modeling. In the future, autonomous systems that can utilize this knowledge and perform on the fly optimization (e.g., using reinforcement learning) may become feasible. This would result in ever increasing sizes of the libraries, but also more efficient search and optimization. But perhaps less acknowledged is that given the large libraries that are expected to be built, the chance to learn causal laws[Reference Pearl191] from this data becomes a reality. Indeed, this is likely to be easier in the case of physics or materials science than in other domains due to the availability of models. In all cases, the availability of such databases and coupling with theoretical and ML methods offers the potential to substantially alter how materials science is approached.
Acknowledgments
The work was supported by the U.S. Department of Energy, Office of Science, Materials Sciences and Engineering Division (R.K.V. and S.V.K.). A portion of this research was conducted at and supported (M.Z.) by the Center for Nanophase Materials Sciences, which is a US DOE Office of Science User Facility.