INTRODUCTION
The summer pumpkin (Cucurbita pepo L. ssp. pepo; Jeffrey Reference Jeffrey, Knüpffer and Ochsmann2003) is an herbaceous, annual plant of the Cucurbitaceae family with big fruits and oily seeds (Trease & Evans Reference Trease and Evans1983; Belitz & Grosch Reference Belitz and Grosch1987; Bombardelli & Morazzoni Reference Bombardelli and Morazzoni1997; Fruhwirth & Hermetter Reference Fruhwirth and Hermetter2007). Pumpkin seeds are roasted and eaten or pressed for oil. In addition to the dietary use, the therapeutic efficiency in patients suffering from benign prostatic hyperplasia has been demonstrated in a clinical study (Schiebel-Schlosser & Friederich Reference Schiebel-Schlosser and Friederich1998). It has previously been shown that pumpkin seeds from selenium-enriched plants are appropriate to improve the nutritional status of selenium in humans (Germ et al. Reference Germ, Kreft and Osvald2005; Smrkolj et al. Reference Smrkolj, Stibilj, Kreft and Kapolna2005).
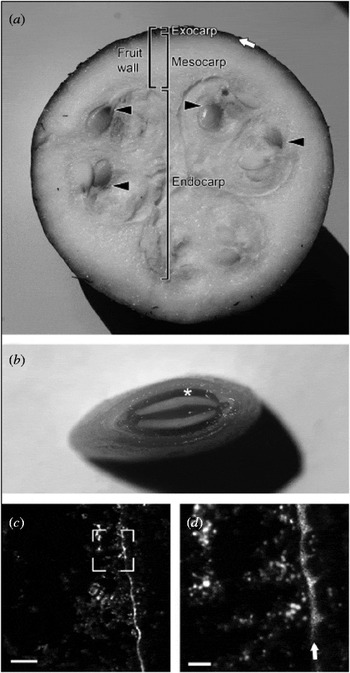
In Central Europe, pumpkin seeds are used to press edible oil. It has been recently shown that, due to the specific absorbance spectrum, the pumpkin seed oil is dichromatic; it appears green in thin layers and red in thick layers (Kreft & Kreft Reference Kreft and Kreft2007, Reference Kreft and Kreft2009). The colour comes from protochlorophyll, which derives from the testa of the pumpkin seed (Böddi et al. Reference Böddi, Láng and Soós1979; Mukaida et al. Reference Mukaida, Kawai, Onoue and Nishikawa1993; Kreft et al. Reference Kreft, Zorec, Janeš and Kreft2009). The protochlorophyll pigment is in the green layer (chlorenchyma) of the seed testa (Fig. 1) (Zraidi et al. Reference Zraidi, Pachner and Lelley2003; Kreft et al. Reference Kreft, Zorec, Janeš and Kreft2009).
Cross-section of the pumpkin fruit and the seed. The untreated fruit (diameter: 10 mm) was cut open to measure the fluorescence activity. (a) Green pigments are distributed in the pericarp periphery (white arrow). Seeds are partially showing green pigments (black arrowheads). (b) A cross-section of the pumpkin seed. Cotyledons are white, testa has stratified green appearance. Chlorenchyma (marked by white asterisk) is dark green, whereas outer layers are yellow–green. (c) Auto-fluorescent image of chromoplasts (red, 1·0–1·4 μm in diameter) in fresh pumpkin seed imaged by a confocal microscope. Panel (d) is a magnified view (scale bar: 10 μm) of the section marked by a box in (c) (scale bar: 50 μm). White arrow in (d) shows green auto-fluorescence of cell walls of hypodermis.

To date, no attempt has been made to elucidate the physiological role of the protochlorophyll in the pumpkin seed testa; however, the function of chlorophyll and related pigments in the seeds of various other species has been investigated. The total chlorophyll content of the seed coat decreased during development in carrot (Daucus carota L.) (Steckel et al. Reference Steckel, Gray and Rowse1989), in seeds of oilseed rape (Brassica napus L.) and in turnip rape (Brassica rapa L.) seeds (Ward et al. Reference Ward, Scarth, McVetty and Daun1992, Reference Ward, Scarth, Vessey and Daun1995). It has been found that chlorophyll is broken down during the late stages of the ripening process (Ward et al. Reference Ward, Scarth, Vessey and Daun1995). Chlorophyll fluorescence is used to measure the ripeness of individual seeds of cabbage (Brassica oleracea L.; Jalink et al. Reference Jalink, Frandas, Van Der Schoor and Bino1998). Interestingly, the protochlorophyll content remains high in ripe pumpkin seeds (Kreft et al. Reference Kreft, Zorec, Janeš and Kreft2009).
In the embryos of soybean (Glycine max (L.) Merr.), lipid biosynthesis starts when embryos become fully green (Yazdi-Samadi et al. Reference Yazdi-Samadi, Rinne and Seif1977). It has been found that soybean embryos are photosynthetically active and produce O2 (Sugimoto et al. Reference Sugimoto, Tanaka, Momma and Saio1987) and that photosynthetic activity has a stimulatory effect on storage activity (Fader & Koller Reference Fader and Koller1985; Fuhrmann et al. Reference Fuhrmann, Johnen and Heise1994; Willms et al. Reference Willms, Salon and Layzell1999). The photosynthesis may provide an energy supply for the synthesis of fatty acids in seeds (Asokanthan et al. Reference Asokanthan, Johnson, Griffith and Krol1997; Willms et al. Reference Willms, Salon and Layzell1999; Ruuska et al. Reference Ruuska, Schwender and Ohlrogge2004), but the extent of seed photosynthesis is negligible compared to that in leaves. Moreover, the intensity of light is limited in seeds, which further limits the rate of photosynthesis (Eastmond & Rawsthorne Reference Eastmond and Rawsthorne1998). Borisjuk et al. (Reference Borisjuk, Nguyen, Neuberger, Rutten, Tschiersch, Claus, Feussner, Webb, Jakob, Weber, Wobus and Rolletschek2005) showed a functional shift in plastid differentiation from chloroplasts to storage organelles, starting from the interior of the embryo of the soybean towards its periphery. The inverse topographical relationship between photosynthetically active areas and lipid biosynthesis argues against a direct metabolic involvement of photosynthesis in lipid biosynthesis, but points to a role for photosynthetic oxygen release (Rolletschek et al. Reference Rolletschek, Radchuk, Klukas, Schreiber, Wobus and Borisjuk2005).
Photosynthetic O2 release was proposed to promote storage activity of various seeds under internal hypoxia (Rolletschek et al. Reference Rolletschek, Weber and Borisjuk2003), especially in oilseeds (Vigeolas et al. Reference Vigeolas, Van Dongen, Waldeck, Hühn and Geigenberger2003). Rolletschek et al. (Reference Rolletschek, Radchuk, Klukas, Schreiber, Wobus and Borisjuk2005) proposed that photosynthetic O2 release plays a key role in the local energy state, storage metabolism and flux toward lipid biosynthesis in developing soybean seeds. This hypothesis was based on topographical analysis of ATP gradients across tissues, quantifications of internal O2 levels, energy balance, metabolite profiles and isotope-labelling studies. Seeds show a marked degree of oxygen starvation in vivo. Despite the low light availability, photosynthesis supplied significant amounts of oxygen to the hypoxic seed tissue. This was followed by an increase in local ATP levels, most prominently within the lipid-synthesizing (inner) regions of the embryo. Partitioning of 14C-sucrose to lipids was concomitantly increased, suggesting higher rates of lipid biosynthesis (Rolletschek et al. Reference Rolletschek, Radchuk, Klukas, Schreiber, Wobus and Borisjuk2005).
Canola (B. napus L.) seed embryos contain photoheterotrophic plastids (Asokanthan et al. Reference Asokanthan, Johnson, Griffith and Krol1997) which, unlike chloroplasts, import carbon, e.g. as Glc-6-P (Flügge Reference Flügge1999). Photoheterotrophic plastids are photosynthetically active and have significant electron transport activity, high chlorophyll a-to-b ratios, and abundant proteins associated with photosystem II. However, the capacity for photosynthetic CO2 fixation is low (Asokanthan et al. Reference Asokanthan, Johnson, Griffith and Krol1997). Photoheterotrophic plastids perform cyclic electron transport via photosystem II at high rates (Weber et al. Reference Weber, Borisjuk and Wobus2005).
Similarly, respiration in developing faba bean embryos (Vicia faba) is limited by hypoxia. The photosynthetically active plastids produce oxygen that supports respiration and consequently storage (Borisjuk et al. Reference Borisjuk, Rolletschek, Walenta, Panitz, Wobus and Weber2003). It has been shown in oilseed rape that seeds exposed to light produce more fatty acids than seeds in the dark (Ruuska et al. Reference Ruuska, Schwender and Ohlrogge2004).
Schwender et al. (Reference Schwender, Goffman, Ohlrogge and Shachar-Hill2004) suggested that seeds of oilseed rape and many other species are green, despite the absence of the Calvin cycle, to store triacylglycerol more efficiently.
Jones (Reference Jones1966) reported that the protochlorophyll in the cells of the inner seed coat of C. pepo is located in discrete particles of an average diameter of 1·7 μm, which resembles the situation in aetiolated leaves. Jones (Reference Jones1966) further observed that porphyrin pigments of immature seeds are largely chlorophylls, which are subsequently converted to other green metabolites. This suggests that chlorophyll and precursors found in the pumpkin seed inner coat may have a role in photosynthesis during seed development; similar to other green seeds in particular oilseeds.
Delayed fluorescence (DF) is a long-lived light emission of functionally active chlorophyll in active photosynthesis, emitted after light illumination (Strehler & Arnold Reference Strehler and Arnold1951; Bertsch Reference Bertsch1962). DF emission is composed of several components, characterized by different decay rates (Bjorn Reference Bjorn1971; Desai et al. Reference Desai, Rane, Tatake and Sane1983). The faster decaying components have been well characterized as they provide information about the fate of energy absorbed by Photosystem II (Desai et al. Reference Desai, Rane, Tatake and Sane1983). The slow components of DF originate in back reactions in the photosynthetic chain, and with the recombination between the S2 and S3 states of the oxygen evolving complex, and the quinones QA (primary acceptor) and QB (secondary acceptor) (Joliot et al. Reference Joliot, Joliot, Bouges and Barbieri1971). The slow-rate back reactions depend on electron distribution in plastoquinon pool and Photosystem I (Katsumata et al. Reference Katsumata, Koike, Nishikawa, Kazumura and Tsuchiya2006).
In the present study, a robust field experiment was used to find out if the fruit illumination contributed to the lipid storage and yield of the pumpkin seed with a sensitive method of DF to find out if the chlorophyll-like substances in the pumpkin seed are photosynthetically active.
MATERIALS AND METHODS
Cultivation
Hull-less pumpkin seeds (C. pepo ssp. pepo var. oleifera Pietsch, cvar Slovenska golica) purchased from Semenarna Ljubljana, Slovenia, were used for cultivation. The seeds germinated in a pot and were transplanted to the field (experimental plot at Biotechnical Faculty, University of Ljubljana, 46°2′N, 14°28′E, 299 m asl) on 17 May 2008, when the seedlings were 150 mm tall. When each pumpkin fruit reached 70 mm in diameter, it was assigned to one of three treatments: (1) Control 1 – fruits left unwrapped; (2) Dark – fruits wrapped in aluminium foil to prevent the access of light; (3) Control 2 – fruits wrapped in transparent polyethylene foil, which reproduced the humidity and air access in the Dark group, but did not prevent the access of light. Each fruit was assigned to an experimental group by non-randomized blocked alternation: the first fruit that reached the size of 70 mm was assigned to Control 1, the second to Dark, the third to Control 2, the fourth again to Control 1, and so on. As the fruits grew, they were regularly inspected and the aluminium and polyethylene foils were replaced when necessary. The fruits were collected on 30 August 2008. To allow the completion of the ripening process (as is traditionally done in Slovenia), the fruits were stored intact in the light but with the same wrapping as in the field. After 1 month, the fruits were measured and weighed. The seeds were collected from the fruits, counted and weighed and then lipid and protochlorophyll content was determined.
The plants for the measurement of photosynthetic activity using DF were grown from the same batch of seeds, but were cultivated at the experimental plot of the Institute of Physical Biology at Velika Loka, Slovenia (45°56′N, 14°43′E, 375 m asl). In pumpkin, the size of the fruit is not, by itself, a good measure of developmental stage: fully ripe fruits in the present experiment weighed 0·5–4 kg. Calendar date is also an unsatisfactory measure: at the end of August, both fully developed fruits and those just beginning to develop can be found. Thus, it was decided to collect samples at three different dates (17 July, 15 August and 8 October 2008), chosen arbitrarily, to represent the whole period over which the fruits developed. On each occasion, three fruits were sampled: fruits representing individuals at the 25th, 50th (the median) and 75th percentile of all fruits present at the experimental plot at the time of sampling were chosen. Photosynthetic activity was measured within 2 h after collection.
Imaging
Transverse sections of the fresh pumpkin seeds were cut with a scalpel knife. A photograph (Fig. 1) was taken by a Dynax 5D (Konica Minolta, Tokyo, Japan) camera equipped with a 50-mm macro objective lens. The confocal fluorescent micrograph image (Fig. 1c, d) was taken by LSM510 confocal microscope (Carl Zeiss, Jena, Germany) equipped with the Plan-Neofluoar 40×oil objective. For excitation of autofluorescence, the 458-nm line of the Argon laser was used. The green emission was collected by bandpass filter 480–520 nm and red emission was collected by long pass filter 560 nm.
Determination of lipid and protochlorophyll content
Aliquots of 1 g of the pumpkin seeds were finely ground in a mortar, transferred into a polyethylene centrifuge tube and extracted by 10 ml of dichloromethane:methanol (2:1) for 1 h on a shaker at 10 rpm (tubes in horizontal position). The samples were then centrifuged at 5000 rpm for 10 min and the extracts were transferred into a measuring flask. The sediments were extracted twice more with fresh solvent. The two extracts were mixed with the first extract in the measuring flask and solvent was added up to 30 ml. Then 100 μl of the extract was diluted with 700 μl of isoamyl alcohol and absorbance was measured at 450 nm. The remaining extract was dried on a rotary-evaporator and the dry residue was weighted. The lipid content was calculated from the weight of the dry residue. The protochlorophyll and other extractable pigment content were expressed as the absorbance.
DF intensity (DFI)
DF was measured in a custom-made photon-counting luminometer (Monti et al. Reference Monti, Zrimec, Beran, Berden Zrimec, Drinovec, Kosi and Tamberlich2005; Berden-Zrimec et al. Reference Berden-Zrimec, Drinovec, Molinari, Zrimec, Fonda Umani and Monti2008). The samples (whole seeds or 0·2 g of pericarp tissue) were illuminated by a 20 W halogen lamp equipped with a heat-absorbing filter and providing 400–800 nm of light with a maximum at 650 nm and a light intensity at sample position of 60 μmol/m2/s PAR. The DF signal was detected with a red-light-sensitive photomultiplier tube (Hamamatsu R1104) with a Hamamatsu C3866 Photon Counting Unit for signal conditioning and amplification.
The samples were put in the dark in a thermostated sample holder (23±0·2°C) and illuminated for 3 s from above. DF measurement began 1 s after the illumination flash, with integration time of 100 ms. The DFI was calculated as a sum of measured photon counts between 1·1 and 2·1 s after sample illumination (Monti et al. Reference Monti, Zrimec, Beran, Berden Zrimec, Drinovec, Kosi and Tamberlich2005) and expressed per gram of fresh weight.
Average background noise and luminescence of distilled water and empty measurement cuvettes were subtracted from all DF data.
Light-transmittance of fruit wall
The fraction of light that is transmitted through the fruit wall into the pumpkin was measured by a simple innovative method. The photographic camera Konica Minolta Dynax 5D equipped with a 50 mm macro objective lens was directed to an incandescent tungsten light (Osram, 100 W) with large opaque glass bulb (diameter 90 mm). This was done with and without the bulb being covered with the pumpkin fruit wall. The two halves of each pumpkin fruit wall were measured. The camera's internal light meter was used to record the exposure parameters: exposure time (shutter speed), relative lens aperture settings (f-number) and ISO camera sensitivity. The automatic exposure control systems that are built into cameras to regulate the exposure in the focal plane in dependence of the various exposure parameters are defined in the standard ISO 2721:1982 (Photography – Cameras – Automatic controls of exposure). The exposure value (EV) was calculated using the equation: EV=log2[(N 2·S)/(t·100)], where N is the relative aperture, t is the exposure time in seconds and S is the ISO camera sensitivity. The light transmittance was calculated from the difference of two EVs (measured with and without the fruit wall). Transmittance (T) was calculated as follows: T=1/2ΔEV; and optical density (OD) was calculated OD=–log T. The method was validated by measuring EVs with a series of neutral density filters mounted in front of the camera lens (optical densities: 0·4, 0·6, 1·0, 2·0 and 4·0; Ealing Electro-Optics, Watford, UK). The Pearson correlation coefficient (r) between calculated transmittances (Tc) for neutral density filters and measured transmittances (Tm) using the present approach was 0·9997, with the regression of the form: Tm=0·049 (±0·0054)+Tc×1·0025 (±0·0120) (P<0·001).
Oxygen measurement
The content of oxygen inside the pumpkin fruit was measured with titrimetric and electrochemical determination. An aliquot of 25 g of the pulp from the inside of pumpkin fruits was mixed with 25 ml of deoxygenated water (distilled water boiled for 5 min and then purged with argon for 5 min) and macerated for 5 min in closed container at room temperature. The oxygen content was measured in water fraction with the use of oxymetric probe (WTW Multi 350i, WTW, Wissenschaftlich-Technische Werkstätten GmbH, Weilheim, Germany) and by titration with Aquamerck® Oxygen Test (Merck Chemicals, Darmstadt, Germany) according to manufacturer instructions.
RESULTS
Cultivation
A total of 25 pumpkin fruits reached 70 mm in diameter and were assigned to one of the three experimental groups. Of these, 22 pumpkin fruits were successfully cultivated (three pumpkins wrapped in transparent foil became infected with fungus during maturation and were not used in the analysis). During the 1-month post-harvesting ripening period one pumpkin wrapped in transparent foil also became infected with fungus. The remaining 21 pumpkins were measured and analysed.
Oxygen content in the pumpkin fruit
The concentration of oxygen in the pumpkin pulp was 0·2–0·3 mg/l, which was similar to the value measured in negative control (deoxygenized water, 0·4–0·5 mg/l). The concentration of oxygen in water saturated with air (0·21 oxygen) at room temperature was 9·2 mg/l.
The transmittance of the pumpkin fruit wall
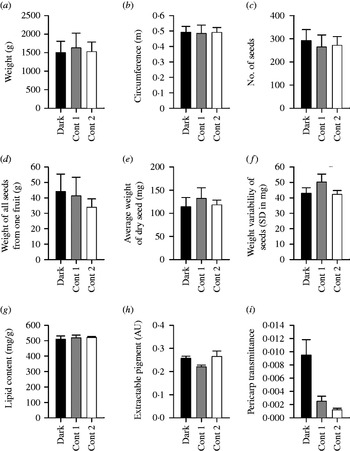
It was found that the transmittance of fruit walls of pumpkins grown in the dark was significantly higher than the transmittance of controls. No visual difference was found in pigmentation of the surface of the fruits grown in the dark or in the light, but the quantitative examination of translucency showed that the fruit walls of pumpkins grown in light were significantly darker (Fig. 2). The transmittance of the fruits grown in the dark was 0·0095±0·00702 (s.d.), which is significantly different from the transmittance of the first (0·0025±0·00224) or the second control groups (0·0012±0·00049; P=0·018, Student t-test). This corresponds to optical densities 2·22±0·54, 2·76±0·44, 2·94±0·19 for fruit walls in the Dark, Control 1 and Control 2 groups, respectively.
Morphological and phytochemical characteristics of the pumpkin fruits and seeds cultivated in dark and in control conditions. The error bars represent standard errors. The light regime is indicated by black for fruits cultivated in dark (Dark; n=9), grey for control 1 (unwrapped fruits, Cont 1; n=8) and white for control 2 (fruits wrapped in clear foil, Cont 2; n=4). (a) Weight of the fruit (g), (b) circumference of the fruit (mm), (c) number of seeds in each fruit, (d) weight of all seeds from one fruit (g), (e) average weight of dry seed (mg), (f) variability of the weight of the seeds in each fruit (expressed as standard deviation in mg), (g) lipid content (mg/g), (h) extractable pigment (AU), and (i) fruit wall transmittance (significance of the difference P=0·018).

The seed yield
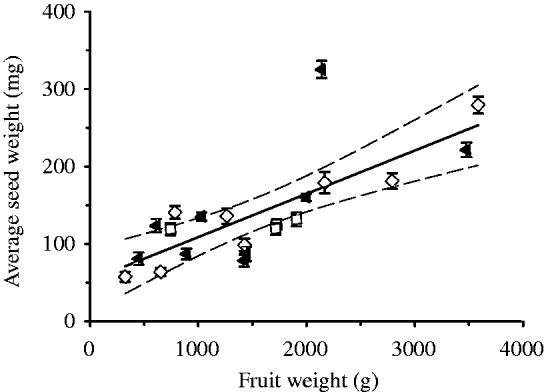
The size of pumpkin fruits was highly variable within each of the three groups. Heavier fruits contained not only more seeds (R 2=0·515; P<0·001) but also had seeds with a heavier mean weight (R 2=0·571; P<0·001, see Fig. 3). To increase the statistical power of the experiment, the size of the fruit was used as a co-variable. After adjusting for this covariate, no differences between treatments were found in fruit weight, fruit dimensions, number of seeds, total weight of seeds, lipid content and pigment content.
The correlation of mean seed weight within each fruit with the fruit weight. (▲), Fruits cultivated in dark; (□), control 1 (unwrapped fruits); (◊), control 2 (fruits wrapped in transparent foil). The continuous line denotes the linear regression between the mean seed weight and fruit weight (mean seed weight (mg)=53±19·9 mg+(0·06±0·011) fruit weight (g); r=0·76, P<0·001; n=21). Dashed lines: confidence intervals at P<0·05. The errors bars represent standard error.
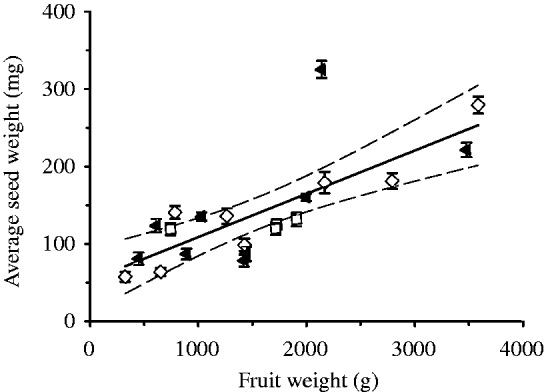
The two control groups, where the fruits were exposed to light (untreated or wrapped in transparent polyethylene foil), did not differ significantly in any parameter (Fig. 2). The fruits grown in the dark were compared with Control groups 1 and 2 separately and to a combined control group (data not shown). The absence of light had no influence on fruit weight, dimensions, number or weight of seeds or lipid or pigment content.
The photosynthetic activity of the seeds and the pericarp
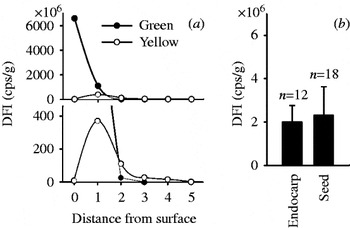
Using measurements of long-lived DFI (1–2 s), it was shown that the exocarp and mesocarp (the fruit wall) were photosynthetically active (Fig. 4a). Photosynthetic activity decreased towards the inside of the pericarp. Photosynthetic activity in yellow exocarp was lower than in green exocarp and lower than in the mesocarp just below the yellow exocarp (Fig. 4a). The inner layers of mesocarp are decreasingly photosynthetically active (see Fig. 4a lower panel). Since it was found that the fruit wall is photosynthetically active, the light probably induces the increased synthesis of pigments, which is in turn manifested as reduced fruit wall translucency. This is in agreement with the measurements summarized in Fig. 2i. DFI was absent in seeds or their close surroundings (endocarp) in any developmental stage (Fig. 4b; monitored during harvesting period from July to October). The DFI found in seeds and in the surrounding endocarp is one order of magnitude lower than in inner layers of mesocarp, more than two orders of magnitude lower than in outer layers of the mesocarp, and more than three orders of magnitude lower than in green exocarp.
DFI (in counts/second gram of wet weight) of seeds and pericarp. (a) DFI of pericarp of two fruits, green and yellow – a sequence of tissue layers from the fruit surface (layer no. 0; exocarp) to the fruit interior (layer no. 5; endocarp). (b) DFI of pumpkin seeds and endocarp. The error bars represent standard error.

DISCUSSION
The present results show that the oxygen content in the pumpkin fruit is low. This conforms with the general observation that the internal oxygen concentration is low within bulky storage organs such as apples and bananas, during the growth of potato tubers (Geigenberger Reference Geigenberger2003) and in metabolically active organs with cutinized impermeable surfaces such as Pisum seed (Rolletschek et al. Reference Rolletschek, Borisjuk, Koschorreck, Wobus and Weber2002) and soybean seed (Rolletschek et al. Reference Rolletschek, Radchuk, Klukas, Schreiber, Wobus and Borisjuk2005). Hypoxic conditions in the pumpkin fruit may indicate that oxygen release during photosynthesis may have a role in seed development and lipid storage activity.
The intensity of light transmitted to the developing seed in the pumpkin fruit is from 0·001 to 0·01 of average sunlight. This is less than half of the light in the understory shade of a forest (Sefcik et al. Reference Sefcik, Zak and Ellsworth2006). The present results show that the seeds receive low light intensities, which may however be sufficient for photosynthetic activity during development.
In the present field experiment, the absence of light had no influence on fruit weight, dimensions, number or weight of seeds or lipid or pigment content. These results are in contrast to the hypothesis that photosynthesis-derived oxygen is necessary for the development of oilseeds in hypoxic conditions. In the dark-treated group of fruits, pericarp and seed photosynthesis were prevented. No difference was found in the crop yield of treated plants compared with control groups.
DF showed that exocarp and mesocarp (fruit wall) were photosynthetically active. The light probably induces the increased synthesis of pigments, which in turn is manifested as reduced fruit wall translucency as suggested by the present measurements of transmittance of the fruit wall. In contrast, the present results suggest that there was no photosynthetic activity in seeds or their close surroundings (endocarp) at any developmental stage.
The main conclusions from the present work are that there is no photosynthetic activity in pumpkin seeds at any developmental stage. Exposure of pumpkin seeds to light does not contribute to the production of the fatty acids. This is in contrast to findings in other plant species, where photosynthesis in seeds is functional and where photosynthetic activity has a stimulatory effect on storage, e.g. soybean (Fader & Koller Reference Fader and Koller1985; Sugimoto et al. Reference Sugimoto, Tanaka, Momma and Saio1987; Fuhrmann et al. Reference Fuhrmann, Johnen and Heise1994; Willms et al. Reference Willms, Salon and Layzell1999; Borisjuk et al. Reference Borisjuk, Nguyen, Neuberger, Rutten, Tschiersch, Claus, Feussner, Webb, Jakob, Weber, Wobus and Rolletschek2005, Rolletschek et al. Reference Rolletschek, Radchuk, Klukas, Schreiber, Wobus and Borisjuk2005), oilseed rape (Vigeolas et al. Reference Vigeolas, Van Dongen, Waldeck, Hühn and Geigenberger2003; Ruuska et al. Reference Ruuska, Schwender and Ohlrogge2004; Schwender et al. Reference Schwender, Goffman, Ohlrogge and Shachar-Hill2004) and canola (Asokanthan et al. Reference Asokanthan, Johnson, Griffith and Krol1997). The present results show that in pumpkin seeds, all assimilates that are being stored in the seeds are transported to the seeds from other parts of the plant and so the energy needed for the conversion of carbohydrates into lipids must derive from transported chemical sources. Since the oxygen supply is low, respiration can only be limited unless some other energy producing metabolic pathway (e.g. glycolysis and the citric acid cycle without followed oxidative phosphorylation) could be of importance. The exact biological importance of the protochlorophyll packed in chromoplasts in the testa of the pumpkin seeds therefore remains to be elucidated. As observed by Jones (Reference Jones1966), most of the porphyrin pigments of immature seeds are subsequently converted to protochlorophyll. This may suggest that porphyrins in pumpkin seed chromoplasts might have had a photosynthetic role in previous stages of the evolution of the pumpkin, which has now been lost in the extant C. pepo. White hull and dark green inner testa may have a role in sheltering the seed embryo from the intense sunlight as in some other oilseeds, e.g. sunflower seeds, some rape seeds and poppy seeds.
The skilful laboratory assistance of Ms. Špela Bohinjc is gratefully acknowledged. This work was supported by grants from the Ministry of Higher Education, Science and Technology of the Republic of Slovenia (grand numbers: P3 0310 0381, P4-0127, P3-0108, P4-0085 and P1-0237).