Working Memory (WM) refers to a mental process (which is supported by several aspects of brain activity) that is involved in temporarily storing and manipulating information in order to perform such complex cognitive tasks as language, comprehension, learning and reasoning (Baddeley, Reference Baddeley1992). It makes possible to maintain a limited amount of information online for a short period of time, in the order of seconds, and to perform certain operations with the sustained information. Working memory representations or mnemonic traces are quickly degraded and lost unless rehearsed, and it can easily be interfered by new information. A metaphor for WM would be the blackboard on which data and operations on the data are set up temporarily to solve the current task.
One of the most prevalent theories describing the functioning and structure of WM was proposed by Baddeley and Hitch (Reference Baddeley and Hitch2000). This model is composed of a main system called the Central Executive and two “slave systems”. The Central Executive is responsible for important high-level cognitive activities that include planning, coordinating the flow of information through WM, and retrieving knowledge from long-term memory (Baddeley, Reference Baddeley1996). The other two components of WM have been termed “slave systems”, and are specialized for the storage of material within particular domains: the Phonological Loop is responsible for temporarily storing and processing verbal information, and the Visuo-Spatial Sketchpad is responsible for storing nonverbal information that has either visual (e.g., color, form) or spatial (e.g., movement, relative location) characteristics (Logie, Zucco, & Baddeley, Reference Logie, Zucco and Baddeley1990). In 2000, a fourth component was included, the Episodic Buffer. This new component simultaneously stores both phonological and visual information from the “slave systems” and it integrates information that arises from long-term memory (Baddeley, Reference Baddeley2000).
Working memory performs an important role in the child’s cognitive development. It has been postulated that beyond seven years of age, WM appears adult-like in organization and strategies (Gathercole, Reference Gathercole1998). The development of WM depends on several factors, including processing specific information of each modality, its encoding and retention in memory, the increase of capacity and the changes related to the maturation of cognitive functions that mainly involve the prefrontal cortex (Cowan et al., Reference Cowan, Wood, Wood, Keller, Nugent and Keller1998, Logie & Pearson, Reference Logie and Pearson1997, Nelson, Reference Nelson1995, Reference Nelson2000).
Numerous studies, which used tests on paper and pencil format or speeded reaction times (RTs) tasks, have documented an improvement in WM during the preschool years. Gathercole, Pickering, Ambridge, and Wearing (Reference Gathercole, Pickering, Ambridge and Wearing2004) reported that the basic modular structure of WM is present from 6 years of age. In addition, these authors observed that all the tests used in their study, the majority from the Working Memory Test Battery for Children (WMTB-C), showed a linear increase in WM performance from 4 to 14 years of age. Children’s level of performance on tests of phonological memory, such as digit span, increases dramatically during the early and middle years of childhood. Memory span (a measure of the maximum number of unrelated items that can be remembered in the correct sequence immediately after being presented) shows an increase from approximately two/three items at four years of age to around six items at 12 years (Gathercole, Reference Gathercole1998). Hulme, Thomson, Muir, and Lawrence (Reference Hulme, Thomson, Muir and Lawrence1984) had already found this developmental trajectory on this measure when comparing groups of children aged 4, 7 and 10 years and an adult group on an auditory serial recall task.
With regard to speeded RTs on WM tasks, the so-called Delayed-Match-To-Sample test (DMTS) permits to assess the evolution of WM in children. Luciana, Conklin, Hooper, and Yarger (Reference Luciana, Conklin, Hooper and Yarger2005) analyzed nonverbal tasks, including a face recognition memory task and a spatial delayed response task, in subjects between the ages of 9 and 20 years. They found that WM performance did not index developmental changes after ages 11 to 12 years. Extending this work, Conklin, Luciana, Hooper, and Yarger (Reference Conklin, Luciana, Hooper and Yarger2007) analyzed verbal and spatial WM tasks in subjects between 9 and 17 years old, and they observed that across age groups, performance tended to be better on spatial WM tasks than on verbal WM tasks. Even so, the developmental trajectories were similar for verbal and visuo-spatial WM tasks, suggesting that these differences in performance were due more to differences related to task difficulty than to differences in the neurodevelopmental processes underlying spatial and verbal WM. Paule et al. (Reference Paule, Bushnell, Maurissen, Wenger, Buccafusco, Chelonis and Elliott1998) found a better encoding of the stimulus to memorize by the older children than by the younger. These authors used six different delays from 1 to 32 seconds between S1 and S2 and observed that accuracy increased as age increased. The speed of accuracy’s decrease as the delay was higher was more accentuated for younger children who indicated worst stimulus encoding. Moreover, older children were more accurate in the correct stimulus recognition during the shorter delay (1 second) in comparison with the youngest, indicating a better stimulus encoding by the oldest. But given the difficulty of disentangle from behavioral measures the contribution on performance of the encoding, maintenance and retrieval stages, this suggestion remains as speculative.
In the present experiment the subjects have also performed the oddball task. This task has been previously used in the study of WM context updating because subjects have to maintain in memory the stimulus that should not be responded to. The electrophysiological correlates resulting from this task were also analyzed (Donchin & Coles, Reference Donchin and Coles1988).
The present paper tries to give an insight on two important aspects of WM development: (a) Most of the studies on the development of the WM function have not considered the differences and/or similarities of standardized testing and speeded RTs tasks during development, although both refer to the same type of psychological process. Based on the previous literature, the present paper analyzes the combined results obtained from a WM test and two speeded RTs task on WM during development in order to validate that both type of tasks evaluate the same psychological construct. RT and different types of errors from the DMTS and Oddball tasks were correlated with the direct scores from the WMTB-C. This approach makes it possible to validate the robustness of the results on WM development, independently of the testing format.
In the case that correlations between the different WM measurements were high the appeal to a common process (WM) would be validated. And (b), it is possible that improvement of WM performance with age would be related not only to age itself, but to individual differences in personal characteristics. If the scores of the principal component related to age would have a better correlation with the empirical variables than to age, it would suggest that the performance in WM during developmental ages would have a strong influence from individual characteristics.
Methods
Sample
One hundred and four subjects between 6 and 18 years old participated in this study (M: 11.94, SD: 3.81). For each one year age group, data from 8 participants were recorded and analyzed (4 males and 4 females). Obviously, no mean age differences were observed between genders.
The subjects were recruited from public schools, and the experiments were conducted with informed and written parental consent following the Declaration of Helsinki guidelines.
The ethics committee of Seville University approved the experimental protocol.
Experimental session
Working memory test battery for children (WMTB-C)
The WMTB-C by Pickering and Gathercole (Reference Pickering and Gathercole2001) was used. The test consists of nine subtests designed to tap the three main components of WM (phonological loop, visuo-spatial sketchpad and central executive), guided by the Baddeley and Hitch WM model. This neuropsychological test has to be administered in the following order: (1) Digit Recall, (2) Word List Matching, (3) Word List Recall, (4) Nonword List Recall, (5) Block Recall, (6) Mazes Memory, (7) Listening Recall, (8) Counting Recall, and (9) Backward Digit Recall. Subtests 1, 2, 3 and 4 measure the phonological loop, subtests 5 and 6 measure the visuo-spatial sketchpad, and subtests 7, 8 and 9 measure the central executive.
The Digit Recall, Block Recall, Counting Recall, Mazes Memory and Backward Digit Recall subtests were applied as in the original battery.
The reliability of the original version of this test involved 99 children who were retested after an interval of 2 weeks. For most of the subtests, test-retest reliability coefficients were higher for younger children than for older children. Gathercole and Pickering (Reference Gathercole and Pickering2000b) reported that their central executive and phonological loop measures have high construct validity, as well as strong predictive validity for vocabulary development, literacy, and arithmetic test performance.
The phonological subtests were adapted to the Spanish language using the following criteria:
-
- For the Word List Matching and Word List Recall subtests, disyllabic words obtained from a word frequency list used by children were employed, with similar lengths to original words and high frequency of use, in order to facilitate the testing of young children (Justicia, Reference Justicia1995).
-
- For the Nonword List Recall subtest, we used the same words as on the previous subtests. To convert words into nonwords, we changed the vowel order within words and the order of the syllabi that composed each word.
-
- For the Listening Recall subtest, we simply translated the original sentences from English to Spanish, in order to maintain the reliability of the task.
Direct scores, standard scores and span are the measures obtained with WMTB-C. The direct scores are the scores obtained directly from the sub-tests and the standard scores are the scores that are standard or validated for a population with their correspondent age and expressed in percentiles. The span refers to the number of correct items that a person is capable of memorize. The measurement units of the WMTB-C were the direct scores obtained from each of the nine sub-tests. The higher score in the task, the better performance presents the subject in working memory. These measures were correlated with the reaction times (measured in milliseconds, the better the lower) and errors (measured in percentage, the better the lower) obtained from the speeded reaction times tasks (see below). They provide a measurement not corrected by age as in standard scores, and they also present more possible values than the span obtained with the WMTB-C.
Delayed match-to-sample task
The stimulus presentation program used was E-Prime version 2.0, and for the subject’s responses a SRBOX Cedrus was used.
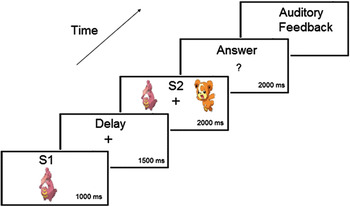
The Delayed Match-To-Sample (DMTS) task was composed of a total of 128 trials organized in 4 experimental blocks with 32 trials each (see Figure 1 for an example of a trial).
An example of a trial of the Delayed Match-to-Sample task.

The first stimulus (S1), with duration of 1000 ms, appeared in the center of the screen and had to be memorized, followed by a 1500 ms delay period. Then, two stimuli (S2) (one was the same one that subjects had previously seen and the other a novel stimulus) appeared, one on the left and the other on the right side of the screen, for 2000 ms. Subjects were instructed to press the left button with their left hand or the right button with their right hand if the S2 equal to the S1 appeared on the left or right side of the screen, respectively. The response window was 2000 ms. Finally, the trial ended with an auditory feedback, providing the subject with a positive or negative sound if a correct or incorrect response was given.
The S1 was presented in the center of the screen covering a visual angle of 4.56, and it was situated 2.28 eccentrically in the horizontal meridian from the bilateral S2. All stimuli were different in each trial and corresponded to images of children’s cartoons.
The trials were balanced; half of them appeared on the left and the other half on the right. The order of presentation was random for each subject, and a rest period was allowed between blocks. A practice session of 10 trials was carried out prior to the task to make sure that instructions had been understood.
The recorded variables were RTs, correct responses and errors. The three types of errors analyzed were: no responses to S2 (omissions), incorrect responses to S2 (commissions), and anticipations. Anticipations were defined as responses to S1, responses given in the delay period, or responses with durations less than 200 ms after S2 appearance. Means, SDs and variation coefficients of RTs were obtained from individual subjects, as well as means of different types of errors. The paradigm was kept as easy as possible (i) to make sure that 6 year-old children would be able to perform the DMTS task with a reasonable accuracy level and (ii) to facilitate the use of this task in the near future with younger children.
Oddball task
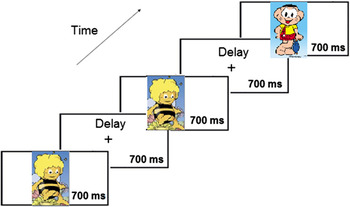
The Oddball paradigm was composed of a total of 120 trials; 25% of the trials included a novel stimulus while 75% presented the same repeated stimulus. The stimuli were presented for 700 ms in the center of the screen and an inter-stimulus interval of 700 ms was used. All the stimuli, both standard and novel, were cartoons. Subjects were instructed to press the button only when a novel stimulus appeared. The response window was 1400 ms. There was only one block, and the order of presentation was random. The variables recorded were RTs, correct responses and the three types of errors (omissions, incorrect responses and anticipations). Anticipations were those responses with durations less than 200 ms. Means, SDs and variation coefficients of RTs were obtained from individual subjects, as well as means of different types of errors. Figure 2 shows an example of a task trial.
An example of a trial of the Oddball task.

The three tasks (WMTB-C, DMTS and Oddball) were administered in one session which had a 2:30 hour of duration, approximately. The WMTB-C was the first task to be performed by subjects because it was the longer and the most complicated task and also produced a greater fatigue. Then, the subjects performed the DMTS task and finally the Oddball, the shorter experimental task. In these two tasks, the desirable results would be shorter RTs with the better accuracy as possible (higher correct responses and lower types of errors).
Data analysis
Behavioral measures obtained from the DMTS and Oddball tasks were analyzed. Reaction time means (RTs), Standard deviation (SD) of RTs, Coefficient of Variation (CV) of RTs and the different types of errors were calculated with the 2010 version of Matlab (MathWorks Inc., MA, USA) and the errors were converted to percentages. The SD of RTs permitted to operationalize the intra-subject behavioral variability.
For the WMTB-C, the direct scores obtained on each subtest were the analyzed variables.
Spearman’s correlations
In order to observe the co-variation patterns between all variables, Spearman’s correlations were performed between age, parameters from DMTS and Oddball tasks, and the direct scores of the nine subtests from WMTB-C. The two-tailed statistical significance of the correlations among all the variables was calculated, taking into account the number of subjects (N = 104). A statistical threshold of p = .01 was considered given that five independent sources of variability were identified in the data (see in the PCA results section). The correlation matrix was expressed in a color code to better appreciate the different cross-variables’ correlation patterns. The statistical analysis was computed using SPSS.
Principal component analysis
With PCA, it is possible to identify the latent variables (components) that explain the variance in the experimental data (Gorsuch, Reference Gorsuch1983). This method allows to express the total variance of the data in latent variables or components, with lower order components explaining more data variance than higher order components. PCA was performed in the matrix containing all the behavioral measures, 21 variables by 104 subjects. Non-rotated PCA based on the correlation matrix was obtained. The non-rotated PCA corresponds to the more parsimonious way of using PCA, and it has been shown to be valid to extract a maturational and individual variability EEG component (Barriga-Paulino, Flores, & Gómez, Reference Barriga-Paulino, Flores and Gómez2011; Rodríguez-Martínez et al., Reference Rodriguez-Martinez, Barriga-Paulino, Zapata, Chinchilla, López-Jiménez and Gómez2012). It must be pointed out that although Varimax rotation would permit a better extraction of components related to specific processes in order to define the factorial structure of a given data set, the non-rotated approach would be better to extract this first factor related to age and general individual variability.
Regressions
To observe the dependency between the behavioral measures with age and the component scores of the first component obtained from PCA (the component with the highest explained variance in the data), that is, the representation of each variable in the principal component space, linear (and inverse) regressions were computed. The criterion to choose the better model that fit in each regression was the higher coefficient between those two models. The determination coefficient would express the variance explained by the regression model. The first component was chosen for the analysis due to its highest explained variance, among remain components, in the data and which can be considered as a component expressing the age and the individual variability in performance. This component was regressed with the behavioral measures in order to find out whether there was more explained variance than when regressed with age.
Results
Descriptive analysis
Omissions were the most common type of error performed by children in both experimental tasks, making up more than 50% of total errors (DMTS Task: mean ± SD of incorrect responses: 1.11 ± 4.32; mean ± SD of anticipations: 0.50 ± 1.52; mean ± SD of omissions: 2.03 ± 3.99; Oddball Task: mean ± SD of incorrect responses: 1.51 ± 1.69; mean ± SD of anticipations: .03 ± 0.23; mean ± SD of omissions: 2.33 ± 3.68).
Spearman’s correlations
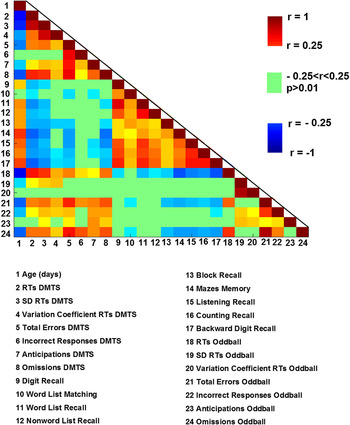
Regarding the two RTs experimental tasks (DMTS and Oddball), the means, SDs and CV of the RTs, the three types of errors (incorrect responses, anticipations and omissions) and the total errors decreased with age, except for incorrect responses in the DMTS task, the CV of RTs and anticipations in the oddball task (see Figure 3). The behavioral measures of the RTs experimental tasks presented a strong pattern of positive co-variation.
Pearson’s correlations matrix between age and empirical variables. The correlation values are expressed in a color code. The variables are indicated below in the figure. Statistical significance threshold was situated at the |r |> 0.25, p < .01 level. RTs DMTS: Response times in the Delayed Match-to-Sample test. SD RTs DMTS: Standard deviation of response times in the Delayed Match-to-Sample test.

All the subtests of the WMTB-C showed positive correlations with each other and with age, except the Word List Matching sub-test, indicating an improvement in performance on the battery during development. The direct scores on the WMTB-C sub-tests showed negative correlations with the DMTS task’s behavioral measures, but the amount of significant correlations was very low for the incorrect responses and the anticipation errors (Figure 3). The direct scores of subtests of the WMTB-C showed negative correlations with means of RTs, SD of RTs, total errors, incorrect responses and omissions for the Oddball task (Figure 3).
Principal component analysis (PCA)
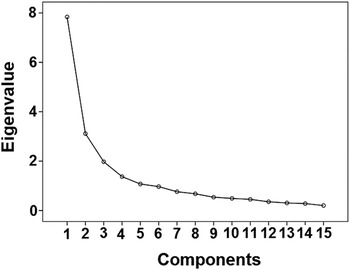
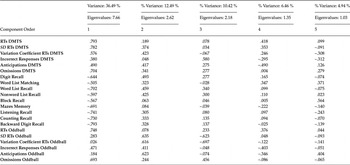
PCA was performed, and the loading components and component scores were obtained. The Scree Test (Figure 4) suggests the presence of five possible components explaining the data variability. Corroborating this decision, by selecting five components, we also obtained only five components with eigenvalues above 1.0, which according to the Kaiser method all components with eigenvalues under 1.0 should be dropped. Also Guttman (Reference Guttman and Lazarsfeld1954) refers that “components having eigenvalues larger than 1.0 summarize shared variation and should be retained”. Table 1 shows the explained variance and the eigenvalues of the five components.
Scree test obtained from Principal Components Analysis. Please notice that after the fifth component the slope of the curve remains constant.

Component loadings, percentage of explained variance and Eigenvalues of the five components extracted from PCA. The component loadings correspond to the correlations between the component scores and the behavioral measures of the DMTS and Oddball tasks, and direct scores of WMTB-C

The first component presented a high correlation with almost all behavioral measures (see Table 1 for loading components values: correlation between the component scores and all variables), indicating that it corresponded to a general factor. Loading components presented inverse sign for DMTS and Oddball variables with respect to WMTB-C due to the inverse correlational pattern between these variables.
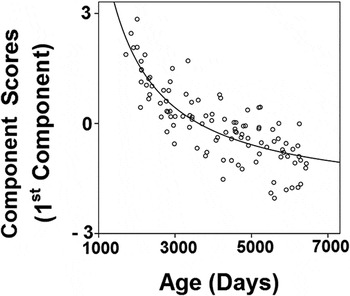
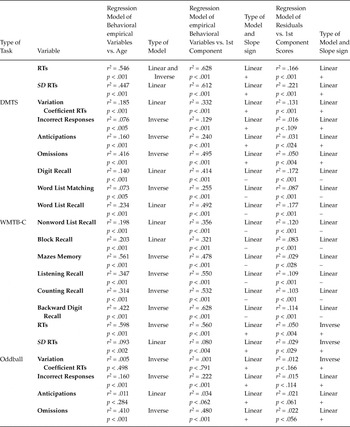
The component scores of the first component showed a high correlation with age (Figure 5). The second and third components indicated a considerable commonality in the variability sources between speeded RT tasks and WMTB-C tasks. The second component presented high loadings on the RTs measures of the DMTS task, while the third component presented it on the incorrect responses of the same task. For the Oddball task, the second component presented positive correlations with the behavioral variability measures while the third component showed negative correlations in almost variables. Additionally, for this last task, the second component presented higher loadings on incorrect responses and anticipations, while the third component presented high loadings on omissions. For the WMTB-C, the second component presented positive correlations in the all nine sub-tests, while the third component presented some negative correlations in few sub-tests. The fourth component was associated with a speed accuracy trade-off, given the inverse relationship between RTs and commission errors on the speeded RT tasks. A lack of correlation between the scores of this component and age was obtained (r 2 = .047, p < .26). Also the second, third and fifth components did not present correlations with age (C2: r 2 = .001, p < .708; C3: r 2 = .009, p < .349; C5: r 2 = .002, p < .629). Given that the component scores of the first component presented a high correlation with age (r 2 = .663, p < .001), we correlated it with the other variables of the matrix and compared the determination coefficients with those obtained between age and the same variables. Almost all the variables presented better correlations with the first component scores than with age, as can be seen in Table 2.
First PCA scores component vs. age. Inverse regression between age and component scores of the first component extracted from Principal Components Analysis. (r 2 = .674; p < .001).

Determination coefficients obtained by regressing empirical variables vs. age, empirical variables vs. first component scores and residuals of regression with age vs. first component scores. By empirical variables we refer to behavioral measures (DMTS and Oddball tasks) and direct scores (WMTB-C task). Determination coefficients and two-tailed p-values are indicated. The sign of the slope of residuals of regression with age vs. first component scores are also indicated. The type of regression model (linear or inverse) that best fits the data is also shown. WMTB-C: Working Memory Test Battery for Children. DMTS: Delayed Match-to-Sample Test

Regressions
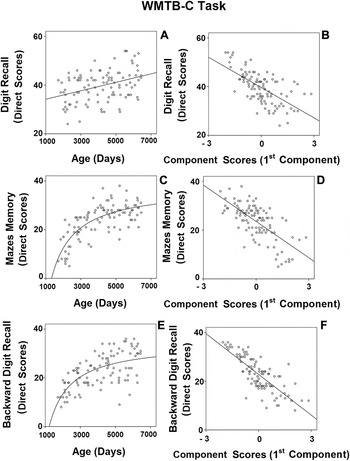
Figures 6, 7 and 8 represented some examples of regressions between age and variables of the three tasks, and component scores of the first component with the same variables. The complete report of regressions appears in Table 2, where the determination coefficients for the regressions are also presented.
Regressions between age (and scores of first component) and WMTB-C direct scores. (A) Age and Digit Recall direct scores; (B) first component scores and Digit Recall direct scores; (C) age and Mazes Memory direct scores; (D) first component scores and Mazes Memory direct scores; (E) age and Backward Digit Recall direct scores; (F) first component scores and Backward Digit Recall direct scores on the WMTB-C task. The determination coefficient and associated probability appear in Table 2. Note how the data spread diminishes when represented against first component’ scores, compared to when it is represented with respect to age.

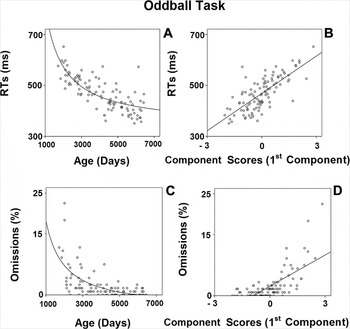
Regressions between age (and scores of first component) and behavioral measures of Oddball task. (A) Age and RTs; (B) first component scores and RTs; (C) age and omissions; (D) first component scores and omissions on the Oddball task. The determination coefficient and associated probability appear in Table 2. Note how the data spread diminishes when represented against first component’ scores, compared to when it is represented with respect to age.

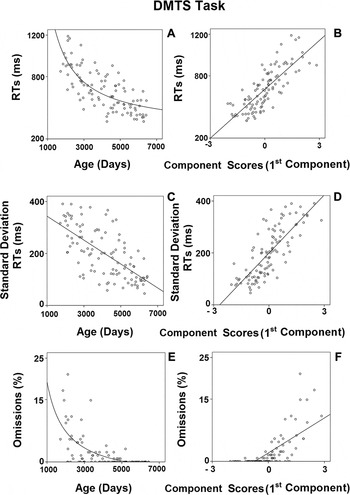
Regressions between age (and scores of first component) and behavioral measures of DMTS task. (A) Age and RTs; (B) first component scores and RTs; (C) age and standard deviation of RTs; (D) first component scores and standard deviation of RTs; (E) age and omissions; (F) first component scores and omissions on the DMTS task. The determination coefficient and associated probability appear in Table 2. Note how the data spread diminishes when represented against the first component scores, in comparison with its representation with respect to age.

Figure 6 corresponds to the WMTB-C task and presents regressions for three subtests: Digit Recall (part of Phonological Loop Component), Mazes Memory (part of Visuo-Spatial Sketchpad Component), and Backward Digit Recall (part of Central Executive Component). A better relationship can also be observed between these variables and the component scores of the first component than when they are plotted against age. The Mazes Memory and Backward Digit Recall subtests present an inverse model as the better model when compared to age. In the remaining regressions, the linear model is the most satisfactory.
Figure 7 corresponds to the Oddball task and presents regressions of RTs and percentages of omissions against age and against the first component scores. Once again, the association between the variables and the component scores is better than with age, and the regressions corresponding to age improve when represented inversely.
Figure 8 corresponds to the DMTS task and presents regressions of RTs, SD of RTs, and percentage of omissions against age and against component scores of the first component. A better relationship between these variables and the first component scores than with the age can be observed. The inverse model fits better in the relationship between RTs and the percentage of omissions against age. In the other regressions, the linear model is more adequate.
The residuals that could not be explained by age were regressioned with the component scores of the first component, in order to analyze if the first component could explain something more besides the age. The determination coefficient and the type of regression model more appropriated for each variable was shown in Table 2. Also the slope sign of each regression is presented. The best regression model that fits in almost all variables was the linear model and behavioral measures and direct scores presented inverse signs when regressed with age.
Discussion
The present findings show an enhancement in the performance of the subjects across age on the three tasks: DMTS, Oddball and WMTB-C. The decrease in the behavioral measures (RTs, SD of RTs and errors) of the DMTS and Oddball tasks with age increase is consistent with previous research supporting age-related improvements in performance on WM tasks (e.g., Luciana et al., Reference Luciana, Conklin, Hooper and Yarger2005; Paule et al., Reference Paule, Bushnell, Maurissen, Wenger, Buccafusco, Chelonis and Elliott1998; Riggs, McTaggart, Simpson, & Freeman, Reference Riggs, McTaggart, Simpson and Freeman2006) and the fact that WM improves during childhood and adolescence (Conklin et al., Reference Conklin, Luciana, Hooper and Yarger2007). The presence of the first component explaining 36.49% of the data variability (see Table 1) indicates a component, probably including age and individual variability, during tasks performance. Given that first component capture the age and individual variability, the loading components of the second and third components in WMTB-C, DMTS and Oddball suggest that these three tasks are highly interrelated, probably because all of them are related to the performance in the same construct: Working Memory. Additionally, the component scores for the first component presented a high correlation with age, and they even presented better correlations with all variables than age did. The latter result suggests that the first component scores are not only related to age, but also to the individual variability in performance. A similar interpretation has been proposed for the scores of the first component extracted from the Power Spectral Density (PSD) of spontaneous EEG (Barriga-Paulino et al., Reference Barriga-Paulino, Flores and Gómez2011). The possibility that the identified first component in WM behavioral measures and in PSD during development would correspond to a common or distinct component arises from these results.
The negative correlations observed between the WMTB-C and the speeded RTs (a better performance on WMTB-C corresponds to faster correct responses) could also be associated with what Diamond (Reference Diamond2000) described when referring to a close interrelation between motor and cognitive development. Therefore, first component, which is always the main factor in explaining data variability, could consist in the maturation that occurs during human development. It is possible that as suggested by several authors some physiological changes as myelination and synaptic pruning could be intervening in maturation (Keshavan et al., 2004), although certainly the participation of environmental factors could indeed be driving the maturational process (Bjorklund, Reference Bjorklund1997; Perry & Pollard, Reference Perry and Pollard1998). Interestingly, this component explain the variance due to age and to individual differences, indicating that the increase in performance with age is fused together with an individual factor of performance improvement which affects most WM behavioral measures in the same sense than age. This conclusion was supported by the regressions between the residuals not explained by age and the score components of the first component obtained from PCA, which almost all were statistically significantly (the Oddball task presented worst p values than the other two tasks). The linear model was the best that fits in barely all regressions (with exception of some behavioral measures from the Oddball task which presented an inverse model as the most appropriated) and presented inverse signs in behavioral measures and direct scores. This indicates that subjects who present a good performance in the WMTB-C task, generally, also present a good performance in the speeded reaction times tasks and if they presented a bad performance in one task there is a tendency to also present a bad performance in another. Therefore, first component would capture not only the variability related to age, but also the variance related to individual level of performance across tasks.
However, this first component has not to be understood as a “general maturational factor” given that different psychophysiological domains (visual, auditory motor, cognitive, etc.) can have different developmental trajectories. A more appropriate conceptualization would be an “overall performance factor” in which the contribution of the different psychophysiological domains are added and consequently the external performance improves with age.
It is possible to suggest that according to the proposed hypotheses. (i) WM is a psychological process that can be measured in different format presentations; therefore, WMTB-C and DMTS are valid for assessing WM. This finding suggests that the results being obtained with Functional Magnetic Resonance Imaging (fMRI) about children’s WM, which are basically based of DMTS tasks, can be used to understand the maturation of WM as measured by tests like the WMTB-C. And (ii) first PCA component suggests that WM performance during development is a function not only of age but of an individual factor possibly related to the individual performance abilities.