Implications
Animal production systems are required to contribute actively to a reduction in anthropogenic environmental impact. However, correctly estimating the environmental impact of products, including dairy products, requires tools that are designed specifically for the task. This research attempts to develop an energy-based formulation for the so-called functional unit (FU) by which the environmental impacts of goat farming may be accounted for. Milk fat alone or in combination with solid or non-fat matter is used in the proposed FU formulas for goat milk. The results will be of value in ensuring accurate and comparable impact assessments of dairy goat production systems.
Introduction
In 2013, the goat was the third most common dairy species globally (18.0 million tons of fresh milk) and, during the 1993 to 2013 period, the number of dairy goats worldwide increased sharply (+62.3%) (Food and Agriculture Organization Statistics Division, 2016). However, goats and other small ruminants were not taken into account in life cycle assessment (LCA) reports regarding the livestock emissions of greenhouse gases (GHGs) at either the global (Food and Agriculture Organization (FAO), 2010) or the European scale (Lesschen et al., Reference Lesschen, van den Berg, Westhoek, Witzke and Oenema2011). Some studies estimated that the amount of GHGs released per unit of goat milk is higher than that per unit of cow milk (Kanyarushoki et al., Reference Kanyarushoki, van der Werf and Fuchs2010; Weiss and Leipp, Reference Weiss and Leip2012), though it has been emphasized that data for sheep or goat milk production are usually less reliable than for cow milk (Weiss and Leipp, Reference Weiss and Leip2012). The quality of the data is a matter of considerable importance and in order to achieve a reliable LCA acceptable according to the international standards (International Standard Organization, 2006a) the data should conform to specific requirements. In particular, the LCA is a relative approach that is structured around a functional unit (FU) (International Standard Organization (ISO), 2006b) and, as a general principle, ISO (2006b) clearly recognized the essential requirement for a scientific, evidence-based approach in arriving at an LCA. Accordingly, the definition of a FU for the dairy sector should take into account the natural characteristics of milk and the intrinsic differences among dairy species.
The energy content of milk may provide a common basis for comparison. For instance, FAO (2010) adopted 1 kg of fat and protein corrected milk (FPCM) as the FU for comparing cow milks of different fat (F) and protein (P) contents. Opio et al. (Reference Opio, Gerber, Mottet, Falcucci, Tempio, MacLeod, Vellinga, Henderson and Steinfeld2013) estimated the combined contribution of sheep and goats to the global load of GHGs from ruminants, but their estimates were based on the FPCM formulation proposed for dairy sheep alone (Pulina et al., Reference Pulina, Macciotta and Nudda2004). To date, a specific formulation of the FU for goat milk for use in LCA has not been proposed. However, it is anticipated that there will be increasing interest in evaluating the environmental impact of the dairy goat, along with that of other dairy species. Therefore, the objectives of this work were: (i) to develop and test new predictive models for determining accurately the energy content of goat milk from compositional traits; and (ii) to propose a FU formulation to be used in LCA of dairy goat systems. To achieve the goals, new goat-specific regression equations (REs) were developed, using a set of data collected from the literature, and these were then compared with previously published models for both goat milk and cow milk.
Material and methods
Data sources and data collection criteria
To compile a goat milk data set, computer-based searches were carried out using several keywords which were entered into a number of bibliographic databases (Supplementary Table S1); searches were also made of the reference lists of reviews and research articles. To be accepted as data sources, the studies needed to report the following information: (i) a direct measurement of the gross energy (GE) content of goat milk; and (ii) information on F, P, lactose (Lac), total solids (TS) or solid non-fat matter (SNF). If available, data on the residues remaining after incineration of the milk (ASH) were also recorded. The SD or SEM was also recorded, if available. Studies were excluded if the GE content of the milk was not reported, or if the data were reported as least-squares means resulting from statistical procedures. For the bibliographic data sources retained, a two-digit code was adopted. The first (numerical) digit referred to the reference (i.e. the data source); the second digit (alphabetical) referred to the aggregated (mean) values from the animals grouped (e.g. by diet or lactation stage) within each study (Supplementary Table S2). The references concerning all the bibliographic data sources are listed in Supplementary Material S1.
Collection of published predictive models
During the computer-based search procedure described above, particular efforts were made to collect published predictive models (PPMs) estimating the energy content of goat milk from compositional traits. Due to the great similarity of cow milk to goat milk, the PPMs originally developed for cow milk were also collected. A list was then compiled codifying the PPMs, as detailed in the Supplementary Table S3. The references from which the PPMs were obtained are listed in Supplementary Material S1. All of the quantities used in the models listed were converted to a common set of units of measure, as detailed below.
Data processing
Because MJ/kg was adopted as the unit of measure for the GE content of milk, the data expressed as kcal/kg were transformed using a conversion factor of 4.19×10⁻³ MJ/kcal. For GE data reported as per litre of milk, a volume-to-mass conversion was made, taking into account the specific gravity of goat milk at 20 °C (Gabas et al., Reference Gabas, Cabral, de Oliveira and Telis-Romero2012). If necessary, the P content was derived from the total nitrogen content multiplied by 6.38 (Aguilera et al., 1990; see Supplementary Material S1). In some studies, the ‘true protein content’ was reported. In such cases, the P content was obtained by multiplying the reported values by 1.0025 (Jenness, Reference Jenness1980; Tziboula-Clarke, Reference Tziboula-Clarke2003). For studies in which the ASH content was not reported, an average value of 0.8% (Jenness, Reference Jenness1980; Tziboula-Clarke, Reference Tziboula-Clarke2003; Park et al., Reference Park, Juárez, Ramos and Haenlein2007), rather close to the mean value obtained from the surveyed literature (0.86%), was adopted. If not reported, the SNF content of the goat milk was calculated by subtracting F from the respective TS value. In some circumstances (e.g. some PPMs), US units were converted to European units according to the conversion factors listed by the National Institute of Standards and Technology (2013). The descriptive statistics and the multivariate exploration by principal component analysis (PCA) were performed using STATISTICA 7.0 (StatSoft, Inc., Tulsa, OK, USA). Principal component analysis was preliminarily performed as an exploratory technique on all of the compositional variables and the GE contents of goat milk. A second PCA was also performed on a subset of data including the milk yield (MY),in order to test the hypothesis that MY was an explanatory variable; if that were the case, the data set would have needed reducing, due to the lack of MY data in some data sources. The normality of the data distribution was tested using the Shapiro–Wilk ‘W’ test (Shapiro and Wilk, 1965; see Supplementary Material S1).
Model development, testing and selection
A set of ad hoc REs was developed on the goat milk data set by using the General Regression Model option of STATISTICA 7.0. More than 30 REs were developed, including polynomial to the 2nd-degree regressions, to account for any possible curvilinear relationship between the GE and the regressors. A preliminary selection step was performed, excluding those REs for which at least: (i) a regression term did not satisfy the condition P<0.05 for the associated F statistic under the null hypothesis; (ii) the fitting (R 2 adj) was lower than 0.9; and (iii) the Sy,x was higher than the lowest value obtained through applying the PPMs to the goat milk data set. For the retained REs, a thorough selection process was performed, considering (for details, see Supplementary Table S4; all the relevant references are listed in the Supplementary Material S1): (i) the occurrence of outliers according to the Weisberg ‘t’ statistic (t) (Weisberg, 1980) and the Mahalanobis distance (D 2 ); (ii) the occurrence of influential data according to the leverage (L) and Cook’s distance (D) (Cook, 1977); (iii) a multi-collinearity evaluation step by variance inflation factors (VIF) analysis; (iv) an over-fitting minimization step according to Akaike’s information criterion (AIC) (Akaike, 1974); and (v) a variable selection finalization by Mallow’s Cp statistic (Cp) (Mallows, 1973).
Controlling for spurious findings and functional unit formulation for goat milk
Regression studies performed on aggregated data (e.g. mean values), as in our case, may be affected by the so-called ‘ecological fallacy’ (Diez Roux, Reference Diez Roux2002) (i.e. spurious findings that cannot be clearly obtained by processing the respective individual data). For this reason, the selected REs were further submitted to a control procedure performed through a Monte Carlo permutation test (MPT) (Higgins and Thomson, 2004; see Supplementary Material S1). For this assessment, the selected statistic was the Wald test ‘T’ obtained by dividing each regression coefficient (β ij ) of the j-th RE by the respective SE ij value (Higgins and Thompson, 2004). For each regression coefficient, the original T (T orig) value was calculated and, by shuffling randomly 20 000 times the elements in the dependent variable (GE) vector, the number of equivalents or higher ‘T’ values and the respective permutation test P-values (plus the 95% confidence intervals) were calculated. The MPT was performed using Stata/SE 13.1 (evaluation edition) for Windows (StataCorp LLC, College Station, TX, USA) through a basic, ad hoc, developed program (Stata, 2013; see Supplementary Material S1). The authors will make the program available upon request.
Eventually, the regressions passing the whole selection process were validated on a subset of individual goat milk data retrieved from the studies of Peterson and Turner (1939) and Perrin (1958) and then proposed as new developed prediction models (DPMs) for the GE of goat milk. In formulating the FU for goat milk, a standard GE content of 3.142 MJ/kg was used as a reference as for 4% fat-corrected milk (FCM) (Gaines, 1928), and later, for solid-corrected milk (SCM) (Tyrrel and Reid, 1965). The FU formulation was carried out according to Tyrrel and Reid (1965).
Results
Data collection and data set characterization
According to the criteria adopted, 10 out of 34 studies reporting data on the energy content and chemical composition of goat milk were retained (Supplementary Table S2). The main cause of exclusion was the lack of calorimetric measurements. Only two papers (Peterson and Turner, 1939; Perrin, 1958) out of the 10 reported raw (individual) data. In many of the studies that were retained, the SD or SEM for the mean values was not provided, or was not inferable from the information available.
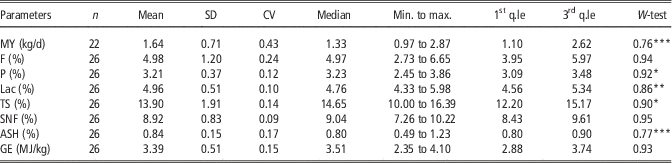
The descriptive statistics for the GE and compositional data are reported in Table 1. In total, 26 records were stored in the data set. In 22 out of 26 cases, MY was also available. Overall, the F content was the chemical trait that exhibited the highest variability. The mean GE content was also rather variable; the value reported by SanzSampelayo et al. (1999) for Granadina milk was 1.74-fold higher than the lowest value recorded by Tovar-Luna et al. (2010) in a study on Alpine goat. The mean GE, SNF and F values followed a normal distribution (Table 1), whereas for MY and Lac the skewness of the data distribution was positive (0.4 and 0.8 respectively, data not shown), and for TS and P it was negative (−0.7 and −0.2, respectively, data not shown). Resorting to the assumption of an average value of 0.8% for 13 out of 26 records most likely explains the observed departure of ASH from normality.
Descriptive statistics of the data set obtained through the literature search on goat milk characteristics

1st and 3rdq.le=1st and 3rd quartile (or 25th and 75th percentile); MY=milk yield; F=fat content; P=protein content; Lac=lactose content; TS=total solid content; SNF=solids non-fat; ASH=ash; GE=gross energy; W-test=Shapiro–Wilk’s ‘W’ test for normality; * P<0.05, **P<0.01, ***P<0.001.
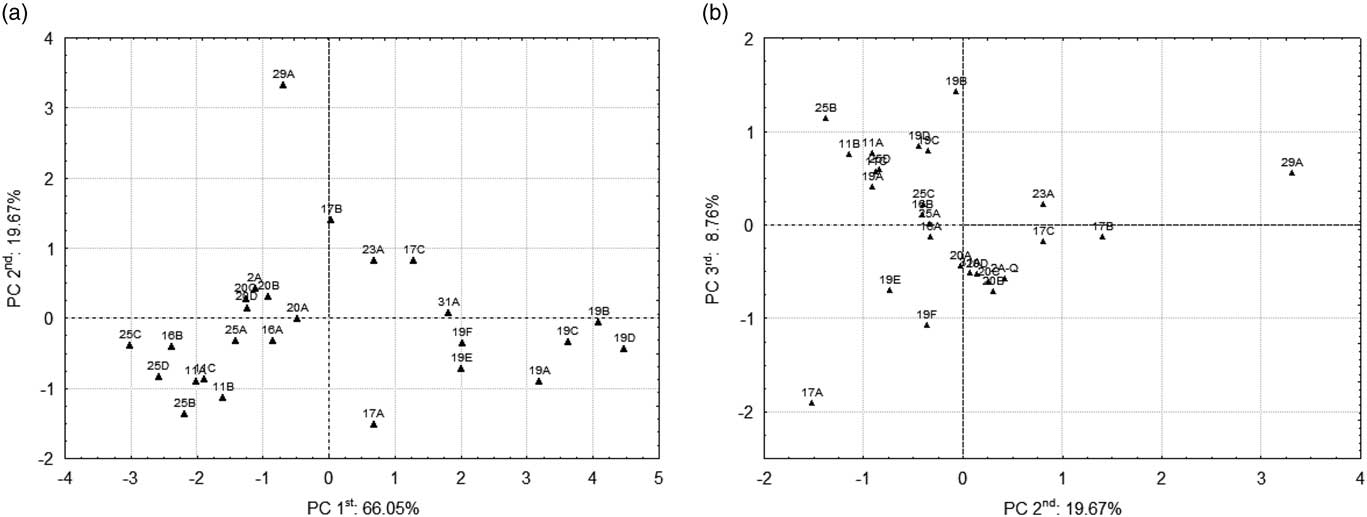
Principal component analysis was performed as an exploratory technique on all of the cases considered. The first three PCs captured ~94.5% of the total variance. The 1st PC (~66% of the total variance) strongly correlated with several of the main components of goat milk (TS, SNF, F and P) (Supplementary Table S5). The 2nd PC captured approximately a fifth of the total variance and correlated positively with ASH (Supplementary Table S5). Following the PCA, all of the cases plotted assumed a spread pattern along the 1st PC, whereas along the 2nd PC a case (29A) relating to Granadina goat milk (SanzSampelayo et al., 1988) clustered separately (Figure 1a). The 3rd PC (<10% of the total variance) correlated mainly with Lac (Supplementary Table S5). Except for case 17A, relating to Granadina milk (Molina-Alcaide et al., 2010), which exhibited outlier behaviour along this PC, there was not a clear clustering pattern (Figure 1b). Principal component analysis was also carried out on the 22 records for which MY was available. MY correlated inversely with the energy-related parameters (Supplementary Table S5). However, the spatial pattern of the 1st and 2nd principal planes (data not shown) did not change substantially from the initial PCA (Figure 1). In addition, the variance captured by the first three PCs was similar (95.0%) to the corresponding value for the PCA performed on the whole data set (94.5%). In fact, with the exception of the change of sign of the factor loading values, there were no substantial variations (Supplementary Table S5). For these reasons, in the rest of the work, MY was not further considered as an explanatory variable.
Principal Component Analysis (PCA) applied to the goat milk data set. Case arrangement on the first (a) and second (b) principal planes. Alphanumeric case labels relate to the respective data sources as detailed in the Supplementary Table S2.

Study of the performance of published predictive models
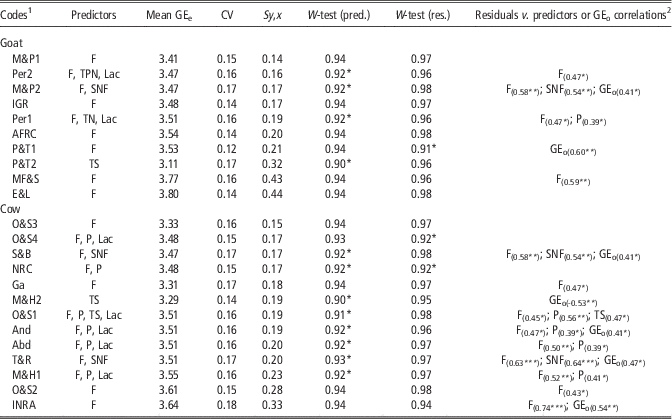
A total of 23 PPMs retrieved from the scrutinized literature were used to predict the GE content from the chemical parameters stored in the data set for goat milk. In an attempt to identify the best ones, the goat and cow PPMs were ranked according to the standard error of the estimate (Table 2). The best model was M&P1, developed by Mavrogenis and Papachristoforou (1988) on 529 Damascus goat milk samples. Regarding the PPMs for cow milk, the model O&S3 from Overman and Sanmann (1926) worked well, having a low Sy,x compared with the more complicated models developed for goat milk and that included P and Lac (e.g. Per1 and Per2), SNF (M&P2) or F alone (e.g. E&L, P&T1) (Table 2). Despite the recorded GE data (GEo) distribution (see Table 1), for 12 out of 23 PPMs the predicted GE values (GEe) were not normally distributed (Table 2). Nevertheless, 21 out of 23 PPMs gave normally distributed residuals. The relationship among the residuals and predictors was also assessed to ascertain any bias dependence from the variability of the predictors. For half of the goat milk models tested, the residuals were invariant in relation to the values of the predictors or the respective GEo values (Table 2). Only three out of 13 PPMs for cow milk showed this feature. Overall, taking into account a Sy,x to GEo ratio (data not shown) below or equal to a 5% threshold, the normal distribution of the GEe values and residuals and the independence of the residuals from the predictors, two models developed for goat milk (M&P1 and IGR; Sx,y of 0.42 and 0.49 MJ/kg, respectively) and one for cow milk (O&S3; Sx,y of 0.45 MJ/kg) were considered in the rest of the work.
Statistics of the GEe (MJ/kg) content predicted by the different existing models by the compositional values recorded in the goat milk data set

W-test=Shapiro–Wilk’s normality test for predicted values (pred.) or residuals (res.); *P<0.05; F=fat (%); P=protein (%); SNF=solid non-fat matter (%); TS=total solids (%); Lac=lactose (%); ASH=ash (%); TN=total nitrogen content (%) (=P/6.38); TPN=true protein nitrogen (=TN/1.0025); GEe=estimated gross energy content of goat milk; GEo=observed gross energy content of goat milk.
1 The coding of the published predictive models are specified in the Supplementary Table S3.
2 For each model tested, the coefficient (R) of significant correlation between the residuals and GEo predictors are reported within the brackets; *P<0.05, **P<0.01, ***P<0.001.
Development of new predictive models for the energy content of goat milk
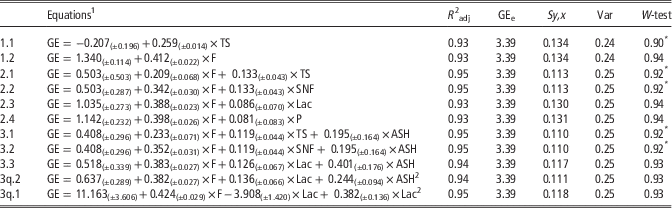
Based on the data found in the literature, several attempts were made to develop new regression models for accurately predicting the GE content of goat milk. The 11 best REs according to the criteria set out in the ‘Material and Methods’ section are listed in Table 3. In particular, as the lowest Sx,y recorded for PPMs was 0.14 MJ/kg (the M&P1 model, see Table 2), the retained REs had an Sx,y value ranging between 0.110 and 0.138 MJ/kg (Sy,x/GEo ratio between 3.2% and 3.8%).
Results of the regression model development performed on the goat milk data set

W-test=Shapiro–Wilk’s normality test for predicted values; *P<0.05; var=variance of the estimated GE values.
1 Intercept and regression coefficients (β i ) are reported with their respective standard errors within the brackets.
Model testing and selection
Outliers
A thorough investigation of the occurrence of outliers that could possibly affect the robustness of the regression analysis (Stevens, 1984) was carried out. In no cases did the largest t and D 2 values recorded (Supplementary Table S6) overcome the respective thresholds (Supplementary Table S4), which indicated that, for all of the REs, none of the GEo or compositional data of the goat milk data set could be considered to be outliers.
Influential data
The L values recorded for each RE (Supplementary Table S6) were always lower than the respective cut-off values (Supplementary Table S4), indicating that none of the GEo values influenced the respective GEe counterpart. On the other hand, for the equations (3.3), (3q.1) and (3q.2), the highest D values were greater than the thresholds (Supplementary Table S4). This finding suggested that, overall, the influence of observations on the developed regressions may be regarded as substantially low, but their influence is not negligible for the trivariate REs including Lac.
Multi-collinearity, over-fitting and variable selection
All of the regressions that had more than one predictive variable exhibited an Sy,x below 0.12 MJ/kg, and two of the trivariate regressions (equations (3.1) and (3.2)) reached an Sy,x as low as 0.11 MJ/kg. However, multi-collinearity should be avoided or minimized. From this standpoint, equations (1.1) and (1.2) represent the ‘optimal’ predictive REs (only one regressor). However, equations (2.2), (2.3), (2.4), (3.3), (3.2) and (3q.2) also showed VIF values below the set threshold of three (Supplementary Table S4). However, equation (3q.1) exhibited an abnormal VIF corresponding to the squared term (Lac2) that, regardless of any further consideration about the meaning of Lac as an explanatory variable, advised against its further consideration in the rest of the work. Looking at the over-fitting risk through the AIC, the best REs are those including F and SNF or TS (equations (2.2) and (2.1); AIC=−34.5, data not shown). However, other regressions performed well. In fact, equations (1.1), (3q.1) and (3q.2) were regarded as moderately supported, as their ∆i values (Supplementary Table S4) were between 4 and 7 (Burnham and Anderson, 2004; see Supplementary Material S1). Overall, the Cp values recorded for the developed REs (Supplementary Table S6) were higher than the thresholds (see Supplementary Table S4 for details). However, equations (2.1), (2.2), (3.1) and (3.2) ranked as the best regressions. On the contrary, for the univariate REs (equations (1.1) and (1.2)) and for equations (2.3) and (2.4),the Cp values were far from the expected value, indicating their incompleteness. Because of the occurrence of influential data, the lack of significance and the poor performance demonstrated throughout the selection procedure, equations (3q.2) and (3q.3) were not further considered as candidate DPMs. In addition, equation (1.1) was excluded, due to poor performance, but equation (1.2) was retained due to an equivocal penalization under the combined AIC and Mallows’s Cp statistic selection steps. Finally, all the retained equations (Supplementary Table S6) had normally distributed residuals (W-test always⩾0.95, P>0.05, data not shown), and no significant correlations were found between the residuals and predictors or the GEo (data not shown).
Controlling for spurious findings
In this work, the risk of fallacious regressions was controlled by a MPT (Higgins and Thompson, 2004). For the univariate regression, equation (1.2), as well as the bivariate equations (2.1) and (2.2), which also included TS or SNF as predictors, the control procedure gave positive outcomes (Supplementary Table S7). The MPT was applied also to the previously excluded trivariate regressions (equations (3.3), (3q.1), (3q.2)), and the outcomes (not shown) confirmed the choice previously made.
Performance comparisons between models
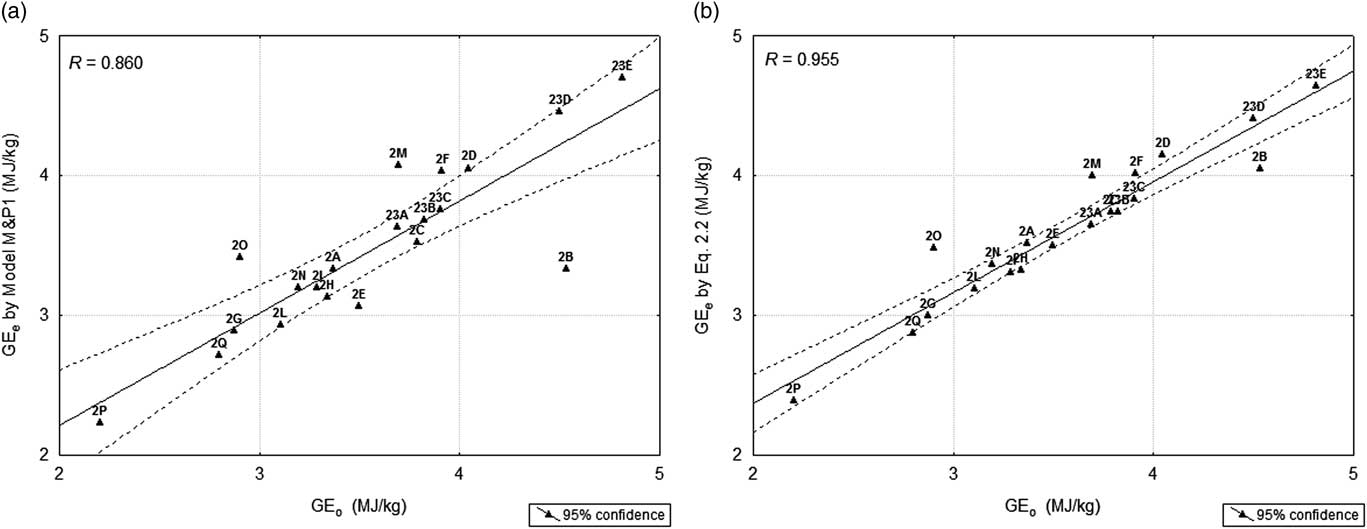
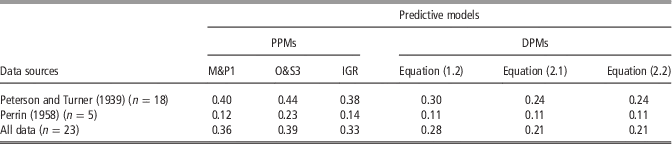
Ultimately, the top-ranked PPMs were compared with the best-performing REs. For this task, the data from the individual goat milk samples reported by Peterson and Turner (1939) and by Perrin (1958) (Table 4) were used. When all of the data were considered, the errors were high for the estimates based on the best PPMs, namely M&P1, O&S3 and IGR, having Sy,x/GEo ratios of 12.3%, 10.9% and 9.3%, respectively (data not shown). The Sy,x/GEo ratio was only 7.5% for the estimates made using equation (1.1) and diminished to 6.1% for the estimates carried out through equations (2.2) or (2.1) (data not shown). The Sy,x/GEo ratio was calculated separately on the data reported by Peterson and Turner (1939) and Perrin (1958) and confirmed that equations (2.2) (but also equations (2.1), not shown) was superior to the best-performing PPMs (Figure 2, Supplementary Figure S1). In particular, the maximum deviation of the GE values predicted using equation (2.1) was lower than for the M&P1 model (Supplementary Figure S1). Furthermore, on average, the GE content predicted by equation (2.1) was less affected by underestimation (−3.6%, n=9) than using the M&P1 model (−7.1%, n=14) even though a similar overestimation occurred (+5.0% and +4.7%, respectively).
Plots of the relationship between the observed energy content of the individual goat milk samples (GEo) and the respective values estimated (GEe) by the M&P1 model (a) and by equation 2.2 (b), which was developed in this work. Data labels: 2A to 2Q were from Peterson and Turner (1939); 23A to 23E were from Perrin (1958).

Standard errors of the estimate (MJ/kg) of the best published (PPMs) and the developed predictive models (DPMs) for the gross energy content of goat milk

Energy prediction models and functional unit formulations
Based on these findings, equations (2.1) or (2.2) are proposed as new DPMs of the GE content of goat milk. From equation (2.2), a corrected formula for the SCM (SCMgoat, in kg) may be obtained as follows:
 $${\rm SCM}_{{{\rm goat}}} \,{\equals}\,M{\times}\left( {0.503{\plus}0.342{\times}F{\plus}0.133{\times}{\rm SNF}} \right)\,/\,3.142$$
where M is the mass, in kg, of goat milk and 3.142 the mean value of the GEe in MJ/kg of milk. A similar formula can be obtained from equation (2.1) using TS instead of SNF as the explanatory variable.
According to equation (4), 1 kg of SCMgoat can be proposed as a functional unit for goat milk (FUgoat), computed as follows:
 $${\rm FU}_{{{\rm goat}}} \,{\equals}\,0.1601{\plus}0.1088{\times}{\rm F}{\plus}0.0423{\times}{\rm SNF}$$
Alternatively, if the F content is the only compositional trait available, from equation (1.2) a FCM formula (FCMgoat) can be derived:
 $${\rm FCM}_{{{\rm goat}}} \,{\equals}\,M{\times}\left( {1.340{\plus}0.412{\times}{\rm F}} \right)\,/\,3.142$$
In this case, one kg of FCMgoat can be proposed as the FU for goat milk production (FUgoat):
 $${\rm FU}_{{{\rm goat}}} \,{\equals}\,0.4265{\plus}0.1311{\times}{\rm F}$$
Discussion
A specific energy-based formulation of the FU for goat milk to be used in the LCA has not yet been proposed in the scientific literature. Previous studies dealing with the environmental performances of dairy goat systems through an LCA approach (Kanyarushoki et al., Reference Kanyarushoki, van der Werf and Fuchs2010; Opio et al., Reference Opio, Gerber, Mottet, Falcucci, Tempio, MacLeod, Vellinga, Henderson and Steinfeld2013) adopted formulations of the energy-based FU developed for other dairy species. On the other hand, from the bibliographic search that has been undertaken, it is clear that direct caloric measurements of goat milk have not been extensively carried out. It is likely that the labour involved is the main factor that prevents measurements of the energy content of goat milk from being routinely performed.
In the study reported here, an attempt was made to search for and develop predictive models for the energy content in goat milk as the basis for reliable FU formulations that could then be applied in LCAs of dairy goat production systems. In doing this, a literature search was undertaken with the aim of collecting published data on the GE content and composition of goat milk, as well as published predictive models for the GE content in cow milk and in goat milk.
With minor exceptions, the range of compositional data of goat milk retrieved from the literature covers the values reported for several goat breeds, such as the Maltese and its crosses (Gnan et al., Reference Gnan, Erabti and Rana1985), Nubian (Soryal et al., Reference Soryal, Beyene, Zeng, Bah and Tesfai2005), Girgentana (Todaro et al., Reference Todaro, Scatassa and Giaccone2005), Alpine (Zeng et al., Reference Zeng, Escobar and Popham1997), Damascus (Economides and Louca, 1981; Mavrogenis and Papachristoforou, 1988), Finnish (Uusi-Rauva et al., Reference Uusi-Rauva, Ali-Yrkko and Antila1970), Masri and Aardi (Sawaya et al., Reference Sawaya, Safi, Al-Shalhat and Al-Mohammad1984) and Verata (Rabasco et al., Reference Rabasco, Serradilla, Padilla and Serrano1993).
As far as the characterization of the data set retrieved from the relevant literature is concerned, the PCA revealed the positive relationships that exist among the main energy-containing components of goat milk (i.e. F, SNF and TS). Interestingly, P and Lac were poorly correlated with GE (R=0.71, data not shown). Prasad et al. (Reference Prasad, Tewary and Sengar2005), working with milk samples from different goat breeds and their crosses, found that the GE content did not correlate with Lac and that it was also only weakly correlated with P (R=0.31).
All of the goat-specific PPMs that were collected were tested on the goat milk data set. It was revealed that the best-performing PPMs were IGR (Nsahlai et al., 2004) and M&P1 (Mavrogenis and Papachristoforou, 1988), each based on milk F as the unique predictor. Although the M&P1 model was calibrated on a single breed (Damascus goats), it is most likely that the vast sample size (n=529) gave it some robustness. Other goat-specific models, such as that proposed by Economides and Louca (1981) (E&L), developed on a smaller number of specimens (50), clearly suffered from a loss of generality when applied to an external data set. Though developed for cow milk, other models worked rather well, especially those having F as the unique predictor (e.g. the O&S3 model). However, even when the best PPMs were applied to the goat milk data set, the bias of prediction was always greater than 4%.
Therefore, in order to develop new and more accurate models for predicting the GE content, from which a reliable FU for goat milk could be formulated, a set of REs was developed and then submitted to a selection and validation procedure. Several REs, such as those that included only SNF as a predictor, were discarded at an early stage of selection, due to poor fitting (R 2 adj=0.69, not shown) and low accuracy (Sy,x≥0.30 MJ/kg, not shown). Although SNF is regarded as an energy-containing component of goat milk, the poor performance of the model that used it as a sole predictor was in line with our observations and also with the poor predictive power of Lac (Brett et al., Reference Brett, Corbett and Inskip1972) and P (Prasad et al., Reference Prasad, Tewary and Sengar2005).
The REs that were retained showed two main features that indicated that they could be considered as reliable candidates for estimating the GE content of goat milk (Kleiynen et al., Reference Kleijnen, Bettonvil and Van Groenendal1998): (i) there was agreement between the mean GEe and the mean GEo (3.389 MJ/kg); and (ii) the variances were highly similar: 0.26 for the GEo data (not shown), 0.24 for the estimated GE by equations (1.1) and (1.2), and (0.25) in all of the other cases (Table 3). In addition, the GEe data distributions were normal-shaped, as was the case for the GEo data (e.g. see equations (1.2), (2.3), (2.4), etc.), or, at worst, they were very close to normal (e.g. against a threshold value of 0.93 of the W-test for normality, equations (2.1) and (2.2) reached a value of 0.92).
Comparing the REs based on F alone with their bivariate counterparts that included also TS or SNF (equations (1.2), (2.1) and (2.2)), it is noteworthy that F, though important, should not be considered as an exhaustive predictor of the GE of goat milk. This observation was previously reported by Peterson and Turner (1939), who obtained better estimates of GE for goat milk by using TS rather than F.
Regarding the trivariate REs that have been developed (e.g. equations (3.1) and (3.2)), ASH seems to contribute significantly to the prediction of GE in goat milk. Similarly, Tyrrel and Reid (1965) developed a set of predictive models for the GE content in cow milk, among which at least one top-ranking model included the ASH content term. Overman and Gaines (Reference Overman and Gaines1933) stated that the ASH contribution needed to be considered in computing the caloric value of a cow milk sample, but they did not explain adequately how the energy content of ASH (4.98 kcal/g, i.e. 0.0209 MJ/g) could be calculated. A possible explanation for the role of the ASH contribution in predicting the GE content in milk could be the physic chemical interactions between alkali-ASH-generating minerals that occur naturally in milk (i.e. sodium, potassium, calcium and magnesium) and the acid that is generated during calorimetric measurements (Schroeder, Reference Schroeder1977). Goat milk has a high proportion of such elements in its mineral pool (Jenness, Reference Jenness1980; Tziboula-Clarke, Reference Tziboula-Clarke2003). However, in the literature surveyed, insufficient details were reported both of the mineral profile of goat milk and of the calorimetric methodology to make any such quantitative appraisal possible.
Other REs were developed that combined the quadratic percentage contents of Lac and ASH in different arrangements. For these equations, meaningful interpretations were not possible. Tyrrel and Reid (1965) also developed some regressions for goat milk which included exponential terms. In contrast to these authors, in the present work the choice of discarding these REs from the pool of candidate DPMs was made according to the outcomes of the over-fitting minimization and variable selection steps.
Developing regression models from mean data is an approach that may not be free from pitfalls. Unfortunately, a more appropriate methodological approach, such as a meta-analysis, was out of the question due to a generalized lack of suitable statistic descriptors (i.e. SEM or SD) in the data sources. Hence, a control step specifically conceived for minimizing the risk of spurious findings in the development of predictive models on mean compositional data (the MPT) was adopted as a countermeasure. As a result, none of the trivariate REs satisfied the controlling procedure, suggesting that they should be regarded as cases of fallacious regressions with a high probability of failure if applied to an external data set.
In a comparison with the three best PPMs that were retained in the first phase of the work, the three best REs based on F, F and SNF, or TS were tested on a subset of individual goat milk data. As expected, all of the obtained Sy,x values were higher than the respective Sy,x obtained using mean values. It is well documented, however, that individual goat milk samples usually show a highly variable composition (Tziboula-Clarke, Reference Tziboula-Clarke2003). Nevertheless, the three REs that were finally selected were superior to the best PPMs. Interestingly, our simplest RE, based on F alone (equation (1.2)), gave less-biased estimates of the GE compared with the F-based model M&P1 (Mavrogenis and Papachristoforou, 1988) and Institute of Goat Reseach (IGR) (Nsahlai et al., 2004), which were specifically developed for goat.
From the practical perspective of adopting an energy-based FU definition in the LCAs of dairy goat systems and in the absence of direct measurements, the GE content of milk may be estimated accurately because it is strictly related to milk chemical components, such as F and TS, that are routinely assessed in breeding programmes and control plans. Though using multiple FU can assist in achieving a better understanding and interpretation of the environmental burden, as well as of productivity and farm income (Cooper, Reference Cooper2003; Roy et al., Reference Roy, Nei, Orikasa, Xu, Okadome, Nobutaka and Shiina2009), comparability among different food production systems demands a common FU definition (Cooper, Reference Cooper2003; ISO, 2006b; de Vries and de Boer, Reference de Vries and de Boer2010). On the other hand, the importance of adopting a suitable FU definition in an LCA is a crucial aspect of the methodological debate, given that LCA outcomes largely depend on the choice of the FU (Fleischer and Schmidt, Reference Fleischer and Schmidt1996; Cooper, Reference Cooper2003; Roy et al., Reference Roy, Nei, Orikasa, Xu, Okadome, Nobutaka and Shiina2009). In this regard, de Vries and de Boer (Reference de Vries and de Boer2010) emphasized that for milk or eggs a common FU definition that was based on mass (e.g. 1 kg) would not be the best choice for the LCA, due to the high water content of these foods.
In the present work, three energy-based formulations for the FU of goat milk are proposed for use in LCAs when data on milk F only, or F and NSF (or TS), are available. The FU is a quantitative measure of the functions that the goods (or services) provide (Finnvedena et al., Reference Finnvedena, Hauschild, Ekvall, Guinée, Heijungs, Hellweg, Koehler, Penningtonf and Suh2009). Indubitably, the main function of dairy products lies in their nutritional contribution to their consumers’ diet. From this perspective, it is curious that FUs based on the energy content of food are rare in LCAs, as a primary function of food is to deliver energy to the body (Schau and Fet, Reference Schau and Fet2008; Roy et al., Reference Roy, Nei, Orikasa, Xu, Okadome, Nobutaka and Shiina2009). In addition, the energy content of dairy products, as well as of other food items, is a measurement that permits sustainability assessments of farming systems to be undertaken through methodological frameworks other than LCA, such as energy balance or emergy analysis (e.g. Ahamed et al., Reference Ahamed, Saidur, Masjuki, Mekhilef, Ali and Furqon2011).
It should also be emphasized that studying the caloric value of milk is an important issue in contexts other than the environmental performance evaluation of milk production systems. For instance, the predictive models for GE content in goat milk developed here and proposed following a rigorous process of model testing and selection may be helpful in feeding-strategy optimization, through comparing energy secretion with the metabolizable energy content of the diet.
In conclusion, even though several metrics can be used in defining the FU for milk to be used in LCAs of goat farming systems, the FU formulations proposed here should be adopted in place of the similar energy-based ones that have been developed for other dairy species.
Acknowledgements
The authors gratefully acknowledge Dr Maria Stella Ranieri for her precious support during the bibliographic search and reference listing. This work was part of the regional project titled ‘Progetto integrato finalizzato allo sviluppo di un sistema di filiera nei settori dell’allevamento ovino e caprino nella Regione Lazio – MISURA 124’ – Lazio Region Rural Development Programme 2007-2013, grant no. 22/124/23.
Supplementary material
To view supplementary material for this article, please visit https://doi.org/10.1017/S1751731117001720