1. Introduction
The evolution of karst topographies by the dissolution of soluble bedrocks takes time. Most of the drainage of classical karst terranes is beneath the surface of relatively static and fissured carbonate substrates. These take 104–105 years to develop and may then persist for > 106 years (Waltham, Bell & Culshaw, Reference Waltham, Bell and Culshaw2005). Karstic terranes can be expected to develop faster on the most soluble but poorly known (Frumkin, Reference Frumkin1994; Mottershead et al. Reference Mottershead, Duane, Inkpen, Wright, Gutiérrez, Gutiérrez, Desir, Guerrero, Lucha, Marín and García-Ruiz2005; Bruthans et al. Reference Bruthans, Asadi, Filippi, Vilhelm and Zare2008) substrate that we consider here, namely rock salt that consists mainly of halite (NaCl).
Classical studies of karst topographies aim to constrain the rates of recharge, transport and loss of water involved in the local hydrological cycle. An alternative category of karst terrane develops on a soluble salt substrate that is itself moving through its own, rather slower, cycle of recharge, flow and loss. The global cycles of water and salt can run in parallel when gravity drives them together in the hydrosphere. However, solar power (via wind) can separate salt from seawater by evaporation. Once separated, salt and water can remain separate in the geosphere for 106–7 years.
After outlining the classical karst cycle we introduce the salt cycle as illustrated by the subaerial extrusions of Hormoz salt in the Zagros Mountains of Iran (Kent, Reference Kent1979; Talbot, Reference Talbot, Blundell and Scott1998). We then describe an individual extrusion and consider how its morphology fits into the local salt cycle. We use the measured hydrogeology of this example to constrain the vertical rate at which the dissolution of salt generates overlying residual soils, estimate the age of such soils on distal salt and thereby constrain the likely salt flow and extrusion rates. This interpretation is broadly reinforced by measurements over five years of displacements of markers on the salt.
2. Classic karst development
Most of the drainage beneath karstic surfaces in classic limestone terranes scarred by dolines (known as sinkholes in the USA) in both the soil cover and the bedrock is usually along corroded fractures or bedding plane partings that decrease in number as they narrow with depth. The base of the highly corroded surficial epikarst zone (typically ≤ 10 m deep) depends on where aggressive surface water saturates in the soluble ion(s). Surface water drains underground via dolines: cylindrical, conical, bowl or saucer-shaped closed surface depressions that form by dissolution, collapse or local subsidence (Waltham, Bell & Culshaw, Reference Waltham, Bell and Culshaw2005). Surface water drains centripetally downward into ‘solution dolines’ from topographic divides. ‘Subsidence dolines’ develop from below, as veneers of unconsolidated sediments are washed into fissures in the underlying bedrock, while ‘collapse dolines’ develop where roofs of bedrock fall into cavities. The fine fraction of non-cohesive infill of dolines tends to wash underground leaving the coarser fractions to line small bouldery depressions.
Karst topography is a detail in the solar powered global hydrological cycle in which ocean water continuously evaporates into the atmosphere and precipitates onto land, from which it flows back to the ocean via rivers and groundwater, often with diversions through the biosphere. Gravity and tectonics can drive salt through a similar global cycle that can take much longer (Warren, Reference Warren1999). Here we describe and analyse an example of the interaction of the salt and hydrological cycles.
3. Salt cycle in Iran
Rocksalt forms by seawater evaporating beyond 11 times its usual salinity in restricted basins and can be buried and squeezed back to the surface via diapirs where extruded salt is dissolved and recycled back into the ocean (Warren, Reference Warren1999).
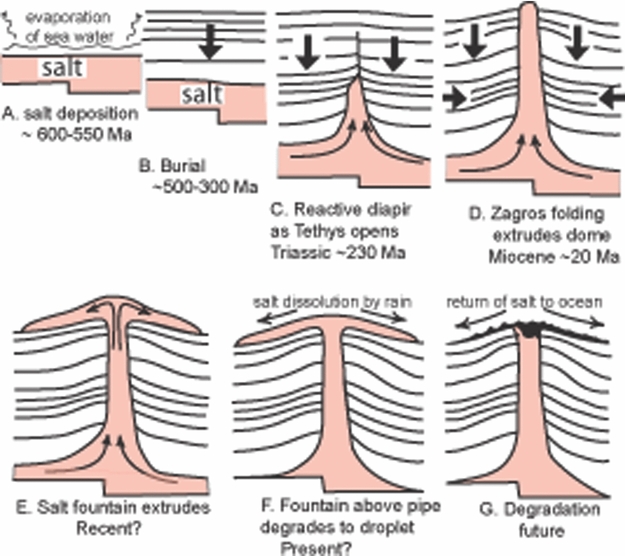
The subaerial extrusions of salt in the Zagros Mountains (Kent, Reference Kent1979) are of the Hormoz sequence that formed when beds of salt hundreds of metres thick accumulated by the evaporation of Infracambrian to Cambrian (~600–500 Ma) seawater in half-graben in a Pan-African crystalline basement (Fig. 1a; Talbot & Alavi, Reference Talbot, Alavi, Alsop, Blundell and Davison1996). With its interbeds of anhydrite, carbonates, sandstones and occasional lavas, this sequence was buried by ~ 3 km of Palaeozoic sediments (Fig. 1b) and rose into low conformable salt walls over old faults in the basement when the Tethys Ocean opened in Triassic times (~ 230 Ma). Salt in these walls was squeezed to the surface in rows of pipe-like diapirs as successive anticlines recorded the SW advance of the Zagros deformation front after the Tethys closed (Fig. 1d).
How subaerial extrusives of Hormoz salt in the Zagros Mountains of Iran relate to the global salt cycle. Approximate times refer to Konarsiah (modified after fig. 2 in Talbot et al. Reference Talbot, Medvedev, Alavi, Shahrivar, Heidari, Vendeville, Mart and Vigneresse2000).

All these extrusions appear to evolve through much the same range of shapes (Talbot, Reference Talbot, Blundell and Scott1998). Salt diapirs rise at 2–4 mm y−1 and some emerge in vents pulled apart at releasing bends along strike-slip faults in 1–12 km of denser cover rocks. The previously constrained salt breaches the surface with maximum buoyancy and rises rapidly in topographic domes that may reach 900 m above any surrounding collar of upturned country rocks (Fig. 1d). Unable to support itself without lateral constraint by the country rock, the dome spreads downslope over its surroundings. These may be gravel plains near sea level or the crest of a limestone anticline ~ 1000 m above sea level. In full vigour the salt may extrude at > 1 m yr−1 and develop the steady profile of a viscous fountain (Fig. 1e; Talbot et al. Reference Talbot, Medvedev, Alavi, Shahrivar, Heidari, Vendeville, Mart and Vigneresse2000). Eventually each extrusion exhausts its local source layer of salt that closes around the deep stem. No longer supplied from depth, any summit dome gravity-spreads into any surrounding salt apron as the extruding salt assumes the profile of a viscous droplet (Fig. 1f). The profiles of salt droplets degrade beneath growing thicknesses of residual capsoils of the insoluble components of the salt sequence. Insoluble interbeds in the salt give rise to blocks that can reach dimensions of > 100 m in those soils. As dissolution recycles the now static salt back into the ocean, the extrusion degrades to a heap of badland soils and then a soil and block-filled crater above a breccia pipe (Fig. 1g).
As confined diapiric salt extrudes into the open air, it de-stresses and an outer skin up to 6–10 m thick dilates to a much weaker and more permeable salt. The outer carapaces of relatively well-exposed and vigorous salt extrusions in the arid south of Iran dilate by microscopic fractures across and around halite grains. These are joined by macroscopic, surface-parallel, relief joints linked by a few widely spaced steep fractures (Talbot, Reference Talbot, Blundell and Scott1998; Cosgrove, Talbot & Aftabi, Reference Cosgrove, Talbot and Aftabi2009). They nonetheless develop rillenkarren, rounded runnels separated by sharp ridges a few centimetres apart, that deepen down slopes of bare salt that can be many metres long (Bruthans et al. Reference Bruthans, Asadi, Filippi, Vilhelm and Zare2008). Large bare surfaces in fractured carapaces mature to towers and pinnacles with seasonal surface streams flowing over confined salt (Talbot, Reference Talbot, Blundell and Scott1998). Such exposed carapaces can expand and contract elastically with temperature changes but are sufficiently strong to limit downslope salt flow to centimetres to metres per year when they are dry but are so weakened by a few rainstorms per decade that the salt can temporarily surge like ice flowing at decimetres per day (Talbot & Pohjola, Reference Talbot and Pohjola2009).
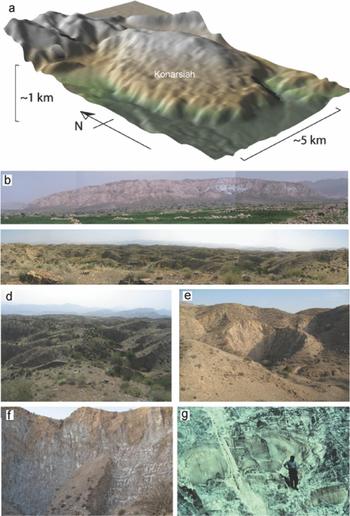
Exposures of salt soon disappear beneath thickening mantles of cap soils on older and less vigorous extrusions in areas of higher rainfall among the inland mountains. It is therefore not definite that covered salt has a dilated carapace. However, the evidence we will present suggests that the upper 10 m or so of salt is permeable, probably due to microfractures. Exposed carapaces characterized by both macrofractures and microfractures allow water to weaken the salt mass and dynamically recrystallize the initially strong uniformly course-grained diapiric salt to the bimodal grain size of weak extrusive salt (Schleder & Urai, Reference Schleder and Urai2006). Flow of such salt increasingly disperses porphyroclasts of the diapiric salt in increasing volumes of finer (< 2 mm) daughter grains (see e.g. fig. 5 in Talbot, Reference Talbot and Pohjola1998 that includes a close-up of this fabric seen in Fig. 2g).
The relief and morphology of Konarsiah. (a) A digital elevation model for Konarsiah seen obliquely from the WSW. (b) Panorama of Konarsiah from about 3 km to the south. (c) Panorama of zone 2 dolines looking south from near summit. (d) Close-up of dolines in zone 2. (e) Young doline developing in an older example in zone 3. (f) Salt exposed in the wall of a major doline in zone 3. (g) Recumbent folds in salt exposed in the southern terminus.

4. Konarsiah geology
Centred near 28°45′N, 52°25′E, the Konarsiah salt extrusion has previously been referred to as Kuh-e-Namak (Feroosabad) (Kent, Reference Kent1979; Talbot & Alavi, Reference Talbot, Alavi, Alsop, Blundell and Davison1996; Talbot, Reference Talbot, Blundell and Scott1998). It lies 20 km from the southern end of a 90 km long row of six diapirs emergent along the N–S trace of the Mangerak fault (Talbot & Alavi, Reference Talbot, Alavi, Alsop, Blundell and Davison1996). Although a conical southern summit may be the remnants of a summit dome, Konarsiah was first taken to be a salt droplet between a vigorous salt fountain at Kuh-e-Jahani 10 km to the SSE and a ruined droplet at Bachoon 22 km to the NW (Talbot & Alavi, Reference Talbot, Alavi, Alsop, Blundell and Davison1996). This work revises that categorization to a waning fountain by demonstrating that salt is still rising from depth.
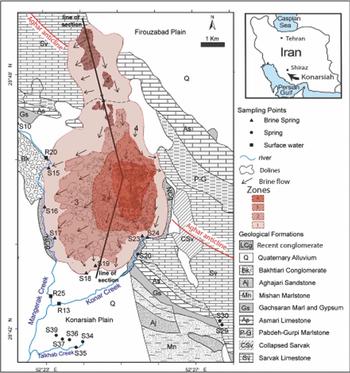
Konarsiah has an area of 37.4 km2, a N–S length of 10.5 km and a W–E width of 5.5 km. The southern summit reaches 1660 m above sea level and 740 m above an alluvial plain to the south. The Konarsiah salt body is the result of extrusions from two vents merging on the surface. Both vents are pulled apart between strands of the Mangerak strike-slip fault where it offsets the Aghar anticline (Figs 3, 4).
Zones 1–4 with different slopes, soil thicknesses and karstic features. Insert shows regional setting. Line of section refers to profile in Figure 4.

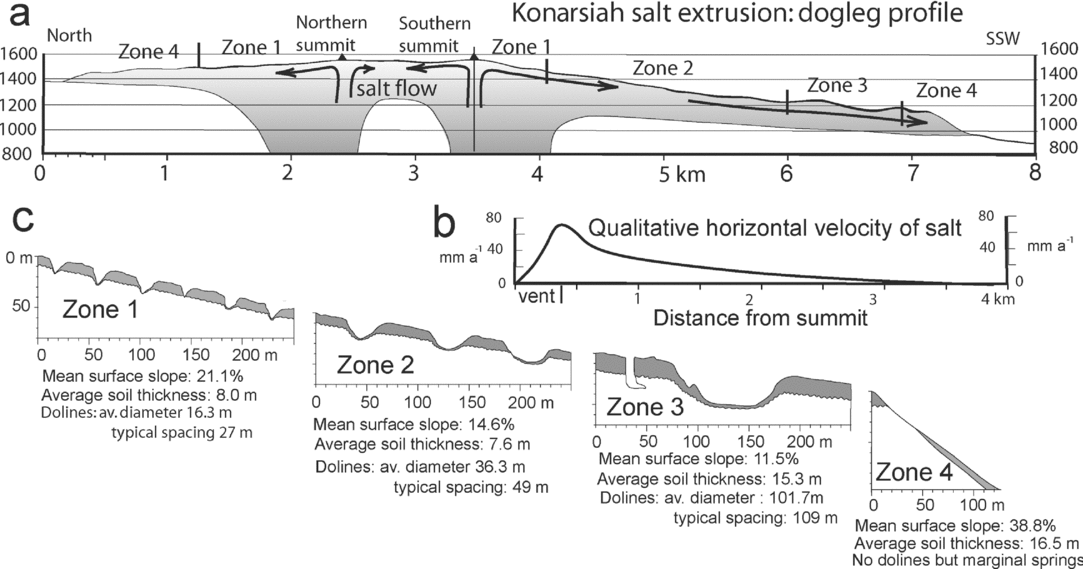
True scale profiles of Konarsiah and its four zones. (a) Dogleg profile along path shown on Figure 3. (b) Qualitative graph of horizontal velocity of salt flow from southern summit to SSW (after models in Talbot et al. Reference Talbot, Medvedev, Alavi, Shahrivar, Heidari, Vendeville, Mart and Vigneresse2000). (c) Cartoons of karst features, soils and salt in zones 1–4.

5. Konarsiah hydrology
Konarsiah was chosen for study of the factors that control its karstic features because of its remarkably simple hydrology (Zarei & Raeisi, Reference Zarei and Raeisi2010). Konarsiah stands hundreds of metres above its immediate surroundings so all its water input is by precipitation onto its surface (Fig. 2a). It lies in a semi-arid region with a mean annual precipitation of 400 mm that falls as rain from October to March with some winter snow.
Salt is exposed in only 1.1% of its area, some in the walls of dolines and shafts but most on marginal slopes steeper than 50° (Fig. 4). Slopes gentler than ~ 40° are blanketed by residual soils that support an almost continuous cover of grasses and a few stunted wild pistachio and almond trees, together with a small patch of dry farming.
The surface of Konarsiah can be divided into two sub-basins: one internal (16.6 km2) and the other marginal (20.9 km2). The internal sub-basin is closed and surface runoff drains into its many dolines. All precipitation falling on this sub-basin evaporates or infiltrates. By contrast, the steep slopes (≥ 38%) of the marginal sub-basin drain significant surface water off Konarsiah via a network of numerous gullies without dolines. The runoff coefficient is estimated at 37% for the marginal sub-basin taking account of its steep slopes and vegetated soil cover. Therefore, disregarding surface runoff from the internal basin, the weighted runoff coefficient of the whole salt body is calculated at about 21%. Taking account of the spring discharge and subsurface flow into the adjacent aquifer during the measuring period with its total precipitation of 187 mm, the effective rainfall was estimated at 19.6 L s−1 (= 16.5 mm) (Zarei & Raeisi, Reference Zarei and Raeisi2010). Thus about 70% of the precipitation falling on the salt body evaporates or transpires, while about 9% of the effective rainfall diffuses through the permeable soil to dissolve the underlying salt (M. Zarei, unpub. Ph.D. thesis, Shiraz Univ., Reference Zarei and Raeisi2010).
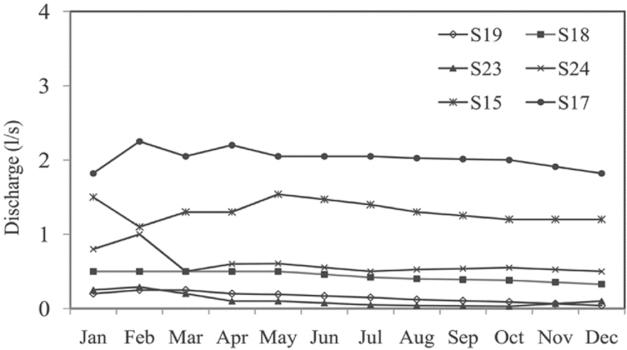
Subsurface brines in Konarsiah percolate downslope though a thin (~ 10–30 m) zone of permeable dilated salt over confined (flowing and therefore impermeable) salt towards an alluvial plain in the south with diversions towards eight brine springs, adjacent alluvium and karst aquifers (Fig. 3). The constant flow rate of marginal brine springs and numerous discharge zones confirm that groundwater diffuses off the Konarsiah salt diapir (Fig. 5).
Hydrograph of selected Konarsiah brine springs in the measured period (from Zarei & Raeisi, Reference Zarei and Raeisi2010).

Zarei & Raeisi (Reference Zarei and Raeisi2010) report monthly measurements of the electrical conductivity (EC), flow rate, temperature, pH and major ion concentrations from September 2007 to August 2008 in 17 springs and 4 measuring stations on the two flanking streams and the river on which they converge (Fig. 3). The discharge and EC of four major brine springs emerging from the salt were measured daily during the wet season of 2009 (Fig. 5).
Apart from a few shafts and inlet caves, 11.2% of the surface of Konarsiah is scarred by 2631 dolines attributed to suffosion of the soil and collapse of both soil and salt (Fig. 3). Zarei & Raeisi (Reference Zarei and Raeisi2010) divided the salt extruded at Konarsiah into four zones characterized by different surface slopes and soil thickness and by dolines with variable diameters (1 to 774 m), depths (0.3 to 58.5 m) and spacing (Figs 3, 4). Most dolines are symmetrical and circular, < 20 m across and between 10 and 15 m deep without a preferred orientation in random distribution patterns. No dolines, shafts, or caves occur in zone 4 where soils thin as they slump or wash down steep slopes.
Shafts at the bottom of the larger dolines vary from 0.5 to 20 m in diameter and from 2 to 60 m in depth. No integrated cave systems were found and only a few inaccessible sub-horizontal inlet caves up to several metres long were seen in salt at some shaft bottoms. Either the runoff water infiltrates into the underlying brine aquifer or is NaCl-saturated.
Eight permanent springs essentially saturated in NaCl (with total dissolved solids (TDS) from 323.6 to 330.9 g L−1) drain from the Konarsiah body (Figs 3, 5). One small spring (with a monthly discharge of 0.03 L s−1) is within the extrusion, but the others (0.2 L s−1 to 2.8 L s−1) are at its margins. Brackish water in the largest spring (S20) emerges with an annual average discharge of 141 L s−1 from where the eastern Sarvak Aquifer is faulted at the margin of the salt (Fig. 3).
The average annual flow rates of the Mangerak Creek (R25, Fig. 3), Konar Creek (R13) and Konar River measuring stations were 99, 23 and 287 L s−1, respectively. The water in these stations was NaCl type and the TDS varied from 20.6 to 34.8 g L−1. Spring discharge increases after a heavy rain but the maximum was only 6.7 L s−1, too low to indicate conduit flow.
We emphasize that there is no evidence for significant caves in the salt of Konarsiah. Instead, field observations and hydrological measurements imply that water diffuses along a thin (~ 10 m to a maximum of 30 m) zone of salt that lies just beneath the soil and is probably rendered permeable by microfractures. Talbot (Reference Talbot, McClay and Price1981, Reference Talbot, Blundell and Scott1998) described temporary rivers flowing over salt that is impermeable because it is still confined and flowing despite being exposed between dilated interfluves.
6. Konarsiah soils
Dissolution of the salt releases the 2–10 vol.% of relatively insoluble components in the Hormoz sequence (Bruthans et al. Reference Bruthans, Asadi, Filippi, Vilhelm and Zare2008). These remain essentially in place as practically uniform reddish brown to buff soils rich in anhydrite and clay minerals with some gypsum, haematite, calcite, dolomite and quartz (Bruthans et al. Reference Bruthans, Asadi, Filippi, Vilhelm and Zare2008). These soils are porous and non-cohesive to depths of a few decimetres, sometimes beneath a thin (<1 cm) gypsiferous crust. Surfaces of dry undisturbed bare soil take deep footprints, but turn sticky and slippery when wet. These soils compact at depths of a few metres to a solid mass needing a pick to excavate. Dispersed solid inclusions can exceed 10 m in thickness and width and are carried downslope in the salt until they ground near the margins. Although substantial volumes of soil subside into the dolines, most remains on the salt. The only significant loss of residual soils from Konarsiah occurs where soils fall or are washed off the steep outer margins.
Konarsiah's mantle of residual blocky soils is 4–32 m thick (average 16.7 m) and obscures the rockhead and how the soils relate to the underlying salt. Most descriptions of the boundary between salt and overlying soils (Bosak et al. Reference Bosak, Bruthans, Filippi, Svoboda and Smid1999; Waltham, Reference Waltham2007) are from coastal diapirs that have been subjected to marine erosion in the last 10 ka so that the rockhead is often pinnacled between imported soils. Talbot (Reference Talbot2004) described and illustrated the top of the salt soon after it was stripped of its residual soils (prior to being quarried) in a region of northern Iran subject to an annual precipitation of ~ 400 mm y−1 (like Konarsiah). Rain and groundwater percolates through soils up to 7 m thick and dissolves the top of the salt into smooth-sided funnel-shaped or cylindrical dolines (~ 1 m in diameter) that form independently of either bedding or grain-shape fabrics in the salt. At depths of 1–4 m in the rockhead, the rounded bases of these dolines connect via numerous microscopic sub-horizontal channels. These anastomose along grain boundaries and microfractures through dilated salt. The residual soils choked each doline in the rockhead and there was no sign of them being washed from one doline to another, a situation we consider likely at Konarsiah.
7. Salt dissolution rates
At 25°C, 100 cc of pure water can dissolve 36 g of NaCl of density 2165 kg m3. One centimetre of rain can therefore potentially dissolve a 0.167 cm column of salt, implying a theoretical salt dissolution rate of ~ 17% of the annual precipitation (Talbot & Jarvis, Reference Talbot and Jarvis1984). However, direct field measurements in Israel, Spain and Iran have found higher dissolution rates (Frumkin, Reference Frumkin1994; Mottershead et al. Reference Mottershead, Duane, Inkpen, Wright, Gutiérrez, Gutiérrez, Desir, Guerrero, Lucha, Marín and García-Ruiz2005; Bruthans et al. Reference Bruthans, Asadi, Filippi, Vilhelm and Zare2008). Thus the precipitation of 295 mm y−1 from 2000 to 2005 had the potential to dissolve 50–80 mm y−1 of salt on Kuh-e-Jahani, 10 km to the SSE of Konarsiah (Bruthans et al. Reference Bruthans, Asadi, Filippi, Vilhelm and Zare2008). These authors measured a denudation rate of bare salt of ≤ 120 mm y−1 but took 90 mm y−1 as representative. They found the surface of thin (< 5 m) residual capsoils denuded at an average rate that was 2% of that of salt exposed nearby. They also found that the rate was too slow to measure in thicker soils. They speculated that soils upslope of their monitoring pegs slowly released water so that these very high denudation rates were due to more than the direct rainfall. However, micro-organisms may also have accelerated salt dissolution.
8. The effect of a moving substrate
The simple picture of broadly concentric zones with many small closely spaced dolines in salt covered by thin soils maturing downslope to a few large dolines in thickening soils (Figs 2, 3) could be attributed to the surface slope on a body of static salt. However, the profile of Konarsiah resembles a salt droplet between a vigorous salt fountain and a degrading droplet. We therefore explore the notion that salt is recycling through Konarsiah by constraining the horizontal rate of salt flow that accounts for the rate at which the soils thicken with distance as the salt releases its insoluble components.
We apply to Konarsiah the classical approach used to constrain degradation rates in carbonate karst terranes (Ford & Williams, Reference Ford and Williams2007). Measurements of the monthly discharge and chloride concentration in the hydrological year 2007–2008 constrain the mass of salt dissolved from Konarsiah to near 185000000 kg. Taking account of the density and area of the extruded salt (37488000 m2) implies that the top of salt at Konarsiah subsided at a rate near 2.3 mm y−1 that year. However, the total precipitation of 187 mm that year was less than the 25-year mean annual precipitation of 400 mm (M. Zarei, unpub. Ph.D. thesis, Shiraz Univ., Reference Zarei and Raeisi2010). Correcting for this factor suggests a long-term salt dissolution rate nearer 4.9 mm y−1.
Most of our data were measured in non-flood conditions. Measurements of TDS made during a single flood increase the annual denudation rate by < 1%. A generous estimate of ten flood events per year would increase the salt denudation rate by 10%, to 5.4 mm y−1. This lies within the range of the 4–7 mm y−1 total denudation rate estimated for soil-capped coastal diapirs by Bruthans et al. (Reference Bruthans, Asadi, Filippi, Vilhelm and Zare2008).
9. Rate constraint
We now calculate a likely age of distal salt and thereby constrain its rate of horizontal flow and extrusion out of the vents. To simplify our calculations, we take a single value of 5 vol.% as representative for the volume of insoluble components in the salt of Konarsiah. This is close to the vol.% of impurities determined by X-ray fluorescence analyses of rock salt and soil residuum samples from the nearby Jahani salt diapir reported by Bruthans et al. (Reference Bruthans, Filippi, Asadi, Zare, Šlechta and ChuráˇCková2009, table 2). So, dissolution of the salt surface at 5.4 mm y−1 releases its 5 vol.% of impurities to increase the soil thickness at 0.27 mm y−1. To generate the 32 m maximum thickness of soil measured on Konarsiah would thus take (32000/0.27) = 118518 years. To reach zone 4, 3500 m from the summit in the SSW profile in this time would require the salt to have flowed at an average horizontal rate of (3500/118518) = 0.0295 m y−1 or 29.5 mm y−1.
To generate the soil thickness of 30 m entering zone 4 at 3960 m SSW of the southern summit (Figs 3, 4) implies a slightly shorter time (30000/0.27 = 111111 years) and an average horizontal flow rates of salt of (3960/111111) = 0.0356 m y−1 or 35.6 mm y−1.
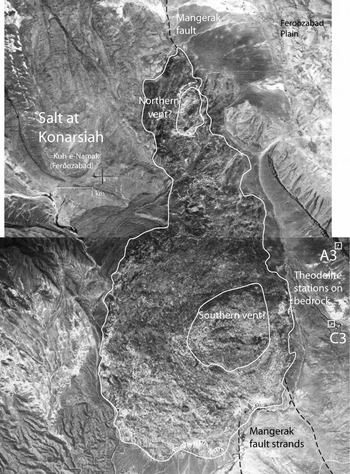
To replace the salt dissolved from the whole area of Konarsiah (37488000 m2) at 5.4 mm y−1 (= 2.024352 × 1011 mm3 yr−1) requires salt to rise out of the likely combined areas of the two vents (2822250 m2) at a rate of (2.024352 × 1011 mm3 yr−1/2.82225 × 109 mm2) = 71.73 mm yr−1, over 7 cm y−1. The two vents inferred to supply Konarsiah (Fig. 4a) are out of sight but their likely locations and areas have been approximated using flow fabrics on the top of the salt (Fig. 6).
An aerial photo laydown showing edge of salt on Konarsiah (= Kuh-e-Namak, Feroosabad), the likely outlines of surface salt rising from the two vents, traces of strands of the Mangerak fault in its country rocks, and the location of theodolite stations A3 and C3 from which measurements in Figures 7 and 8 were made.

10. Measured flow rates
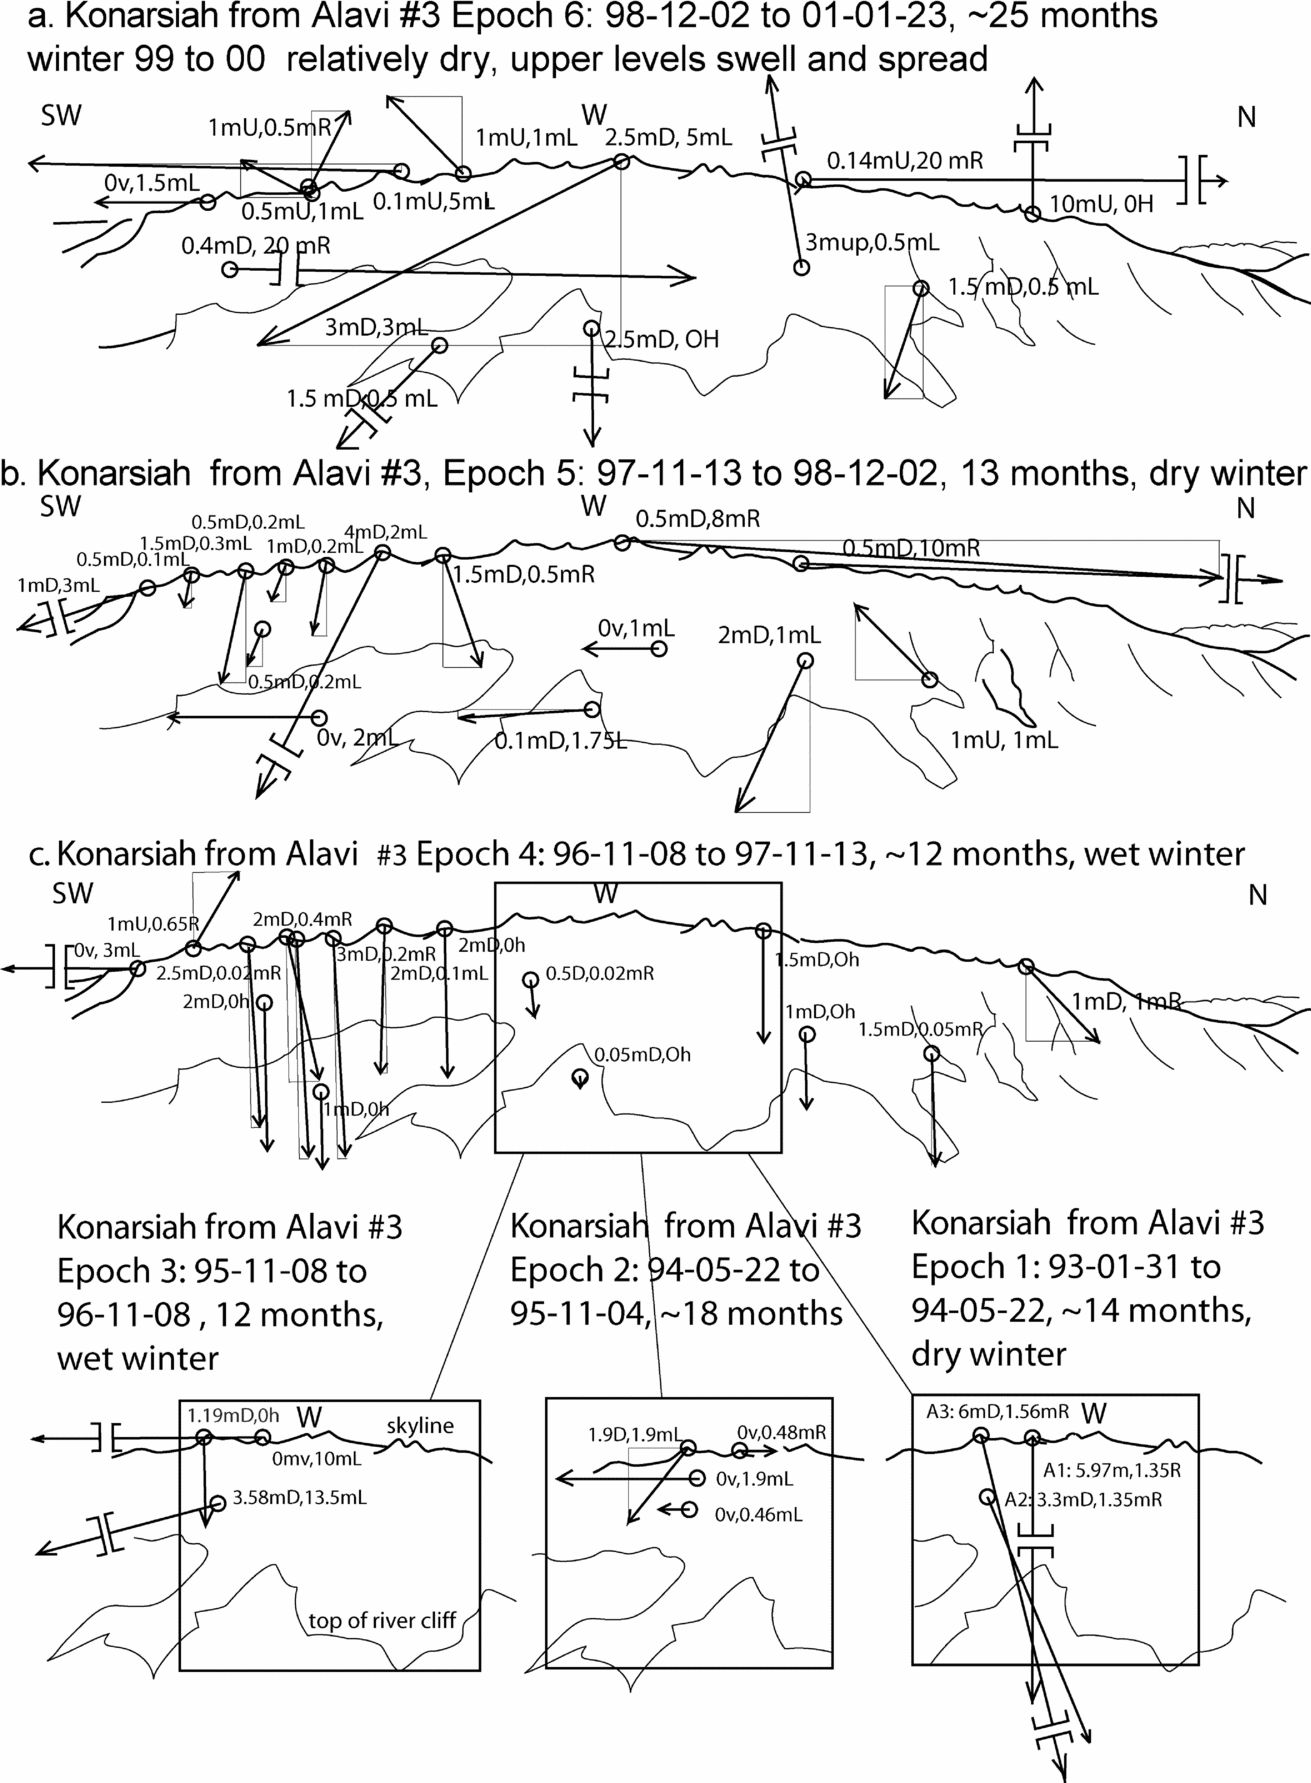
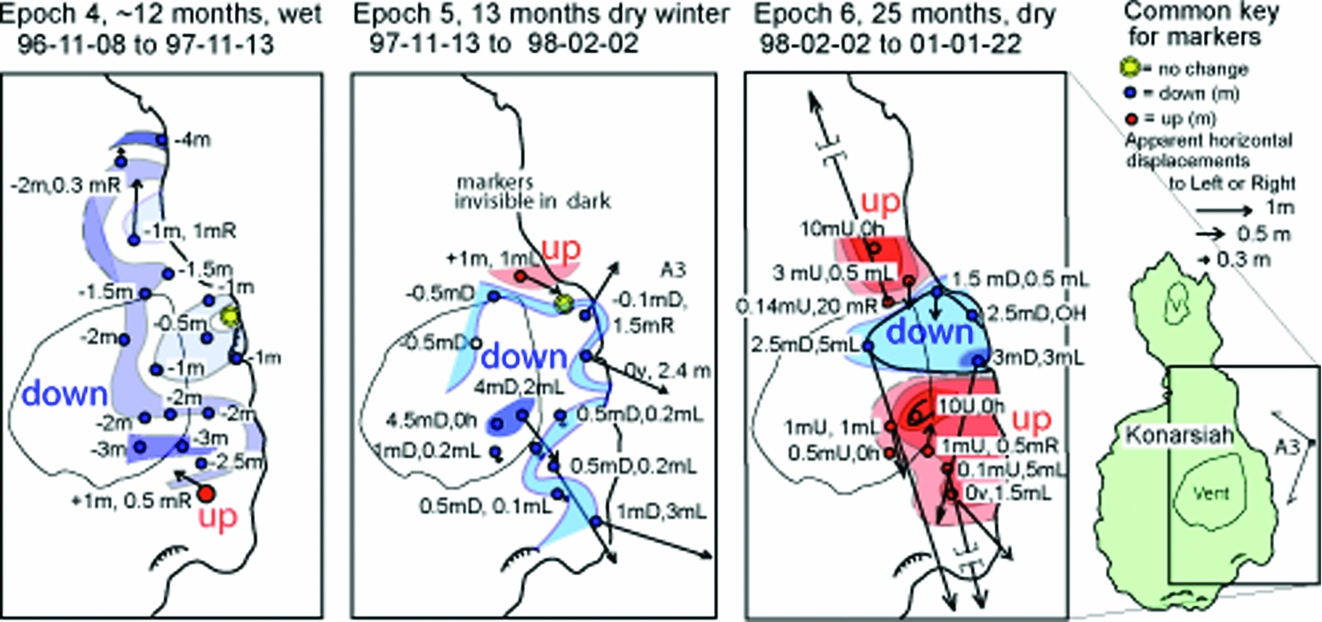
The flow rates calculated above are lower than those of markers on Konarsiah measured after six irregular intervals between 1993 and 2001 (Figs 7, 8). These figures summarize data documented in unpublished annual reports to the Geological Survey of Iran made by the ‘Salt Kinematics in Iran Research programme’. The locations of natural markers on Konarsiah (carefully described trees, bushes and boulders, etc.) were measured by theodolite (to an accuracy estimated at ± 1 dm) from survey stations A3 and/or C3 located on the Sarvak Limestone overlooking the salt of Konarsiah (Fig. 7). Many new markers were added in 1996 to the few used in the first three intervals and a few markers lost in later years were replaced. Displacement vectors for markers during the last three increments shown on sketches of Konarsiah seen from Alavi #3 (Fig. 6) are mapped on Figure 8 where the vertical components are contoured by eye.
Scaled vectors of displacements of natural markers shown on perspective sketch of Konarsiah as seen from theodolite survey station Alavi #3 over six epochs. Heavy lines indicate skyline of Konarsiah; thin lines indicate tops of river cliffs or conspicuous ridges. Displacement of each marker is reported in metres U or D (up or down) and L or R (left or right). Ov or Oh means no measurable vertical or horizontal movement. The readings shown have an accuracy estimated at ± 1 dm. Some markers were lost and new markers were added over the years. Data from unpublished Talbot reports to the Geological Survey of Iran from 1993 to 2001.

Crude contours of vertical displacements of markers (and scaled vectors of horizontal displacements) on Konarsiah measured from theodolite station Alavi #3 on bedrock during three increments. Displacement terminology here as in Figure 7.

Translating the displacements per measurement interval (Figs 7, 8) into velocities per year (± ~ 0.5 m y−1), 15 markers had subsided at an average rate of 1.3 m y−1 and moved downslope at 2.7 m y−1 in the wet 12 months before the November of 1997. In the 13 months before the dry December of 1998, the 15 markers moved downslope at 1.6 m y−1 and sank at 0.98 m y−1. In the next 25 months, to January 2001, the surviving 12 markers moved downslope at an average of 1.04 m y−1. Seven of the highest rose at 2.1 m y−1 and the lower five sank at 1.98 m y−1.
The rise and fall of markers from year to year is characteristic of Iranian salt extrusions (see e.g. Talbot et al. Reference Talbot, Medvedev, Alavi, Shahrivar, Heidari, Vendeville, Mart and Vigneresse2000). We attribute this effect to steady extrusion of salt from depth swelling the summit area in dry intervals and gravity spreading downslope when the salt was wet. Synthetic aperture radar interferometry has since confirmed up and down movements of the surface of an active salt extrusion in a complicated response to rainfall in the eastern Zagros (Aftabi et al. Reference Aftabi, Roustaie, Alsop and Talbot2010).
The disparity between the horizontal flow rates for salt constrained by surface marker measurements (Fig. 7) and their average rate by hydrology (Fig. 9) are not as significant as they might seem. Consider (Fig. 4b) the modelled curve of horizontal velocities on the surface of a salt extrusion (From Talbot et al. Reference Talbot, Medvedev, Alavi, Shahrivar, Heidari, Vendeville, Mart and Vigneresse2000, fig. 9). The horizontal flow rate is zero above the centre of the vent, increases to a maximum over the lip of the vent and thereafter falls asymptotically to zero at the terminus. Notice that measurements of surface markers near the vent are expected to be much faster than the average rate. The hydrological year 2007–2008 was also noticeably drier than previous years.
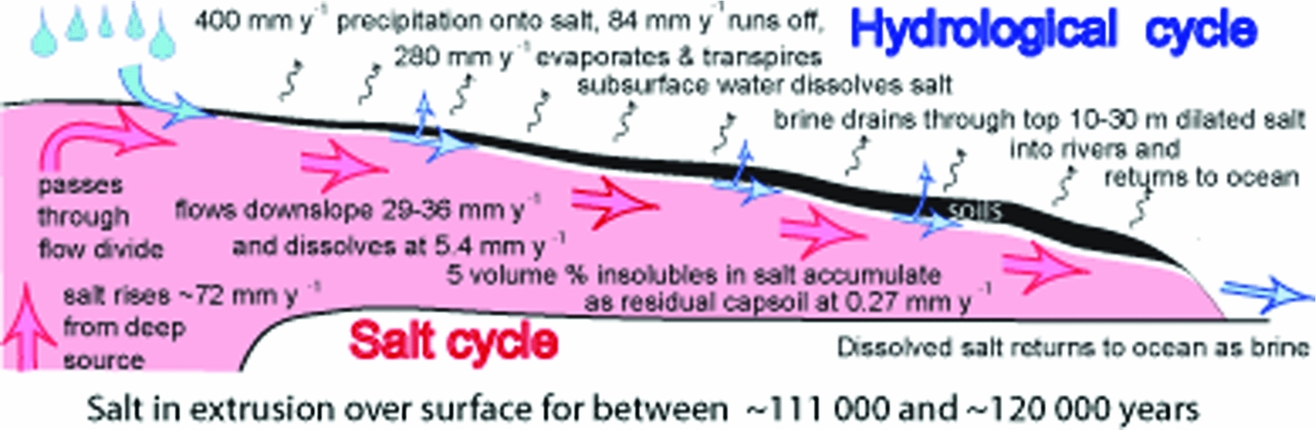
Conceptual cartoon of how the global cycles of H2O and NaCl interact at Konarsiah.

11. Conclusions
Figure 9 summarizes our current understanding of how the global H2O and NaCl cycles interact to generate the karst topography on the dynamic salt of Konarsiah. About 70% of the long-term annual precipitation of 400 mm on Konarsiah probably evaporates and transpires and only about 20% runs off the surface. The ~ 10% of the precipitation that percolates down to the salt rapidly becomes brine that is inferred to diffuse downslope in a thin zone of microscopically dilated salt above impermeable confined and flowing salt. The salt is dissolved at a rate near 5.4 mm y−1, and its 5 vol.% of insoluble impurities accumulate vertically in place as a soil at 0.27 mm y−1. To reach zone 4 with a thickness of 30–32 m requires the dissolution of a salt thickness between 600 and 640 m in a time between ~ 110000 and 120000 years. The distances of 3500 m reached by salt in zone 4 in the WSW and 3960 m in the SSW requires the salt to flow at average horizontal rates of between 29.5 and 35.6 mm y−1. This in turn requires the salt to rise out of the two unseen vents at an average rate estimated to be approximately 72 mm y−1. These rates of salt velocity are acceptable in view of the limited field measurements available. Our order of magnitude calculations suggest that Konarsiah is still a waning salt fountain rather than already a salt droplet.
Subcategories of salt karst terranes develop (i) on exposed recent salt, (ii) above old buried salt, (iii) on salt rising in emergent diapirs, (iv) on salt diapirs extruding rapidly, and (v) on salt glaciers moving slowly downslope. Well-exposed salt rising vertically in diapirs from which former extrusions were removed by Holocene marine erosion near Bandar Abbas (iii) develop nearly every known category of karst feature (Bruthans et al. Reference Bruthans, Asadi, Filippi, Vilhelm and Zare2008; Bosak et al. Reference Bosak, Bruthans, Filippi, Svoboda and Smid1999). By contrast, Konarsiah exemplifies a karst topography developing on a dynamic salt substrate (iv) with small areas of subcategory (iii), with (v) more common in the relatively humid NW Zagros Mountains. The residual soils on Konarsiah may be re-structured as they thicken on salt flowing downslope but are only spilled off the salt fountain when they reach its steep outer margins that equate to the termini of glaciers of ice.
The soils that mantle Konarsiah limit the range of classical karst features and probably also subdue occasional surges of the salt making up Konarsiah and its salt glaciers. Small closely spaced solution dolines in new salt near the summits enlarge as they are carried downslope and joined by subsidence dolines in the soil cover and a few shafts and inlet caves that all collapse at the steep margins. Open cave systems appear to be absent, if only because most of the deeper salt is flowing so that it tends to seal its own voids and remains impermeable.
Bruthans et al. (Reference Bruthans, Filippi, Asadi, Zare, Šlechta and ChuráˇCková2009) pointed out that the diapirs protected by thick soils and vegetation in the humid mountains erode more slowly than those less protected by thinner soils nearer the arid Gulf coast. They argued convincingly that the residual soil types on salt diapirs emergent in the Zagros are changing as the vegetative cover at increasing distances inland has been destroyed since the relatively damp climate between 10 and 6 ka BP became more arid after 6 ka BP. However, it also has to be borne in mind that the soil-covered inland extrusions have been extruding longer than the higher and more vigorous extrusions near the coast (Talbot & Alavi, Reference Talbot, Alavi, Alsop, Blundell and Davison1996).
Extruded salt with its bimodal grain size is weaker than diapiric salt with its uniform grain size; extruded salt also flows faster when wet than dry (Schleder & Urai, Reference Schleder and Urai2006). Talbot & Aftabi (Reference Talbot and Aftabi2004) used laboratory experiments to suggest that the major recumbent folds inside salt extrusions (Fig. 2g) record changes in the ratios at which diapiric salt extrudes and spreads downslope under gravity. As salt extrusion rates are likely to be essentially constant over millions of years, their internal folds likely represent wetter intervals when the extruded salt gravity spreads faster. In effect, the major recumbent folds within salt extrusions record climate changes.
Salt extrusions that advance when protected by vegetated soil covers indicate humid climatic conditions. Salt extrusions that retreat as their protective covers of vegetated soils are stripped by erosion indicate arid conditions. The soil types of subaerial salt extrusions therefore join their external shapes and internal recumbent folds as potential proxies of climatic change.
Acknowledgements
We thank reviewers Tony Waltham and Jiri Bruthans for very thorough and constructive reviews that helped to clarify our argument considerably. MZ and ER were financed by the Centre of Excellency for Environmental Geohazards and the Department of Earth Sciences, Shiraz University. CJT thanks Dr Korehei, former General Director of the Geological Survey of Iran and his colleagues for their encouragement and considerable logistical support during annual month-long visits to Iran from 1993–2006 for the research project on the kinematics of Iranian salt. The Swedish Science Foundation paid for CJT's travel to and from Iran.